A Feasibility Study for Modelling Tie
Strength with the Facebook API
Diogo Pereira
Supervisor:
Prof. Ian Oakley, PhD
Co-Supervisor:
Tasos Spiliotopoulos, MSc
Funchal – Portugal September 2012
1
ABSTRACT
This thesis examines the concept of tie strength and investigates how it can be determined on the fly in the Facebook Social Network Service (SNS) by a system constructed using the standard developer API. We analyze and compare two different models: the first one is an adaptation of previous literature (Gilbert & Karahalios, 2009), the second model is built from scratch and based on a dataset obtained from an online survey. This survey took the form of a Facebook application that collected subjective ratings of the strength of 1642 ties (friendships) from 85 different participants. The new tie strength model was built based on this dataset by using a multiple regression method. We saw that the new model performed slightly better than the original adapted model, plus it had the advantage of being easier to implement. In conclusion, this thesis has shown that tie strength models capable of serving as useful friendship predictors are easily implementable in a Facebook application via standard API calls. In addition to a new tie strength model, the methodology adopted in this work permitted observation of the weights of each predictive variable used in the model, increasing the visibility of the factors that affects peoples’ relationships in online social networks.
Keywords
2
RESUMO
Esta tese tem como objectivo estudar o conceito tie strength (força de ligação) e investiga como pode ser implementado em tempo real na rede social online Facebook a partir de um sistema construído através da sua própria API. Foram analisados e comparados dois tie strength algoritmos: o primeiro é uma adaptação da literatura passada; o segundo modelo foi construído de raiz, baseado em dados colhidos a partir de um questionário online. Esse questionário está em forma de uma aplicação de Facebook, colhendo assim um total de 1642 amizades de 85 participantes distintos. O novo modelo foi então construído baseado nesse conjunto de dados e usando para o efeito o método de múltipla regressão. Vimos que o modelo recém-criado teve um desempenho ligeiramente melhor em relação ao modelo anterior, sendo ainda mais fácil de implementar. Em conclusão, esta tese demonstra que ambos os modelos são úteis em prever amizades no Facebook e ao mesmo tempo são fáceis de incorporar numa aplicação de Facebook usando para o efeito a sua própria API. Adicionalmente a um modelo de tie strength, a metodologia utilizada permitiu também compreender quais as variáveis que têm mais influência na predição de tie strength, tornando visível quais os factores que influenciam os relacionamentos das pessoas nas redes sociais online.
Palavras-Chave
3
ACKNOWLEDGMENTS
First of all, I want to thank both my supervisors: Professor Ian Oakley and Tasos Spiliotopoulos for their guidance, teachings and will to help me throughout the journey of creating this thesis. I have learned many things from them.
Moreover, I want to express my immense gratitude to my family, especially my parents, my both grandmothers and my girlfriend, for all their support and encouragement to make this thesis.
Finally, I want to say that it was a pleasure to work along my friends and colleagues from University of Madeira, which also helped me testing my application, which I am very grateful.
4
TABLE OF CONTENTS
LIST OF FIGURES ... 6 LIST OF TABLES ... 8 LIST OF CHARTS... 10 1. INTRODUCTION ... 111.1. GOALS AND OVERVIEW ... 11
1.2. MOTIVATION AND BACKGROUND ... 11
1.3. CONTRIBUTION ... 12
1.4. STRUCTURE ... 13
2. LITERATURE REVIEW... 14
2.1. SOCIAL NETWORK SITES ... 14
2.1.1. Definition ... 14
2.1.2. Brief History of SNSs ... 14
2.1.3. Why people use SNSs... 15
2.2. SOCIAL NETWORK ANALYSIS... 16
2.2.1. Computational Social Science ... 17
2.2.2. Applications of Computational Social Science ... 18
2.3. TIE STRENGTH ... 18
2.3.1. Why Tie Strength is important?... 18
2.3.2. Tie Strength and Social Capital ... 19
2.3.3. How to measure Tie Strength ... 19
2.3.4. Measuring Tie Strength in social media ... 20
2.3.5. Measuring Tie Strength in SNSs... 21
2.3.6. Practical implementation of a tie strength model ... 22
2.4. DATA EXTRACTION ... 23 3. METHODS ... 25 3.1. STUDY DESIGN ... 25 3.2. THEORETICAL APPROACH ... 25 3.2.1. Pilots Test ... 26 3.3. PARTICIPANTS ... 29 3.4. MEASURES ... 31
3.4.1. Gilbert and Karahalios model’s predictive variables ... 31
3.4.2. Predictive variables for the new model ... 33
3.5. MATERIALS ... 34
3.5.1. The Survey ... 34
3.5.2. Tie Strength Algorithm implementation ... 37
3.6. RESEARCH QUESTIONS ... 37
4. APPLICATION ARCHITECTURE ... 39
4.1. IFRAME APPLICATIONS... 39
4.2. SECURITY ... 39
4.3. AUTHENTICATION AND PERMISSIONS ... 39
4.4. FACEBOOK SDK FOR PHP ... 42
4.5. GRAPH API... 43
5 4.7. BATCH REQUESTS ... 44 4.8. DATA COLLECTION ... 45 4.9. FILE ORGANIZATION ... 47 5. RESULTS ... 49 5.1. WHY MULTIPLE REGRESSION? ... 49
5.2. VARIABLES ENTERED IN THE MODEL ... 49
5.3. THE NEW MODEL ... 51
5.4. TIE STRENGTH MODEL USING GILBERT’S BETA COEFFICIENTS ... 54
5.5. SMALL VALIDATION STUDY ... 58
5.6. SURVEY’S QUESTIONS ... 60
6. DISCUSSION ... 62
6.1. EVALUATION OF THE SAMPLING METHOD ... 64
6.2. STUDY LIMITATIONS ... 65
7. CONCLUSION ... 66
7.1. FUTURE WORK ... 67
REFERENCES ... 68
APPENDIX 1. SNA METRICS ... 74
Degree Centrality ... 74
Betweenness Centrality ... 74
Clustering Coefficient ... 75
Other metrics of interest ... 76
APPENDIX 2. GRAPHML FILES ... 77
6
LIST OF FIGURES
Figure 1 - Mathematical graph representing people (nodes) and their relationships (edges). This is a directed graph, as we can see there are only two reciprocal connections (Drew with Eliot, and Drew with Sarah) (Wasserman & Faust, 1994) 16 Figure 2 - Data collection process adopted in Catanese et al., 2011 24 Figure 3 - Survey’s start page with a short description of the study. 35 Figure 4 - Survey's main page displaying 8 questions for one random friend 36 Figure 5 - A Facebook App is a Web application inside Facebook, i.e. an iframe 39 Figure 6 - Application authorization dialog 40 Figure 7 - Dialog box asking for extended permissions 41 Figure 8 - Snippet for asking Facebook permissions 41 Figure 9- Initialization of the Facebook object 42 Figure 10 - Code to get all participant's friends 42
Figure 11 - JavaScript SDK initialization 43
Figure 12 - Query that returns a JSON object with all the friends that will attend an event
that the current user will participate. 44
Figure 13 - EER diagram of the database used, note that table user plays a central role 46
Figure 14 - Application's file scheme 48
Figure 15 - A participant's network displayed in the program Gephi and obtained from the
GraphML file 77
Figure 16 - Choosing language page, the first page to be shown 78 Figure 17 - Learn more section, it is available from within the application, right after
choosing the language 78
Figure 18 - Demographic questions about the participants 79 Figure 19 - Some funny phrases for some friends that the participant rated. These phrases were only available for the friends that the participant rated 79
7
Figure 20 - Top 10 friends, provided after the participant rated at least 20 of their friends
80 Figure 21 - Last page shown in the application 81
8
LIST OF TABLES
Table 1 - Typology of ties studies in SNA, edges can be represented by the above 4
different categories (Borgatti et al., 2009) 17
Table 2 - List of offline indicators along with their respective references (Petróczi et al.,
2006) 20
Table 3 - Gilbert and Karahalios defined 7 dimensions of tie strength based on past literature (left column). On the right column are defined some of the 74 Facebook
predictive variables predictors of tie strength 22
Table 4 - Descriptive statistics for the tie strength model, the five questions and the mean
of the five tie strength questions 26
Table 5 - Correlation between the model and the five participant’s answers, including their
mean 28
Table 6 - Predictive variables and how they were retrieved 32 Table 7 - Facebook predictive variables used to build the new model 33 Table 8 - Levels and correspondent degree of relatedness 34 Table 9 - Descriptive statistics for the "How strong is your relationship with this person?”
question 50
Table 10 - Descriptive statistics for the 13 predictive variables 51
Table 11 - Overall Model Fitt 51
Table 12 - ANOVA table 52
Table 13 - List of the predictive variables and their respective coefficients and significance
level 53
Table 14 – Correlation between the tie strength question and the new model (six terms) 54 Table 15 - Predictive variables and their respective beta coefficients. The coefficients were
drawn directly from Gilbert and Karahalios. 55
Table 16 - Correlation between the tie strength question and the tie strength scores
obtained by the algorithm 57
Table 17 - Correlations between the main question, new model predictions and Gilbert's
9
Table 18 - Model summary 60
Table 19 - Descriptive statistics for the seven remaining questions 61 Table 20 - Correlation between the survey's answers. Correlation is significant at the 0.01
10
LIST OF CHARTS
Chart 1 - Distribution of the mean of the five tie strength questions 27 Chart 2 - Distribution of the tie strength algorithm for the corresponding 200 friendships
rated 27
Chart 3 - Scatter plot for the respondent's answers and tie strength values 28
Chart 4 - Friends rating distribution 29
Chart 5 - Participant's age and gender distribution 30
Chart 6 - Participants' nationalities 31
Chart 7 - Frequency of the tie strength question - "How strong is your relationship with this
person?” 50
Chart 8 - Scatter plot for the respondent's answers and correspondent new model scores
54 Chart 9 - Distribution of the tie strength scores for all the participant's friendships 56 Chart 10 - Distribution of the tie strength scores for only participant's friendships that
were rated 56
Chart 11 - Scatter plot for the respondent's answers and tie strength values 57 Chart 12 - Distribution of the survey’s answers 58 Chart 13 - Scatter plot for the survey's answers and the new model predictions 59 Chart 14 - Scatter plot for the survey's answers and Gilbert's partial algorithm 59
11
1.
INTRODUCTION
1.1.
Goals and Overview
This thesis aims to explore the feasibility of calculating tie strength on the Facebook social network site live, in real time and using data captured directly from the Facebook API. To achieve this, a survey in form of a facebook application was built with two goals in mind: to validate and adapt a previous published offline tie strength model to an online scenario; and to collect interpersonal data. The data collected was then used to build a refined tie strength model; this step was achieved by performing a multiple regression analysis on the data. Finally, both models were analyzed and conclusions draw as to which factors can indeed predict a friendship between two persons – tie strength prediction. This same analysis outputs a prediction equation that can be easily incorporated into a Facebook application.
1.2.
Motivation and Background
The exponential rise of social network sites (SNS) in the last years was the main motivation to engage in this work. SNSs like Facebook, Twitter, LinkedIn, etc. are huge repositories of information about their users. This information can be used to analyze and study various aspects of peoples’ lives (Lazer et al., 2009). Today, more than ever, many valuable data are available to researchers, originating a broad range of research studies. These studies cover many topics, such as: social capital, influence, information propagation, trust, privacy, network features, and much more. From all these topics, tie strength was chosen as the main theme of this thesis.
Tie strength notion was first introduced by Granovetter in his landmark paper: The strength of weak ties in 1973. Tie strength is defined as a linear combination of the amount of time, the emotional intensity, the intimacy (or mutual confiding), and the reciprocal services between two persons. It can be simply defined as the bonding level between two persons. Tie strength can be characterized in three types: strong, weak or absent. Strong ties are the people one usually trust, family, or close friends. On the other hand, weak ties are loose relationships, i.e. acquaintances.
The possibility to measure friendships makes tie strength desirable to be studied and modeled. One of the main uses for a tie strength model would be for example categorizing friends on social networks, such as in Facebook smart lists or Google plus circles. In fact Google recently acquired a company named Katango that is uniquely devoted to develop social algorithms - developing automatic friend sorters (tie strength algorithm). Such technology makes the users’ job much easier by automatically those monotonous tasks. Considering another different perspective, one can use a tie strength model to identify strong and weak ties. Emotional support is provided almost exclusively from strong ties
12
contributing for the happiness of an individual. At the first glance, weak ties seems to be useless, however their importance is huge, for example they are said to be more helpful In tasks such as finding a new job, or channels through which information is propagated most efficiently in a social network (Zhao, Wu, & Feng, 2011). Studying tie strength can enhance such models as well improve understanding of their operation.
To illustrate tie strength importance, below are presented a list of some practical applications, some of them are just improvements of already existent services (Gilbert & Karahalios, 2009; Xiang, Neville, & Rogati, 2010):
Link prediction: improved systems for suggesting new connections;
Item recommendation: recommend items that coincide with those a person is strongly related;
Newsfeeds: filter Newsfeeds, prioritizing the updates by relationship strength; People Search: when searching people in a SNS, rank the results according to the
relationship strength of the query sender and the discovered people;
Visualization: improved visualization tools with scaling/shading links according to the estimated relationship strength;
Privacy Controls: system that make privacy choices, i.e. strong ties have less restrictedly privacy options than weak ties;
Broadcast Information: a system that only update strong or weak ties. If an individual wants to share information and wants that it is only accessible for his best friends, then it choose to broadcast only via strong ties. One can choose to share information only with weak ties because it propagates more efficiently (Zhao et al., 2011; Zhao, Wu, & Xu, 2010).
Friend Recommendation: if strong ties A-B and A-C exist, and if B and C are aware of one another, then according to Granovetter (1973), a “psychological strain” may exist between B and C. So, a system that understands tie strength can avoid those recommendations, and make better friend recommendations.
1.3.
Contribution
The Strength of Weak Ties has been cited about 19.000 times, however, very few of those works did not try to make a quantitative or continuous measure of tie strength (Petróczi, Nepusz, & Bazsó, 2006). The most known and successful paper released about this specific subject was Predicting Tie Strength with Social Media by E. Gilbert and K. Karahalios in 2009. In this work, the authors collected personnel data from Facebook, extracting then a huge set of predictive variables that combined, effectively predict tie strength. All the data
13
was captured in a lab and using the Greasemonkey Firefox extension – this means the data was collected at the client side. Only a few predictive variables and their correspondent weights (beta coefficients) were made available on the paper. This motivated a validation process of their partial model in order to check its effectiveness. This validation proved to be insufficient therefore encouraging the construction of a new tie strength model.
In this thesis, as already mentioned, the data extraction process was made on the fly through a Facebook application. The data collected is then used to build a new tie strength model. This thesis offers the following contributions:
1. A tie strength model that can be easily implemented on Facebook by using its own API.
2. Validate or test the Gilbert and Karahalios’ partial tie strength model.
This work intends to offer a model capable of predicting Facebook friendships as also to be easily used for social network developers and researchers. At the same time we make an interpretation and analysis of each predictive variable used in the model.
1.4.
Structure
This thesis is divided in 5 main chapters; bellow follows summary of each chapter:
Literature Review – In this chapter is made a review of the main literature. It contains a detailed introduction of Social Network Analysis and Computational Social Science; the fields which this thesis is embedded. Also, it covers relevant works done with tie strength, with a special focus in Gilbert and Karahalios paper. Methods – This chapter covers mainly the study design. It contains the decisions
behind its design. It is described a pilot which motivated the following work, as well the participants’ demographics. Other explanations regarding the process, application, algorithm/model, and hypothesis are described in this chapter.
Application Architecture – Some technical aspects are covered here. Specifically the Facebook API technology and the Software Development Kit (SDK) used. The database and the file scheme organization are also presented here.
Results – This chapter contains the statistical procedures and analysis of the data previously obtained from the study. It covers a quick introduction of the main method used: multiple regression. The tie strength models and their predictive variables are also analyzed. Some other statistical procedures not directly related with the models are also covered.
Discussion – In this final chapter the results achieved in the previously chapter are interpreted and discussed. We also see if the hypothesis are met or rejected.
14
2.
LITERATURE REVIEW
Social Network Sites (SNS) have gained great popularity in the recent years, attracting the attention of academic and industry researchers therefore originating diverse disciplinary and methodological studies, which addresses a range of topics, and builds on a large body of Computer Mediated Communication (CMC) research. Along with some definitions and concepts, some previous studies relevant to the current work are presented. It will be done an introduction of SNSs, as well a brief history, as well the reasons why people use them. It will also be presented the field that is responsible for studying SNSs as also the theoretical concepts of Social Network Analysis (SNA). After reviewing the basic principles of the field it is introduced the core notion of this work – tie strength. The main and more relevant works about this concept are covered. Still in this chapter, another related concept is covered - social capital, highlighting the relation between both. Finally, the last section covers some methods of data extraction, important knowledge for the generation of the GraphML files.
2.1.
Social Network Sites
The usage of SNSs has increased exponentially in the last years, its popularity is so vast that it is easily noticeable even for people that do not use Internet neither computers. To illustrate this fact, in a recent survey-based study (K. Hampton & Goulet, 2011) – about 79% of American adults stated that they used the Internet, and almost half of American adults (47%), that would be 59% of Internet users, say they use at least one SNS. It gets even more astonishing if you compare it with the percentage of SNS users in 2008, 26% of adult Americans (34% of Internet users, back then); it basically doubled the amount of users in just three years. In this section, along with a formal definition of SNSs, I will make a brief history of SNSs, and try to explain why these sites attract so many people.
2.1.1. Definition
According to Boyd and Ellison (2007) SNSs are defined as a web-based services that allow individuals to create a public or semi-public profile in a bounded system, manage a list of others users with whom they share connections, and navigate through their list of connections and those whose profile is accessible within the system. These features define the skeleton of a SNS, and the nature of these connections varies according to the site.
2.1.2. Brief History of SNSs
The first SNS that was according to the definition above emerged was SixDegrees.com which emerged in 1997. SixDegrees.com allowed users to create profiles and list their friends and introduced a new feature - friend lists which were visible to other another users. SixDegrees.com ended in 2000 however during this period other sites adopted the same features, such as AsianAvenue, BlackPlanet, MiGente, LiveJournal, CyWorld, and
15
LunarStorm. A new generation of SNSs started with Ryze.com launch in 2001, with the main goal of helping people to increase their professional networks. Similar to Ryze.com, LinkedIn surged in 2003 and it is by now (2011) the most powerful business service used by professionals in the web. A year before the launch of LinkedIn, one of the most promising SNS was launched – Friendster. However, after its great popularity, Friendster encountered a quick decline, mainly because of some technical and social difficulties. Its servers were bad equipped to handle the fast growth and faltered several times. Friendster also limited the profiles visibility of users who had more than four degrees way. Some users, in order to view additional profiles started to add other users for the simply expand their reach. This situation originated a large number of fake profiles (especially fake celebrities) to gain more friends and consequently a higher reach (D.M. Boyd, 2006). With the decay of Friendster, MySpace took its place as the most popular SNS, until 2007, where was overtaken by Facebook. Today, Facebook counts with a total of 800 million unique users by July 2011, followed by Twitter who has a quarter of Facebook users (200 million).
There are many SNSs available nowadays some of them will be mentioned below according to their audiences (Danah M. Boyd & Ellison, 2007):
Business networks - e.g. LinkedIn, Visible Path, and Xing. Photo sharing - e.g. Flickr.
Video Sharing - e.g. YouTube.
Friendship - e.g. Facebook, and Friendster. Music – e.g. LastFM, and MySpace. Religion – e.g. MyChurch.
2.1.3.
Why people use SNSs
Adding the fact that SNSs are free and easy to use, Sledgianowski and Kulviwat (2009) advocate that enjoyment is the most important factor which affects the behavior of SNS’s users. Also, SNSs provide a vast range of features that enrich the experience of using these types of sites, for example social games and applications (Lin & Lu, 2011). In some studies (Burke, Kraut, & Marlow, 2011; Ellison, Steinfield, & Lampe, 2007) the usage of Facebook increases social capital, especially bridging social capital. The work of Lampe and Ellison (2006) made a distinction between ‘social browsing’ – the use of the site to develop new connections with the purpose of making an offline interaction, and ‘social searching’ – finding information about known offline people. They found out that the primary use of Facebook it is for ‘social searching’ (maintaining offline relationships), and that ‘social browsing’ obtained a low score among the respondents. This reinforces the idea that SNSs do not necessarily serve the purpose of making new friends, but they are used to reinforce or maintain offline connections (Ellison et al., 2007). In 2008, Joinson used a ‘uses and gratification’ framework to study the uses of Facebook and his findings were similar from previous works, for example, Facebook was mostly used to ‘keep in touch’ with offline
16
friends. Also, Choi (2003) found out that 85% of the study’s respondents listed maintenance and reinforcement of pre-existing social networks as their main motive for using Cyworld. Most of those relationships are acquaintances, however most of the times there is some common offline element that connects the two individuals. This is one of the main differences between SNSs and the earliest forms of CMCs such as newsgroups.
2.2.
Social Network Analysis
SNSs made available on the web, a large amount of information about people’s lives. This data can be fairly easily collected and analyzed to posteriorly be used to understand many social aspects of a particular individual or even an organization. For instance, it is possible to learn how to improve relationships to share knowledge by analyzing and discovering patterns in online social networks. This aspect of the work is performed by Social Network Analysis (SNA). The field that employs SNA as a tool is designated by Computational Social Science which combines Computer Science with SNA.
SNA is based on the simple idea of a network, which involves a set of points linked with each other, and that awareness lead SNA to the mathematical theory of graphs, with the purpose of find a formal model to represent social networks (Scott, 1988).
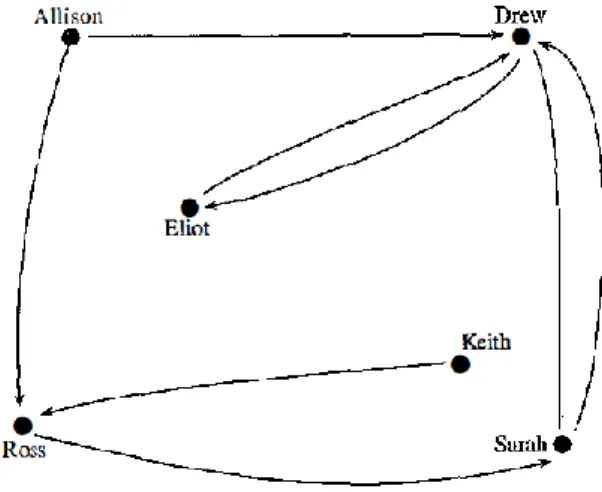
The inherent necessity of human beings to socialize required an organizational structure to represent people and their relationships. This social structure constituted by individuals (or even organizations), which are designated by nodes, are connected by invisible bonds which are linked together in a mesh of connections (Wasserman & Faust, 1994). An example of social network is illustrated in Figure 1.
Figure 1 – Mathematical graphrepresenting people (nodes) and their relationships (edges). This is a directed graph, as we can see there are only two reciprocal connections (Drew with Eliot, and
Drew with Sarah) (Wasserman & Faust, 1994)
The connections between nodes may characterize specific types of interdependency, such as friendship, kinship, professional relationships, and common interest and so on. For example, Borgatti, Mehra, Brass, and Labianca (2009) divided dyadic relations into four
17
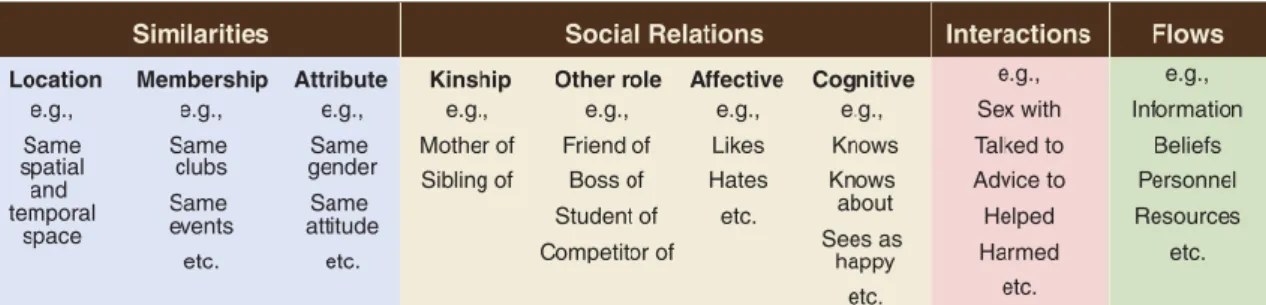
basic types - similarities, social relations, interactions, and flows. Those relations are represented in Table 1. Much of social network research can be seen as working out how these different kinds of ties affect each other. SNA tools make it easy to analyze, visualize and study the relationships between individuals, and then apply this information to strategically identify the key nodes or even improve the flow of information (I.Ehrlich et al., 2005).
Table 1 - Typology of ties studies in SNA, edges can be represented by the above 4 different categories (Borgatti et al., 2009)
2.2.1.
Computational Social Science
SNA combined with the computer technology gave origin to a new paradigm – Computational Social Science (CSS). CSS may be defined as a computational facilitation of social studies and human social dynamics as well the design and use of Information and Communication Technologies (ICT) (Lazer et al., 2009). In other words it is a multi-disciplinary field which combines the usage of computer science techniques with SNA’s methods. Social computing incorporates two main fields: computational and social sciences. Other fields are important as well, such as: human-computer interaction; communication; sociology; psychology; economic and anthropological (Wang, Carley, Zeng, & Mao, 2007). One of the main advantage of this field is that allows to collect and analyze large amounts of data, with relatively few efforts by the researcher, this was once impossible in past times. After the data is collected it is performed a special kind of data mining – “social mining”, with the finality of retrieve and find interesting social patterns. These type of activities may be performed by "sociometers" - possible electronic devices that perform some kind of data analysis with the goal of finding patterns from how a population breaks down into groups, to which groups are most social and productive, to the personality traits of single individuals (Lazer et al., 2009). This novel science requires a distributed monitoring and permission for analyzing the data, which implies some privacy issues i.e. it requires permissions from people to analyze their private data. Since CSS is an interdisciplinary field, it has physical limitations - distance between social science departments and engineering/computer science departments.
18
2.2.2. Applications of Computational Social Science
According to Wang et al. (2007) there are 4 main applications areas of computational social sciences:
Creation of Web 2.0 services and tools to support effective online communication among online social communities, e.g., blogs, wikis, social networks, RSS, collaborative filtering, and bookmarking.
Entertainment software which focus on the development of intelligent entities that can interact with people, e.g., programs, agents, and robots.
Business and public sector, e.g., various e-business, healthcare, economic, political, and digital government systems.
Forecasting systems, which could be various predictive systems for planning, evaluation, and training in areas ranging from counter-terrorism to market analysis to pandemic and disaster response planning.
2.3.
Tie strength
The notion of tie strength was first introduced by Granovetter in 1973, who defined it as: “combination of the amount of time, the emotional intensity, the intimacy (mutual confiding) and reciprocal services which characterize the tie”. Granovetter in his work differentiated two types of ties, strong and weak. Strong ties are the ones that a person really trust and often are the beloved ones, i.e., family, and close friends. On the other hand, weak ties represent acquaintances, and they often provide access to novel information.
2.3.1.
Why Tie Strength is important?
Strong ties have been found to provide social support to individuals therefore increasing their mental health (Schaefer, Coyne, & Lazarus, 1981). It was also been found that they help organizational subunits surviving in time of crisis (D Krackhardt, 1988). Paradoxically those same ties are more likely to create crisis because they push organizations towards change (David Krackhardt, 1992).
Weak ties have been shown to be more helpful than strong ties when trying to get a job (Granovetter, 1973), because the information that flows from weak ties are novel to the individual, therefore contributing to more opportunities to find a new job. For the same reason, weak ties are more efficiently to propagate information in online social networks than strong ties (Zhao et al., 2011, 2010). Also, weak ties have been shown to be useful in conduit information in CMC (Burt, 2004; Petróczi et al., 2006). Duhan et al. (1997) found out that although strong ties were more likely to influence consumer’s decision, weak ties were more likely than strong ties to facilitate word of mouth referral flows. Goldenberg et al. (2001) came to the same conclusion but with a different method: a cellular automata algorithm which estimated the propagation of the information of virtual individuals in a
19
simulated social system. Organizations whose employees are weakly tied tend to receive better performance reviews and produce more creative ideas. Also, weak ties have been shown to be useful in conduit information in CMC (Burt, 2004; Petróczi et al., 2006).
2.3.2. Tie Strength and Social Capital
Social Capital is “the actual or potential resources which are linked to a durable network of more or less institutionalized relationships of mutual acquaintance or recognition” (Bourdieu, 1986). This concept brings many positive social outcomes, for example better public health, lower crime rates or even increased psychological well-being (Adler & Kwon, 2002; Helliwell & Putnam, 2004). Despite some initial beliefs that Internet contributed to losses in social capital (Nie, 2001), many other works (Bargh & McKenna, 2004; Keith Hampton & Wellman, 2003; Kavanaugh, Carroll, Rosson, Zin, & Reese, 2005) proved otherwise, arguing that the Internet contributed to increases in social capital.
Putnam (2000) in his book makes a distinction between bridging and bonding social capital. The relation between social capital and tie strength is perceived when those two types of social capital are introduced. Bridging social capital is related to “weak ties”, i.e. acquaintances or loose connections. On the other hand there is bonding social capital which corresponds to strong ties. Some researchers (Donath & Boyd, 2004; Ellison et al., 2007) argued that the usage of SNSs helps to maintain existing relationships and greatly increase the weak ties one could form and maintain. So, SNSs are a very accessible and cheap way that a person has to increase their bridging social capital. In a more recent study Burke et al. (2011) made a survey to Facebook users which contained standard scales for social capital (bonding and bridging, social communication skill, and self-esteem. The survey responses were after matched with the server logs of the participant’s activity. Burke et al. reinforced the hypothesis that the usage of Facebook was associated with increases in bridging social capital.
2.3.3. How to measure Tie Strength
Many researchers have adopted tie strength as an analytic framework for studying individuals and organizations however, when compared with the number of studies that uses the tie strength notion; there is a lack of empirical studies that actually try to measure it (Mathews, White, & Long, 1998).
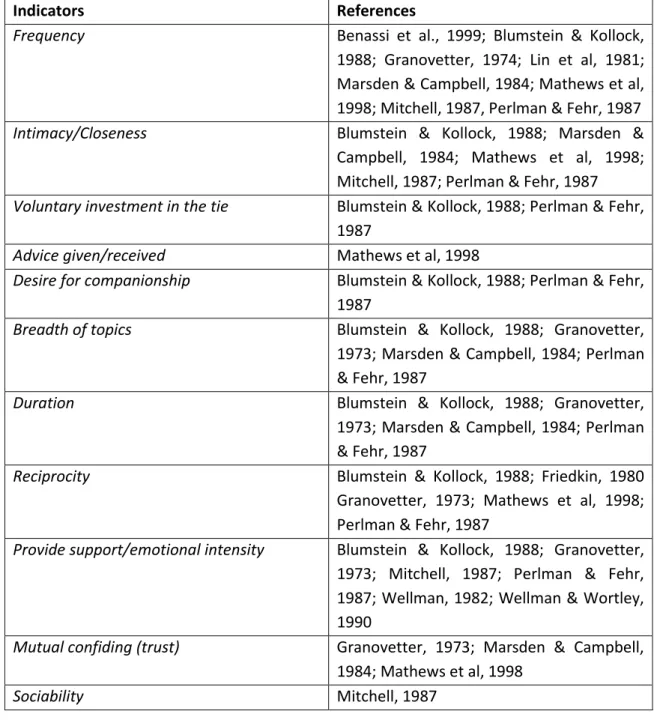
Marsden & Campbell (1984) performed a survey which asked respondents to recall their three closest friends along with ten characteristics of the friendship. This study permitted a clear definition of two types of variables when measuring tie strength: indicators and predictors. Indicators are actual components of tie-strength (closeness, duration and frequency, breadth of topics and mutual confiding), whereas contextual contingencies (neighborhood, affiliation, similar socio-economic status, workplace and occupation prestige) are predictors. Predictors are aspects of relationships that are related to, but not components of tie strength. In the same work, Marsden and Campbell (1984) showed that
20
many indicators are not free of contamination by predictors, except for closeness. In Table 2 Petróczi (2006) summarized a list of indicators of tie strength based on data collected in offline social groups.
Indicators References
Frequency Benassi et al., 1999; Blumstein & Kollock, 1988; Granovetter, 1974; Lin et al, 1981; Marsden & Campbell, 1984; Mathews et al, 1998; Mitchell, 1987, Perlman & Fehr, 1987
Intimacy/Closeness Blumstein & Kollock, 1988; Marsden & Campbell, 1984; Mathews et al, 1998; Mitchell, 1987; Perlman & Fehr, 1987
Voluntary investment in the tie Blumstein & Kollock, 1988; Perlman & Fehr, 1987
Advice given/received Mathews et al, 1998
Desire for companionship Blumstein & Kollock, 1988; Perlman & Fehr, 1987
Breadth of topics Blumstein & Kollock, 1988; Granovetter, 1973; Marsden & Campbell, 1984; Perlman & Fehr, 1987
Duration Blumstein & Kollock, 1988; Granovetter,
1973; Marsden & Campbell, 1984; Perlman & Fehr, 1987
Reciprocity Blumstein & Kollock, 1988; Friedkin, 1980 Granovetter, 1973; Mathews et al, 1998; Perlman & Fehr, 1987
Provide support/emotional intensity Blumstein & Kollock, 1988; Granovetter, 1973; Mitchell, 1987; Perlman & Fehr, 1987; Wellman, 1982; Wellman & Wortley, 1990
Mutual confiding (trust) Granovetter, 1973; Marsden & Campbell, 1984; Mathews et al, 1998
Sociability Mitchell, 1987
Table 2 - List of offline indicators along with their respective references (Petróczi et al., 2006)
2.3.4.
Measuring Tie Strength in social media
The indicators and predictors mentioned above were collected in offline social groups. In the last decade some studies regarding tie strength on virtual communities emerged and they tried to estimate tie strength as also verify if tie strength in online communities have the same characteristics as offline communities. One of the first were Muncer et al. (2000), which simply estimated tie strength by the number of posts between two participants.
21
Paolillo (2001) made a different approach by analyzing the context of the messages and used informal speech as indicator of tie strength (e.g. using “u” instead of “you”). In 2003, L. Adamic obtained a social network by analyzing users’ homepages and mailing lists. Then she introduced a matchmaking algorithm to predict the similarities between users and found out that homepage links and mailing lists are poor predictors of relationships, whilst having mutual friends. Petróczi et al. (2006) conducted a survey in an online forum to analyze tie strength, each question corresponded to an indicator of tie strength, and he found out that indicators in virtual groups are similar to those in offline networks. Also, both Chun et al. (2008) and Petróczi et al. (2006) in their works concluded that reciprocity between individuals usually are indicators of tie strength. More recently Wuchty and Uzzi (2011) used self-reported human relations and email data from a typical company to investigate how email communication patterns map onto self-reported social network data. This reinforced the idea that although the e-communication lowered the cost of communication and barriers to communicate over long distances the fundamental patterns of human interaction did not changed. Still in the same work, it was tested time-resolved information on email responsiveness to determine whether a tie is a social or a professional connection. Despite the lower absolute volume along social ties, it was stated that social closeness is positively associated with response time.
2.3.5. Measuring Tie Strength in SNSs
The vast majority of the studies regarding tie strength in social media were not realized in SNSs. However there are two recent studies (Gilbert & Karahalios, 2009; Kahanda, 2009) that are particular interesting to the current work because they both were performed on Facebook and they use interaction data (wall posts, photos, etc.) to predict tie strength. Kahanda developed a supervised learning approach to predict link strength from transactional information. He extracted the friendship, wall, photo, and group graph, and then constructed 50 features divided in 4 categories: attribute-based features (i.e., gender, relationship status, etc.); topological features; transactional features (i.e., wall postings, picture postings, and groups); and network-transactional features (same as transactional features but considers the context). He then compared his results to the results he got from the top 10 friend application (collected from the same respondents). He found out that transactional events are useful for link prediction, and that the wall and photo graph offers important information to determine tie strength.
Gilbert and Karahalios made a slightly different approach from Kahanda’s work. They developed a script containing a survey with 5 tie strength questions on the user’s Facebook page and at the same time they retrieved the results of the survey they also retrieved interaction data between the respondents. The survey’s answers had the same purpose of the top 10 friend nomination application in Kahanda’s work – proxy for the real tie strength value. Based on past literature Gilbert and Karahalios defined 7 dimensions of tie strength: intensity, intimacy, duration, reciprocal, structural, social distance, and emotional support. With these dimensions as guide they identified 74 Facebook variables
22
as potential predictors of tie strength. Some of these predictive variables are illustrated on table 3. The authors tried to o take advantage of Facebook’s breadth while simultaneously selecting variables that could carry over to other social media. After that, they used a statistical model to determine the strength between two nodes, and compared it with the survey’s results. They found out which dimensions and variables performed better predictions, for example, intimacy dimension makes the greatest contribution when measuring tie strength.
Despite some good insights to predict tie strength the above works require on supervised methods, which usually involves human annotation, e.g., top friend nomination or friendship rating (Xiang et al., 2010).
Dimensions of tie strength Predictive variables in Facebook
Intensity Wall words exchanged
Participant-initiated wall posts Inbox thread depth
Friend’s photo comments
Intimacy Days since last communication
Wall intimacy words Inbox intimacy words
Appearances together in photo
Duration Days since first communication
Reciprocity Links exchanged by wall post
Applications in common
Structural Number of mutual friends
Groups in common
Emotional Support Wall and inbox positive emotion words Wall and inbox negative emotion words
Social Distance Age difference (days)
Educational difference (degrees) Political difference (scale)
Table 3 - Gilbert and Karahalios defined 7 dimensions of tie strength based on past literature (left column). On the right column are defined some of the 74 Facebook predictive variables predictors
of tie strength.
2.3.6. Practical implementation of a tie strength model
On gilbert’s PhD thesis (Gilbert, 2010) he also presents a practical implementation of the tie strength model described above, on Twitter (OSN which allows a microblogging service that enables its users to send and read text-based messages of up to 140 characters, known as “tweets"). In order to understand the capabilities and limitations of the tie strength model Gilbert developed a Twitter application, We Meddle, using the own Twitter API. With such application it was possible to understand how a computational tie strength
23
model generalizes to another SNS. Also it was able to see if the model can attack the collapsed context problem, i.e. instead of relying on time as the central design axis it would put relationships as the center of social design.
It was necessary to adapt all the tie strength Facebook predictive variables to Twitter’s predictive variables. Most variables were drawn directly from the Facebook experiment, with the exception of a few, for instance difference in education variable, which is absent on Twitter. The nonexistence of this variable would complete exclude the Social Distance dimension from the model. To avoid this, it was added a new variable: “fame differential” – log of the difference in follower counts.
We Meddle is a web application that creates lists for the Twitter’s user. These lists cover strong ties, weak ties and 6 more communities’ lists (e.g. university, golf club, etc.). This research focus in the strong and weak ties lists. The other six lists are purely for functionalities purposes. The user has the choice to correct the lists if he feels that their lists are not fully customized
In general We Meddle experiment was successful where only 1,105 out of 14,075 potential ties were subjected to corrections by the user. Corrections in this context, is seen as changing a person of list to other list, for example: from the circle of strong ties to the circle of weak ties. The ratio it is quite good, however it must be accounted that the We Meddle usage were not supervised in the lab, so participants that did not made any corrections could not perceive that it was possible to correct lists or did not feel that it was not worth the effort to make the extra clicks.
2.4.
Data Extraction
This last section covers some aspects of the collecting data process. This topic is separated from SNA however it is important to have some notions of data extraction concepts for a better and full understanding of a SNA study, as also having the foundations in how to generate a GraphML file. Those files are important to study social network characteristics and might offer some insights when studying tie strength.
Gjoka et al. (2010) distinguished two categories of crawling techniques: graph traversal techniques and random walks. In graph traversal techniques each node is visited one time, if the process is run until completion. These methods vary in the order in which they visit the nodes, the most known is the Breadth-Search-First (BFS) which are used in the work of (Mislove, Marcon, Gummadi, Druschel, & Bhattacharjee, 2007; Ye, Lang, & Wu, 2010). Random walks are different because they allow node re-visiting. Gjoka itself have sampled and analyzed the Facebook friendship graph with different visiting algorithms (BFS, RandomWalk and Metropolis-Hastings RandomWalks).
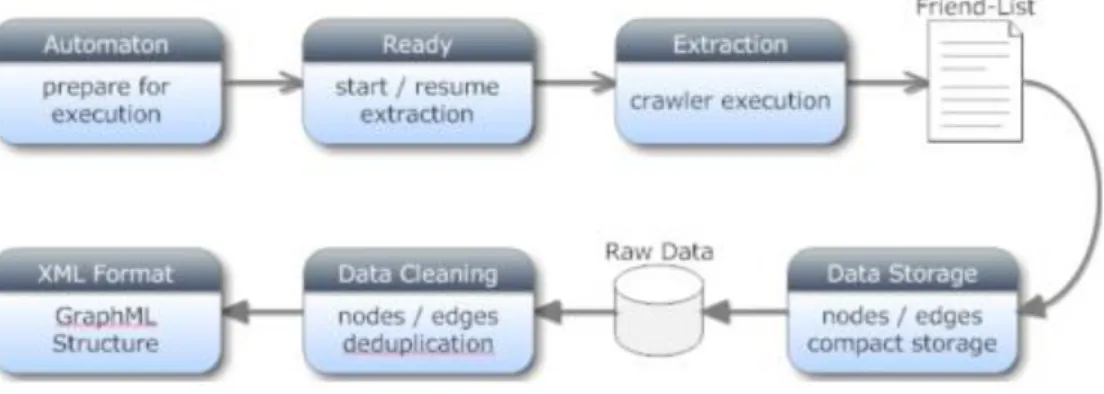
Independently of the methodology used, the process of data collection can be performed as it follows (Catanese, De Meo, Ferrara, Fiumara, & Provetti, 2011):
24
1. Preparation for the execution of the agent. 2. Starting the process of data extraction.
3. The crawler execution extracts the friend lists, cyclically. 4. Raw data are collected until the extraction process is over. 5. Data cleaning and de-duplication of information.
6. Data structured in appropriate format (e.g. GraphML).
25
3.
METHODS
3.1.
Study Design
Tie strength survey is an online survey in a form of a facebook application. Only Facebook users can perform the survey. The facebook application developed allowed participants to rate as much friendships they wanted to. The goal of the survey is to make participants answer several questions and at the same time capturing their interaction history about their friendships. By doing this I gathered a comprehensive dataset and I could perform a multiple regression analysis for better understanding which online social network’s factors contributes to a friendship.
3.2.
Theoretical Approach
The main research question addressed on this thesis is: it is possible to model tie strength on Social Network Sites, in this particular case, Facebook by using its own API? Much of the literature analysis implies that tie strength can be indeed modeled on online environments as is on offline communities. The work of Gilbert and Karahalios, 2009 approaches this subject eloquently by capturing a huge number of facebook predictive variables, using for this end a script on the user’s browser. With the data gathered, Gilbert and Karahalios performed a multiple regression analysis producing an accomplished equation, which could predict tie strength with great accuracy.
This study, in the likeness of Gilbert and Karahalios work, has the goal to produce an equation capable to predict tie strength between two particular users by adopting a multiple regression equation by using the Facebook API. This method also permits determining the weight of the different variables when estimating tie strength.
The main difference and emphasis are situated in the technical implementation as well a different approach. In the previous research (Gilbert & Karahalios, 2009) of tie strength it was a used a Firefox extension named Greasemonkey which allows JavaScript scripts inject on the Firefox browser making changes in the webpage that it is displayed to the user. Another approach can be used, for example the Facebook’s download your data feature (Panovich, Miller, & Karger, 2012). This last method lacks the ability to interact directly to the user, a step necessary to make the survey and collect the answers on the fly.
In this study it was used the Facebook API capabilities to perform the work. By using the Facebook API it was possible to develop a survey in form of a Facebook application and at the same time capture the data. This methodology did not require the presence of the participants in the lab as did past work.
At the same time the application collected the data necessary for the purpose described above and it also tested a tie strength algorithm on the fly. This tie strength algorithm is
26
based on the beta coefficients of the predictive variables obtained Gilbert and Karahalios’ work. A similar algorithm based in those beta coefficients were used by Panovich, Miller and Karger, 2012.
3.2.1. Pilots Test
Two pilots were addressed to test the tie strength algorithm based on the beta coefficients got by Gilbert and Karahalios in 2009. The secondary goal of the pilots was to detect any technical bugs related with the application itself in order to solve it in time to the main study. The survey presented in the pilots had the following five tie strength questions:
How strong is your relationship with this person?
How would you feel asking this friend to loan you $100 or more?
How helpful will this person be if you were looking for a job?
How upset will you be if this person unfriended you?
If you left Facebook for another social site, how important will it be to bring this person with you?
Both pilots were performed on 10 participants and it was asked to each one to rate no less and no more than 20 friendships, performing a total of 200 friendships for each pilot. The first pilot served essentially to detect and solve technical errors. Errors were found in the storing process consequently compromising some of the data collected. So, the first pilot served essentially to correct some bugs as also some changes in the application design. The second pilot conducted was free from errors and it was aimed to make a validation of Gilbert and Karahalios partial algorithm by making a correlation between the respondent’s answers and the tie strength algorithm scores.
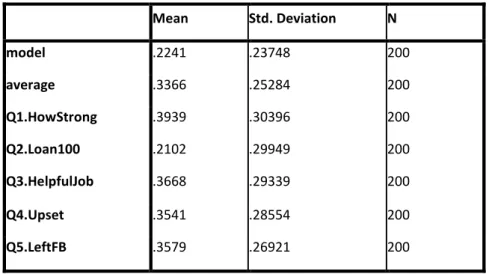
Mean Std. Deviation N model .2241 .23748 200 average .3366 .25284 200 Q1.HowStrong .3939 .30396 200 Q2.Loan100 .2102 .29949 200 Q3.HelpfulJob .3668 .29339 200 Q4.Upset .3541 .28554 200 Q5.LeftFB .3579 .26921 200
Table 4 - Descriptive statistics for the tie strength model, the five questions and the mean of the five tie strength questions
27
The real tie strength score is indicated by the participant’s answers. It was assigned by the five questions’ mean as also by each question individually.
Chart 1 - Distribution of the mean of the five tie strength questions
In Chart 1 it is represented the mean of all the tie strength questions. As expected, low tie strength values are more frequent than high ones.
Chart 2 - Distribution of the tie strength algorithm for the corresponding 200 friendships rated
Most of the scores attributed were between 0 and 0.1, mostly due the fact that a lot of people do not interact at all (acquaintances) on Facebook.
48 26 26 15 36 19 12 6 9 3 0 10 20 30 40 50 60 0,1 0,2 0,3 0,4 0,5 0,6 0,7 0,8 0,9 1
Mean of the answers
Fr
equ
enc
y
95 16 29 18 15 15 4 1 2 5 0 10 20 30 40 50 60 70 80 90 100 0,1 0,2 0,3 0,4 0,5 0,6 0,7 0,8 0,9 1Tie Strength scores
Fr
e
quenc
28
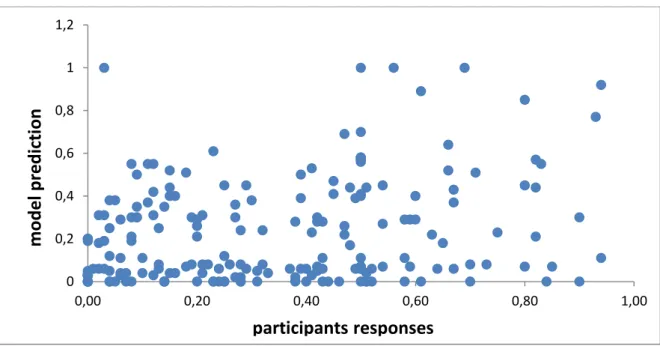
Chart 3 - Scatter plot for the respondent's answers and tie strength values
model average Q1.HowStrong Q2.Loan100 Q3.HelpfulJob Q4.Upset Q5.LeftFB
model Pearson Correlation 1 .273** .270** .269** .148* .261** .241**
Sig. (2-tailed) .000 .000 .000 .037 .000 .001
average Pearson Correlation .273** 1 .931** .826** .763** .934** .899**
Sig. (2-tailed) .000 .000 .000 .000 .000 .000
Q1.HowStrong Pearson Correlation .270** .931** 1 .761** .645** .854** .786**
Sig. (2-tailed) .000 .000 .000 .000 .000 .000
Q2.Loan100 Pearson Correlation .269** .826** .761** 1 .413** .778** .630**
Sig. (2-tailed) .000 .000 .000 .000 .000 .000
Q3.HelpfulJob Pearson Correlation .148* .763** .645** .413** 1 .594** .672**
Sig. (2-tailed) .037 .000 .000 .000 .000 .000
Q4.Upset Pearson Correlation .261** .934** .854** .778** .594** 1 .844**
Sig. (2-tailed) .000 .000 .000 .000 .000 .000
Q5.LeftFB Pearson Correlation .241** .899** .786** .630** .672** .844** 1
Sig. (2-tailed) .001 .000 .000 .000 .000 .000
Table 5 - Correlation between the model and the five participant’s answers, including their mean
The scatter plot shows a positive correlation yet low between the model’s prediction and the survey’s answers. In Table 5 is possible to see that the highest correlation occurs when using the mean of the 5 questions. However the difference is not significant when compared with others questions individually. With the exception of the question: “How helpful will this person be if you were looking for a job?” which presents a very low correlation. This low correlation is expected, since past literature supports that weak ties
0 0,2 0,4 0,6 0,8 1 1,2 0,00 0,20 0,40 0,60 0,80 1,00
participants responses
model
pr
e
di
ct
ion
29
are better in finding a new job, so getting a job is almost unrelated to how strong a relationship is between two persons, but more an indicator of the helpfulness of the friend when searching for a job.
These results supported the decision to keep just the first question – “How strong is your relationship with this person?” in a future survey as single indicator of the real tie strength value. Excluding all the remaining 4 questions from the survey due its redundancy and replacing it with other questions. Most important, these results motivated a quest for a better tie strength model because Gilbert and Karahalios made available only a small set of beta coefficients and these same coefficients were associated to predictive variables whose extraction was very difficult to get or because of some technical limitations of the Facebook API.
3.3.
Participants
This survey gathered responses of 85 participants performing a total of 1642 friendships rated. Not all participants rated friendships equally, i.e. not all participants answered the questions for 20 friends, some respondents rated more than others. This was an expected situation because these participants were not lab controlled. This means that most participants did the survey where and when they wanted to do. In Chart 4 we can see the distribution of participants that rated 20, less than 20, and more than 20 friendships.
Chart 4 - Friends rating distribution
Most participants rated 20 friendships because of the way the survey was designed. Some did more than 20 because they wanted to contribute more or wanted to unlock more funny messages (funny messages appeared in the end of the 20 first friends and then for each 10 increment). Some did less probably due to a lack of interest in completing it. A great part of the participants were recruited through Facebook itself. Others participants were got through submitting the survey to research websites. Of these 85 participants,
23 46 16 0 5 10 15 20 25 30 35 40 45 50 Under 20 20 Above 20 Friends Rated Fr e q u e n cy
30
40% were females. The mean age was 27 years old, with a median of 26, ranging between 12 to 60 years old. The participants ages falls slightly low from the mean of 38 years obtained in 2010 by KN Hampton and Goulet, 2011.
Chart 5 - Participant's age and gender distribution
The mean number of friends of this dataset is 360.1 friends, with a median of 324 ranging between 28 to 872 friends. These statistics slightly exceeds the mean of 190 and 229 friends acquired by KN Hampton and Goulet, 2011; Ugander, Karrer, Backstrom, and Marlow, 2011 respectively. In terms of number of friends, the results obtained could have been larger since there was a restriction of a minimum of 20 and a maximum of 1000 friends in order to participate in the survey. The survey’s design itself implies a minimum of 20 friends. The 1000 friends limit was imposed by two reasons: technical limitations – for users with a very large number of friends (more than 1000) the Facebook API would cut off connection, probably due very high traffic of data; and for design issues – with an increase of the number of friends comes a low probability of capturing relevant friendships since the study’s design suggests that participants would only rate 20 friends randomly selected from their entire list of friends.
6 15 24 5 1 4 8 15 6 1 0 5 10 15 20 25 30 35 40 45 Under 18 18-24 25-34 35-44 Above 45 female male Age Categories Fr e q u e n cy
31
Chart 6 - Participants' nationalities
Most participants were Portuguese (77), others eight participants were from different nationalities (Chart 6). The lack of non-Portuguese participants is explained due the fact that the survey was made available on online websites very late and to worse things both websites posted the study after several days have been passed. The survey was available in English and Portuguese.
It was asked the participants to enter data about their facebook usage by asking how many hours they spent on Facebook on average per week. The results find a mean of 13.9 hours a week and a median of nine hours. According to Burbary, 2011 the typical Facebook user spent on average 15 hours per month on Facebook, so we can assume the participants used Facebook on a daily basis.
3.4.
Measures
3.4.1. Gilbert and Karahalios model’s predictive variables
The tie strength algorithm (Gilbert and Karahalios’ version) used is calculated according to seven facebook variables. These variables are drawn directly from Gilbert’s paper. It is taken the beta coefficients for each variable previously calculated using a multiple regression method.
Some of the variables could be easily implemented, i.e. without any extensive data computation. For example, the participant’s friends initiated wall posts variable can be easily extracted from the JSON object by making a simple cycle to get all posts made by one particular friend ID and so on. On the other hand, some other variables took more complex steps in order to be collected. The general procedure to implement each variable is described on Table 6. 77 1 1 1 1 1 1 1 1 portuguese british irish indian north american south african spanish canadian swiss
32
Table 6 - Predictive variables and how they were retrieved
The educational difference variable was not available for some participants because they did not enter this type of information on Facebook. LIWC (Linguistic Inquiry and Word Count) was used by both Gilbert and Karahalios, 2009 and Panovich et al., 2012 to compute the inbox positive emotion words and also the wall intimacy words. For this thesis the use of LIWC software was not possible because it is not an online service, so buying it would not help with a live Facebook application. The alternative was to
Predictive Variables Procedure
Days since last communication This variable was got by comparing all interactions between two particular users in order to find the most recent interaction.
Days since first communication Ideally would be the date that two users became friends. Since this information is only partially available on facebook, it is attributed the most recent interaction between two users using a similar process like described above.
Wall words exchanged Counting the number of words exchanged in the wall of the participant, as well the words that the participant did in the friends’ wall.
Educational difference This variable was get by analyzing the friends’ educational history, a function to identify keywords that would correspond to the degree of education, next the difference was calculated.
Participant-initiated wall posts It is simply the number of wall posts made by one particular friend on the participant’s wall.
Inbox positive emotion words Number of inbox messages words that counts as positive words. These words are compared with words of a small dictionary – short dictionary based in Bradley and Lang, 1999 .
Wall intimacy words Number of wall words that are considered intimacy words. These words are compared with words of a small dictionary– short dictionary based in Nielsen, 2011.
33
summarize a set of positive emotion words and intimacy words from the papers Bradley and Lang, 1999 and Nielsen, 2011, respectively.
One must be aware of the limitations of adapting Gilbert’s model; on his paper and thesis he only made available the top 15 predictive variables with the highest beta coefficients. In his experiment it were used a total of 67 individual predictive variables; some pairwise interactions variables between the seven dimensions; and some network structure variables. All these variables were not considered in the model for two simple reasons: only 15 variables had their beta coefficients published; most of these variables, especially the pairwise interactions and the network structure variables are very difficult to get and even not possible to collect using the Facebook API.
The existent literature suggests seven tie strength dimensions; five of these seven dimensions are represented on Table 6, which are: intensity (wall words exchanged and participants initiated posts); intimacy (wall intimacy words and days since last communication); duration (days since first communication); emotional (inbox positive words); and social distance (educational difference). The structural and reciprocal dimensions were not included in the algorithm.
3.4.2. Predictive variables for the new model
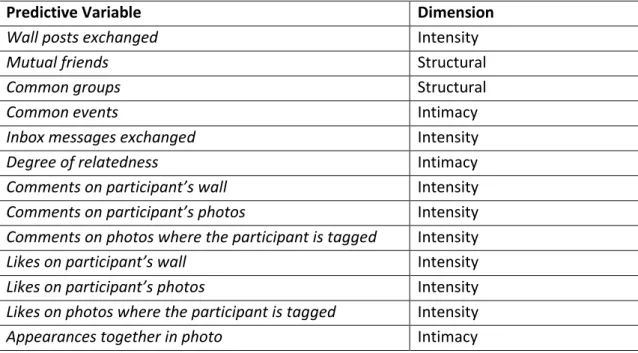
For the new model it was collected 13 different predictive variables from 3 different dimensions: intimacy, intensity and structural. These variables were not necessarily selected from a huge set of variables, but from the existent data available through the Facebook API.
Predictive Variable Dimension
Wall posts exchanged Intensity
Mutual friends Structural
Common groups Structural
Common events Intimacy
Inbox messages exchanged Intensity
Degree of relatedness Intimacy
Comments on participant’s wall Intensity
Comments on participant’s photos Intensity
Comments on photos where the participant is tagged Intensity
Likes on participant’s wall Intensity
Likes on participant’s photos Intensity
Likes on photos where the participant is tagged Intensity
Appearances together in photo Intimacy
34
The predictive variables chosen for the new model do not match the variables used in Gilbert’s model; meaning that the variables used in the new model. Table 7 lists these variables as well their correspondent dimension.
From this set of variables it is important to make some observations. The common events variable considers only the events that the participant is taking part i.e. the participant is “attending”; the following statuses are discarded: “unsure”, “declined”, and “not replied”. The inbox messages exchanged variable is the only variable that can be annulled by the participant. This variable as the name implies needs the inbox messages permission, and for obvious reasons some participants did not want to concede it.
As shown on Table 8, degree of relatedness is divided in four different levels. For each level is attributed a number. For example, for the level one is attributed the number one, level two the number two, and so on. The higher levels correspond to a higher degree of relatedness. Zero is the lowest level, which indicates a non-existing familiar relationship between the participant and the friend.
Level Degree of relatedness
Zero Not defined
One cousin; niece; aunt; uncle; stepson;
stepdaughter; stepsister; stepbrother; stepmother; stepfather; sister-in-law; brother-in-law; mother-in-law; daughter-in-law; son-in-daughter-in-law; father-in-daughter-in-law;
Two brother; sister; grandmother;
granddaughter; grandfather; grandson;
Three mother; father; wife; husband;
Table 8 - Levels and correspondent degree of relatedness
3.5.
Materials
3.5.1. The Survey
As soon the user read the description of the study in the first page (Figure 3), and presses the start survey button the application presents a loading page with a please wait message. After that, the application starts collecting data and at the same time executes the Gilbert’s partial algorithm for all the participant’s facebook friends. After finishing these two steps, the user must enter some demographic data (age, nationality, gender and average time spent on Facebook per week). Next the user is presented with the survey itself, in which one of their friends is randomly selected, for each friend it is displayed their basic information, eight questions and the next button. The eight questions are in the form of horizontal sliders and the handle must be moved to the desired value. When the next button is submitted the data is saved to a database and the next friend appears. This process is repeated for 20 randomly selected friends. When the user finishes rating these