Performance Analysis with High-Level Languages for
High-Performance Reconfigurable Computing
John Curreri, Seth Koehler, Brian Holland, and Alan D. George
NSF Center for High-Performance Reconfigurable Computing (CHREC)
ECE Department, University of Florida
{curreri, koehler, holland, george}@chrec.org
Abstract
High-Level Languages (HLLs) for FPGAs (Field-Programmable Gate Arrays) facilitate the use of reconfigurable computing resources for application developers by using familiar, higher-level syntax, semantics, and abstractions, typically enabling faster development times than with traditional Hardware Description Languages (HDLs). However, this abstraction is typically accompanied by some loss of performance as well as reduced transparency of application behavior, making it difficult to understand and improve application performance. While runtime tools for performance analysis are often featured in development with traditional HLLs for serial and parallel programming, HLL-based applications for FPGAs have an equal or greater need yet lack these tools. This paper presents a novel and portable framework for runtime performance analysis of HLL applications for FPGAs, including a prototype tool for performance analysis with Impulse C, a commercial HLL for FPGAs. As a case study, this tool is used to locate performance bottlenecks in a molecular dynamics application.
Keywords: Performance analysis, profile, trace, reconfigurable computing, FPGA, high-level language, application mapper, Impulse C, Carte
1. Introduction
Today’s application mappers (i.e. compilers that translate High-Level Languages (HLLs) to hardware configurations on FPGAs, such as Impulse C [1] or Carte [2]) simplify software developers’ transition to reconfigurable computing and its performance advantages without the steep learning curve associated with traditional Hardware Description Languages (HDLs). While HDL developers have become accustomed to debugging their code via simulators,
software developers typically rely heavily upon debugging and performance analysis tools. In order to accommodate the typical software development process, application mappers support debug of HLL source code on a traditional microprocessor rather than relying upon HDL simulators and logic analyzers. However, current commercial application mappers provide few (if any) runtime tools to debug or analyze application performance at the HLL source-code level while executing on one or more FPGAs. While methods and tools for debugging FPGAs have been well researched and even developed, such as for the Sea Cucumber HLL which has tool support for runtime debugging [3], research is currently lacking in runtime performance analysis tools for FPGAs, especially when HLLs are featured.
Without performance tools to assist in analyzing application behavior on the FPGA, potential performance gains of reconfigurable computing may be lost. A major advantage of reconfigurable computing is performance increase obtained from application-specific hardware optimizations. Application mappers attempt to create optimized hardware by extracting parallelism out of amenable HLL statements (e.g. performing the iterations of a loop in parallel or in a pipeline if possible). However, the amount of parallelism extracted, and the overall structure of the design in hardware, can depend heavily upon the way in which the algorithm is expressed as well as the techniques used by the application mapper to translate source code to hardware.
Runtime performance analysis (hereafter the “runtime” is assumed) allows the application developer to better understand application behavior in terms of both computation and communication, aiding the developer in locating and removing performance bottlenecks in each. Complex or dynamic data dependencies during computation, shared communication channels, and load balancing among parallelized components can be very difficult to predict
and yet significantly affect performance. Performance analysis tools for HLL codes must allow the developer to monitor these types of areas while presenting analysis from the perspective of the HLL source code.
Unfortunately, many well-researched debugging techniques may not be suited for runtime performance analysis. For example, halting an FPGA to read back its state may not be viable due to the unacceptable level of disturbance caused to the application’s behavior and timing since the FPGA will be temporarily inaccessible to the CPU, causing performance problems that did not exist before.
Alternatively, performance can be analyzed through simulation. However, cycle-accurate simulations of complex designs on an FPGA are slow and increase in complexity as additional system components are added to the simulation. Most (if not all) cycle-accurate simulators for FPGAs focus upon signal analysis and do not present the results at the HLL source-code level for a software developer.
This paper focuses upon performance analysis of an HLL application on a reconfigurable system by monitoring the application at runtime. We have gained the majority of our insight about performance analysis with application mappers from a prototype performance analysis tool that we have developed in this research for Impulse C. Impulse C, a product of Impulse Accelerated Technologies, maps a reduced set of C statements to HDL for use on a variety of platforms. In addition, examination here of Carte, a product of SRC Computers, provides an alternate example of how C code can be mapped to an FPGA along with initial ramifications found for a performance analysis tool supporting Carte.
The remainder of this paper is organized as follows. Section 2 discusses related work while Section 3 provides background information in runtime performance analysis. Next, Section 4 covers the challenges of performance analysis for HLLs targeting FPGAs. Section 5 then presents a case study using a molecular dynamics application written in Impulse C. Finally, Section 6 concludes and presents ideas for future work.
2. Related Work
To the best of our knowledge from a comprehensive literature search, little previous work exists concerning performance analysis for FPGAs. Hardware performance measurement modules have been integrated into FPGAs before; however, they were designed specifically for monitoring the execution of soft-core processors [4]. The Owl framework, which provides performance analysis of system interconnects, uses FPGAs for performance analysis, but does not actually
monitor the performance of hardware inside the FPGA itself [5]. This paper significantly extends our previous work on performance analysis for HDL applications [6], which discusses a framework for monitoring performance inside the FPGA called the Hardware Measurement Module (HMM), by expanding this framework to support the challenges of HLL mappers.
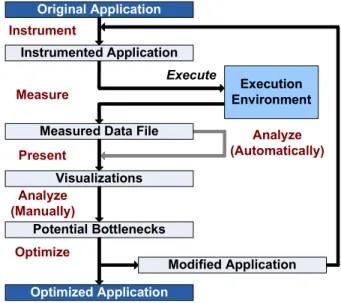
Figure 1. Performance Analysis Steps
3. Background
Performance analysis can be divided into six steps (derived from Maloney’s work on the TAU performance analysis framework for traditional processors [7]) whose end goal is to produce an optimized application. These steps are Instrument, Measure, Execute, Analyze,
Present, and Optimize (see Figure 1). The instrumentation step inserts the necessary code (i.e. for additional hardware in the FPGA’s case) to access and record application data at runtime, such as variables or signals to capture performance indicators. Measurement is the process of recording and storing the performance data at runtime while the application is executing. After execution, analysis of performance data to identify potential bottlenecks can be performed in one of two ways. Some tools can automatically analyze the measured data, while other tools rely solely upon the developer to analyze the results. In either case, data is typically presented to the user via text, charts, or other visualizations to allow for further analysis. Finally, optimization is performed by modifying the application’s code based upon insights gained via the previous steps. Since automated optimization is an open area of research, optimization at present is typically a manual process. Finally, these steps may be repeated as
Original Application Instrument Execute Measure Analyze (Automatically) Present Optimize
Measured Data File
Execution Environment Visualizations Instrumented Application Potential Bottlenecks Analyze (Manually) Modified Application Optimized Application
many times as the developer deems necessary, resulting in an optimized application. This methodology is employed by a number of existing tools for parallel performance analysis including TAU [7], PPW [8] KOJAK [9] and HPCToolkit [10].
4. HLL Performance Analysis Challenges
While all stages of performance analysis mentioned above are of interest for application mappers, we limit our discussion to the challenges of instrumentation, measurement, and analysis for the remainder of this paper. The challenges associated with presenting optimal visualizations for application mappers will be saved for future work. Thus, Section 4.1 covers the challenges of instrumenting an application, Section 4.2 explains the challenges associated with measuring performance data from an application, and Section 4.3 discusses the challenges of analyzing that performance data.
4.1. HLL Instrumentation Challenges
Instrumentation enables access to application data at runtime. For application mappers, this step raises two key issues: at what level of abstraction should modifications be made, and how to best select what should be accessed to gain a clear yet unobtrusive view of the application’s performance. Tradeoffs concerning the level of abstraction are discussed in Section 4.1.1, while the selection of what to monitor is covered in Section 4.1.2.
4.1.1. Instrumentation Levels. Instrumentation can be added to an application at several levels ranging from HLL source code down to FPGA bitstreams. Each instrumentation level offers advantages to a performance analysis tool for HLL-based applications.
The most obvious choice for instrumentation is to directly modify the HLL source code. The main advantage of this method is simplicity; code is added to record data at runtime, and this data can be easily correlated with the source line that was modified. Unfortunately, application mappers typically lack generic hardware timing functions, severely limiting the accuracy of any performance data obtained as the CPU clock must now be used to measure events on the FPGA across the interconnect. Carte is an exception in that it allows the developer to manually control and retrieve cycle counters, which, along with the FPGA’s clock frequency and some adjustment for skew, provides accurate timing information between the CPU and FPGA.
Instrumentation can also be inserted after the application has been mapped from HLL to HDL. Instrumentation of VHDL or Verilog provides the most flexibility since measurement hardware can be fully customized to the application’s needs, rather than depending upon built-in HLL timing functions. However, using instrumentation below the HLL source level does require additional effort to map information gathered at the HDL level back to the source level. This process is problematic due to the diversity of mapping schemes and translation techniques employed by various application mappers and even among different versions of the same mapper. For example, if a performance tool relies upon HLL variables and HDL signals being textually related, then the performance tool would fail if this naming scheme was modified in a subsequent release of the application mapper.
Instrumentation can also be added at the bitstream level after place and route, as discussed at length in Graham et al. [11]. Instrumentation at the bitstream level can be inserted, manipulated, and reinserted in seconds to minutes. In contrast, HLL and HDL instrumentation requires a new place and route of the application which can take hours to days. Beyond the obvious time savings, bitstream-level instrumentation permits the application developer to include minimal performance hardware, knowing that it can be modified in minutes if necessary. However, the instrumentation must now be aware of the target FPGA type. In addition, some flexibility is lost as the design is mostly fixed after place and route, making some signals inefficient to access or inaccessible due to the current routing plan.
Other intermediate levels exist between the HLL source level and the bitstream level. Some HLL mappers have intermediate levels during translation between the HLL and HDL levels. Still more intermediate levels exist between the various stages used to generate bitstreams for Altera and Xilinx FPGAs. However, as [11] concludes, these levels suffer from insufficient documentation or inadequate tool support for modifying the design at that level, and thus are beyond the scope of this paper.
We choose to insert instrumentation at the HDL level for its flexibility, since it is not limited by available HLL functions. HDL is also portable across FPGAs, making our prototype performance analysis tool useful on a broader range of platforms.
4.1.2. Instrumentation Selection. Application performance can generally be considered in terms of communication and computation. Many application mappers, such as Impulse C and Carte, provide built-in functions for communication. Communication functions normally have associated status signals at the HDL level
that can be instrumented to determine usage statistics such as transfer rate or idle time. Instrumenting computation is more complex due to the various ways that computation can be mapped to hardware. Impulse C maps computation onto (possibly multi-level) state machines, and thus monitoring these state machines is crucial to understanding computational performance. As an example, the CO PIPELINE pragma is used in Impulse C to pipeline computation within a loop. When this function is invoked, Impulse C generates a state machine to control the pipeline that can be in one of four states: idle, initialize, run, or flush. Initialize and flush
states indicate pipelining overhead and thus can provide indicators of lost performance. For Carte, computation is represented as a dataflow graph connecting hardware units. Thus, monitoring the status signals of these units, such as completion signals, can provide insight into how computation progresses in the application.
In general, the HDL structure and hardware statements generated by an application mapper will need to be analyzed in order to find state machines, status signals, or other information that can be instrumented to provide relevant performance data. By finding the specific performance indicators for HDL code generated by an application mapper, automated instrumentation is feasible. It may also be beneficial to monitor application data directly (i.e., an HLL variable) to gain a better understanding of application performance and behavior. However, selection of an application variable is, in general, not automatable due to the need for high-level, application-specific knowledge to understand the variable’s purpose and expected value.
4.2. HLL Measurement Challenges
After instrumentation has been inserted into the developer’s application, monitored values must be recorded (measured) and sent back to the host processor. Section 4.2.1 presents standard techniques for measuring application data, Section 4.2.2 then describes the hardware used to make these measurements, and finally Section 4.2.3 addresses how the measurement hardware communicates performance data to software.
4.2.1. Measurement Techniques. The two common modes for measuring performance data are profiling and tracing. Profiling records the number of times that an event has occurred, often using simple counters. To conserve the logic resources of an FPGA, it is possible to store a larger number of counters in block RAM if it can be guaranteed that only one counter within a block RAM will be updated each cycle (e.g., this technique is useful for large state machines, since they can only be in one state at any given clock cycle). Profiling data can be
collected either when the program is finished (post-mortem) or sampled (collected periodically) during execution. At the cost of communication overhead, sampling can provide snapshots of profile data at various stages of execution that would otherwise be lost by a post-mortem retrieval of performance data.
In contrast, tracing records timestamps indicating when individual events occurred and, optionally, any data associated with each event. Due to the potential for generating large amounts of data, trace records typically require a buffer for temporary storage until they can be offloaded to a larger memory, such as the host processor’s main memory. To complicate matters, an HLL communication function may have built-in buffering as well. Assuming no built-in buffering exists, block RAMs can be used to temporarily store trace data on-chip. While logic resources on the FPGA can also be used for trace data storage, this resource is scarce and of lower density than block RAM, making logic resources ill-suited for general trace data. If available, other memory resources such as larger, preferably on-board SRAM or DRAM can be used to store trace data as well before it is sent to the host processor. Tracing does provide a more complete picture of application behavior, capturing the sequence and timing of events. Thus, when needed, tracing can be justified despite the often high memory and communication overhead.
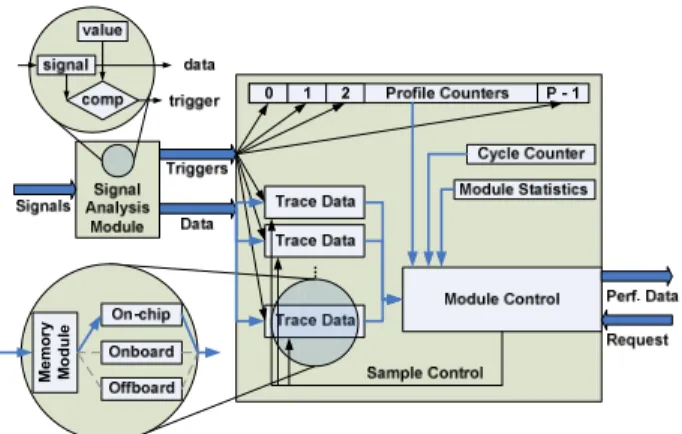
4.2.2. Measurement Hardware. Due to the limitations of hardware timing functions in many application mappers, as discussed in Section 4.1.1, customized hardware with profiling and tracing capabilities is critical in obtaining accurate performance data. For this reason, we extend the Hardware Measurement Module (see Figure 2), or HMM, presented in [6].
... M e m o ry M o d u le
Figure 2. Hardware Measurement Module
The HMM allows HDL signals to be used in arbitrary expressions that define events such as “buffer is full” or “component is idle.” These events are used to
trigger custom profile counters or trace buffers depending upon the type and level of detail of performance data required. A cycle counter is also provided for synchronization and timing information. The module control provides the interface to software for transferring data back to the host processor at runtime as well as clearing or stopping the module during execution.
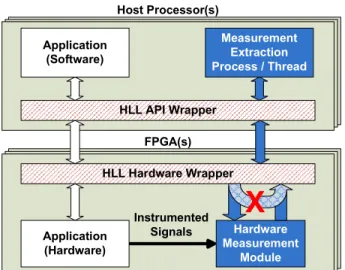
4.2.3. Measurement Data Transfer. In order to transfer measurement data from the FPGA to the host processor, a communication interface must be connected to the HMM. Fortunately, many HLL mappers have built-in communication functions, making the addition of a logical communication channel trivial. However, the process of connecting this communication interface to the HMM is not as straightforward, since the HMM is written in VHDL. To address this problem, a temporary loopback communication channel and hardware are inserted into the HLL source code of the application (dark arrows in Figure 3). Once the application is mapped to an HDL, the loopback HDL code is removed (cross-hatched arrow in Figure 3) and replaced by the HMM. Instrumentation now progresses as it would for an HDL application; application signals are brought out and connected to the HMM for measurement (thin black arrow in Figure 3), completing the process. This technique has been used with our case study in Impulse C, and has also shown promise for Carte.
Application (Software) Measurement Extraction Process / Thread Hardware Measurement Module Host Processor(s) FPGA(s) Instrumented Signals HLL Hardware Wrapper HLL API Wrapper Application (Hardware)
X
Figure 3. HLL communication loopback is added. The function’s HDL is replaced by the HMM, which monitors the application’s signals.
Communication overhead can depend upon several factors. One major factor concerns how much data is generated. Profile counters and trace buffers should be sized according to the number of events expected (with some margin of safety). Events should also be defined
frugally to minimize the amount of data recorded while still obtaining the information needed to analyze performance. For example, while it may be ideal to monitor the exact time and number of cycles for all writes, it may be sufficient to know the number of writes exceeding a certain number of cycles.
Another source of overhead comes from the application mapper’s communication interface, as the HMM is designed to work best with high-throughput channels. The bandwidth of streaming and memory-mapped communication interfaces can vary significantly between application mappers as well as between FPGA platforms using the same application mapper, depending upon implementation. Therefore, it is important for performance analysis tools to support as many communication interfaces as possible to provide flexibility and achieve the lowest overhead.
4.3. HLL Analysis Challenges
While analysis has historically been very difficult to automate, automatic analysis can improve developer productivity by quickly locating performance bottlenecks. Automatic analysis typically focuses upon recognizing common performance problems such as potentially slow communication functions or idle hardware. For example, replicated functions can be monitored to determine which are idle and for what length of time, giving pertinent load-balancing information to the developer. Application mappers can also pipeline sections of code, either automatically (e.g. Carte) or explicitly via directed pragmas (e.g. Impulse C). In this case, automatic analysis determines how many cycles in the pipeline were unproductive and the cause of these problems (e.g., data not available, flushing of pipeline, etc.).
Performance analysis can also be useful in determining communication characteristics that may cause bottlenecks, such as the rate or change in rate of communication. For example, streams that receive communication bursts may require larger buffers, or an application may be ill-suited for a specific platform due to lack of bandwidth. The timing of communication can also be important; shared communication resources such as SRAMs often experience contention and should, in general, be monitored. Monitoring for these communication characteristics can aid in the design of a network that keeps pipelines at peak performance.
5. Molecular-Dynamics Case Study
To demonstrate the benefits of HLL performance analysis and explore its associated overhead, we analyze a Molecular-Dynamics (MD) application written in
Impulse C. MD simulates interactions between atoms and molecules over discrete time intervals. The simulation takes into account standard physics, Van Der Walls forces, and other interactions to calculate the movement of molecules over time. The simulation keeps track of 16,384 molecules, each of which uses 36 bytes (4 bytes to store its position, velocity and acceleration in each of the X, Y and Z directions). Alam et al. [12] provides a more in depth overview of MD simulations.
We obtained serial MD code optimized for traditional processors from Oak Ridge National Lab (ORNL). We redesigned the MD code in Impulse C 2.20 using an XD1000 as the target platform. The XD1000 is a reconfigurable system from Xtreme Data Inc. containing a dual-processor motherboard with an Altera Stratix-II EP2S180 FPGA on a module in one of the two Opteron sockets. The HyperTransport interconnect provides a sustained bandwidth of about 500 MB/s between the FPGA and host processor with Impulse-C. Using this platform, a speedup of 6.2 times was obtained versus the serial baseline running on the 2.2 GHz Opteron processor in the XD1000 server. Using our prototype performance analysis tool, we analyzed the performance of our MD code to determine if further speedup could be obtained.
The Impulse C compiler translates our MD code into a Quartus-II HDL design tailored for the XD1000. Impulse C relies upon state machines in the HDL code generated to preserve the structure of the original C code. The state machine structure is primarily determined by statements that represent a branch in execution, such as if, while, for, etc. Impulse C handles C statements within a branch by placing them either in a single state or in multiple sequential states depending upon their aggregated delay. However, a loop that is pipelined is always represented as one state within the state machine. After viewing the performance of a hardware subroutine via its state machine, more detailed analysis can be performed via tracing and profiling of application variables or other Impulse C constructs.
To present the data gathered by the HMM in a more intuitive fashion, the HDL code is reverse-mapped to HLL source code via variable name-matching (since similar names are used in both C and the generated HDL) and by observing scope and other patterns implicit in the HLL-to-HDL mapping. Overcoming this challenge allows performance data to be obtained and correlated directly to the HLL source code, removing the need for the application developer to understand HDL source code. While data from our performance analysis tool is currently exported in CSV (comma-separated values) format, this data could be integrated into visualizations from existing performance analysis tools
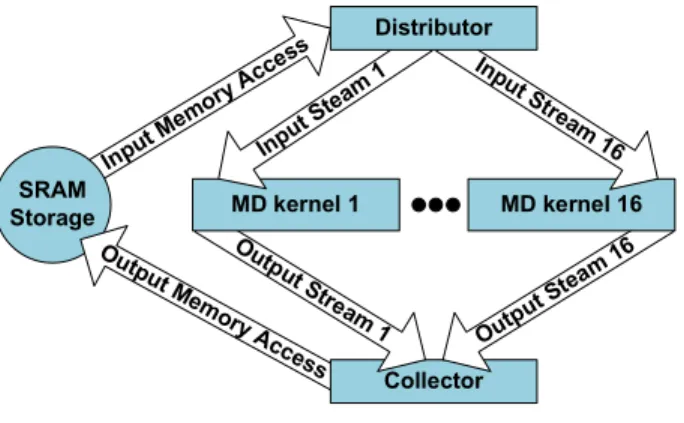
to aid the developer in quickly locating performance bottlenecks. Input Mem ory A cces s SRAM Storage Out put Mem ory Ac cess Collector Ou tput S tream 1 Output Stea m 16 MD kernel 16 Inp ut S tream 16 MD kernel 1 Inpu t Ste am 1 Distributor
Figure 4. MD Hardware Subroutine
There are three hardware functions defined in the MD hardware subroutine (see Figure 4). The two functions named Collector and Distributor are used to transfer data to and from SRAM, respectively, in order to provide a stream of data running through the third function, MD kernel. MD kernel calculates the position, velocity, and acceleration values of molecules and is pipelined using Impulse C pragmas. The function is then replicated 16 times, so that FPGA resources are nearly exhausted, so as to increase performance.
void MD_kernal (co_stream in, co_stream out) {
…
for(t=0;t<16384;t++){ co_stream_read(in, &x, …); co_stream_read(in, &y, …); co_stream_read(in, &z, …);…
for(i=0;i<1024;i++) {//Perform MD calculations #pragma CO PIPELINE…
} co_stream_write(out, &x, …); co_stream_write(out, &y, …); co_stream_write(out, &z, …); }…
} 51.67% 0.09% 0.26% 47.98% Percent Runtime (not shown)Figure 5. Profiling the MD Kernel
We instrumented and analyzed the MD application, with a focus on understanding the behavior of the state machine inside each MD kernel. The number of cycles spent in each state was recorded by the HMM and sent
back to the host processor post-mortem. Upon examination, three groups of states in the main loop of the MD kernel hardware function were of particular interest. The first group keeps track of the total number of cycles used by the input stream (arrows pointing to
MD kernels in Figure 4) of the MD kernel. The second group of states keeps track of the total number of cycles used by the pipeline inside of the MD kernel. Finally, the third group of states keeps track of the total number of cycles used by the output stream (arrows pointing to the Collector in Figure 4) in the MD kernel. Tracing was used to find the start and stop times of the FPGA and all MD kernels. The cycle counts from these three groups were then converted into a percentage of MD Kernel runtime (Figure 5) by dividing by the total number of cycles used by the MD hardware subroutine (i.e. FPGA runtime). Since the state groups vary by less than a third of a percent when compared across all 16
MD kernels, we only present data from one kernel.
MD Kernal Runtime 0 0.1 0.2 0.3 0.4 0.5 0.6 0.7 0.8 128 256 512 1024 2048 4096
Stream buffer size (bytes)
F P G A r u n ti m e ( s e c o n d s ) Other Output stream Pipeline
Figure 6. MD Kernel Runtime
Our performance analysis tool successfully identified a bottleneck in the MD hardware subroutine. In the MD kernels, almost half of the execution time was used by the output stream to send data to the
Collector hardware function (Figure 5). An optimal communication network would allow the pipeline performing molecular dynamics operations to execute for nearly 100% of the FPGA runtime minimizing the number of cycles spent blocking for a transfer to complete. This trait is an indicator that the stream buffers which hold 32-bit integers are becoming full and causing the pipeline to stall. Increasing the buffer size of the streams by 32 times (Figure 6) only required a change of one constant in the program. The larger stream buffers reduced the number of idle cycles generated by the output stream while the pipeline’s runtime remained the same thus reducing the FPGA
runtime. This simple change increased the speedup of the application from 6.2 to 7.8 versus the serial baseline.
EP2S180 Original Modified Difference Logic used (143520) 126252 (87.97%) 131851 (91.87%) +5599 (+3.90%) Comb. ALUT (143520) 100344 (69.92%) 104262 (72.65%) +3918 (+2.73%) Registers (143520) 104882 (73.08%) 110188 (76.78%) +5306 (+3.70%) Block memory (9383040 bits) 3437568 (36.64%) 3557376 (37.91%) +119808 (+1.27%) Frequency (MHz) 80.57 78.44 -2.13 (-2.64%)
Table 1. Performance Analysis Overhead
The overhead caused by instrumentation and measurement of the MD kernel with a stream buffer size of 4096 bytes on the XD1000 is shown in Table 1. Instrumentation and measurement hardware increased FPGA logic utilization by 3.90%. Profile counters and timers used an additional 3.70% of the FPGA’s logic registers, whereas tracing buffers required 1.27% additional block memory implementation bits. An additional 2.73% of combinational Adaptive Look-Up Tables (ALUT) was also needed. Finally, the FPGA experienced a slight frequency reduction of 2.64% due to instrumentation. Overall, the overhead for performance analysis was found to be quite modest.
6. Conclusions
Many of the challenges for performance analysis of HLL-based FPGA applications have been identified in this paper. Instrumentation at the HDL level was chosen for its portability between application mappers and platforms, while communication was instrumented at the HLL level to leverage the simplicity of using HLL communication channels. We also discussed instrumenting common HLL structures such as pipelines and communication channels, which could provide automated instrumentation as well as application-independent performance data. In addition, we employed techniques to map HDL performance data back to HLL source code for Impulse C, greatly reducing the effort and knowledge needed by the application developer. We also commented on the use of measured performance data for automatic bottleneck detection at the HLL source-code level to increase developer productivity.
A case study was presented to demonstrate the utility of profiling and tracing application behavior in hardware, allowing the developer to gain an understanding of where time was spent on the
reconfigurable processor. We also observed low overhead (in terms of FPGA resources) when adding instrumentation and measurement hardware, demonstrating the ability to analyze applications that use a large portion of the FPGA. In addition, we noted that a slight reduction in frequency (less than 3%) resulted from instrumentation. Since data was gathered after execution completed, there was no communication overhead.
Although instrumentation is currently added manually, it is planned in the future to automate this process via Perl scripts. Additional future work includes presenting performance data to the developer by leveraging existing visualization techniques from traditional (i.e. non-FPGA) performance analysis tools and expanding the performance analysis tool to support Carte.
7. Acknowledgments
This work was supported in part by the I/UCRC Program of the National Science Foundation under Grant No. EEC-0642422. The authors also gratefully acknowledge vendor equipment and/or tools provided by Impulse Accelerated Technologies, Altera, XtremeData, SRC Computers, and Aldec.
8. References
[1] D. Pellerin and S. Thibault, Practical FPGA
Programming in C, Prentice Hall PTR, 2005.
[2] D. S. Poznanovic, “Application Development on the SRC
Computers, Inc. Systems,” Proc. 19th IEEE International
Parallel and Distributed Processing Symposium (IPDPS), Denver, CO, April 2005, pp. 78a.
[3] K. S. Hemmert, J. L. Tripp, B. L. Hutchings, and P. A. Jackson. “Source Level Debugger for the Sea Cucumber
Synthesizing Compiler,” Proc. IEEE Symposium on
Field-Programmable Custom Computing Machines (FCCM), Napa, CA, April 2003, pp. 228-237.
[4] J. G. Tong and Mohammed A. S. Khalid, “A Comparison of Profiling Tools for FPGA-Based Embedded Systems,”
Proc. Canadian Conference on Electrical and Computer Engineering (CCECE), Vancouver, British Columbia, Canada, April 2007, pp. 1687-1690.
[5] M. Schulz, B. S. White, S. A. McKee, H. S. Lee, and J.
Jeitner. “Owl: next generation system monitoring,” Proc.
2nd Conference on Computing frontiers (CF), ACM Press, New York, NY, May 2005, pp. 116-124.
[6] S. Koehler, J. Curreri, and Alan D. George, “Challenges
for Performance Analysis in High-Performance
Reconfigurable Computing,” Proc. Reconfigurable
Systems Summer Institute (RSSI), Urbana, IL, July 2007. [7] S. Shende and A. D. Malony. “The Tau Parallel
Performance System,” International Journal of
High-Performance Computing Applications, SAGE Publications, May 2006, 20(2):287–311.
[8] H. Su, M. Billingsley, and A. George, "Parallel Performance Wizard: A Performance Analysis Tool for Partitioned Global-Address-Space Programming," 9th IEEE International Workshop on Parallel & Distributed Scientific and Engineering Computing (PDSEC) of IPDPS 2008, Miami, FL, Apr. 14-15, 2008.
[9] B. Mohr and F. Wolf. “KOJAK – a tool set for automatic performance analysis of parallel applications”. European Conference on Parallel Computing (EuroPar),pages 1301– 1304, Klagenfurt, Austria, LNCS 2790, August 26–29, 2003.
[10] J. Mellor-Crummey, R. J. Fowler, G. Marin, and N. Tallent. “HPCVIEW: A tool for top-down analysis of node performance”. The Journal of Supercomputing, 23(1):81–104, August 2002.
[11] P. Graham, B. Nelson, and B. Hutchings, “Instrumenting
bitstreams for debugging FPGA circuits,” Proc. IEEE
Symposium on Field-Programmable Custom Computing Machines (FCCM), IEEE Computer Society, Rohnert Park, CA, April 2001, pp. 41-50.
[12] S. R. Alam, J. S. Vetter, P. K. Agarwal, and Al Geist, “Performance characterization of molecular dynamics
techniques for biomolecular simulations,” Proc. 11th
ACM SIGPLAN symposium on Principles and Practice of Parallel Programming (PPoPP), ACM Press, New York, NY, 2006, pp. 59-68.