Cloud – vegetation interaction: use of Normalized Difference Cloud
Index for estimation of cloud optical thickness
A. Marshak, Y. Knyazikhin,† A. Davis,†† W. Wiscombe, andP. Pilewskie† † † NASA GSFC, Code 913, Greenbelt, MD 20771 and UMBC JCET, Baltimore MD 21250
†Boston University, Department of Geography, Boston, MA 02215
††Los Alamos National Laboratory, Space & Remote Sensing Sciences Group, Los Alamos, NM 87545 ††† NASA ARC, Moffett Field, CA 94035
Abstract. A new technique to retrieve cloud optical depth for broken clouds above green vegetation using ground-based zenith radiance measurements is developed
.
By analogy with the Normalized Difference Vegetation Index (NDVI), the Normalized Difference Cloud Index (NDCI) is defined as a ratio between the difference and the sum of two zenith radiances measured for two narrow spectral bands in the visible and near-IR regions. The very different spectral behavior of cloud liquid water drops and green vegetation is the key physics behind the NDCI. It provides extra tools to remove the radiative effects of the 3D cloud structure. Numerical calculations based on fractal clouds and real measurements of NDCI and cloud liquid water path confirm the improvements.1 .
Introduction
We study the removal of ambiguity in the interpretation of measured downwelling radiances in the simultaneous presence of broken clouds and green vegetation. A three-dimensional (3D) cloud structure triggers complex radiative effects (e.g., Marshak et al., 1998) that make remote sensing of cloud properties difficult or impossible. The key to solving this problem is the very different spectral behavior of cloud liquid water drops and green vegetation (Figs. 1a and 1b). For example, cloud optical properties, and hence cloud reflectivities, change little between 0.65 and 0.86 µm, while the vegetated surface albedo, ρsur, changes from 0.1 to 0.5 (e.g., Tucker, 1979) between the same two wavelengths. This spectral contrast in surface albedo suggests using ground measurements at both wavelengths not independently, but as an algebraic combination (a spectral index).
Based on this idea, we have developed a new technique to retrieve cloud optical depth for broken clouds above green vegetation using ground zenith radiance measurements in two narrow spectral bands in the visible (VIS) and near-IR (NIR) regions. For a spectral band in the NIR region, the green vegetation acts as a powerful reflector that “illuminates”
horizontally inhomogeneous clouds from below. This provides the extra information needed to largely remove the radiative effects of the 3D cloud structure, especially in the case of broken clouds; this in turn allows the retrieval of cloud optical depth using traditional one-dimensional (1D) radiative transfer theory. 0 0 . 1 0 . 2 0 . 3 0 . 4 0 . 5 0 . 6 0 . 4 0 . 6 0 . 8 1 1 . 2 1 . 4 1 . 6 1 . 8 surface reflectance at 300 m wavelength (µm ) V I S n e a r - I R m i d - I R ( a ) 0 . 7 5 0 . 8 0 . 8 5 0 . 9 0 . 9 5 1 0 1 0 2 0 3 0 4 0 5 0 6 0 0 . 4 0 . 6 0 . 8 1 1 . 2 1 . 4 1 . 6 1 . 8 g and ω0 (dimensionless) extinction, σ (1/km) wavelength (µm ) ω 0 σ g VIS n e a r - I R m i d - I R ( b )
Figure 1. Spectral properties of vegetation and clouds. (a) Surface reflectance was measured in Israel from an
airplane at 300 m in May, 1998 (Andrew Wald, private communication). (b) Cloud optical properties: single scattering albedos, ϖ0, phase function asymmetry parameter, g , and extinction coefficient, σ. Data correspond to “CS clouds” (with small-sized droplets) used in Intercomparison of Radiative Codes in Climate Models.
Other investigators have retrieved cloud optical depth from upward-looking measurements using 1D radiative transfer algorithms (e.g., Min and Harrison, 1996; Leontieva and Stamnes, 1996). But these retrievals give credible results only for completely
overcast sky and/or substantial averaging (e.g., Ricchiazzi et al., 1995). In the case of broken clouds, any inversion technique based solely on 1D radiative transfer will almost surely fail.
2 .
Approach
2.1 3D radiation effects of broken clouds
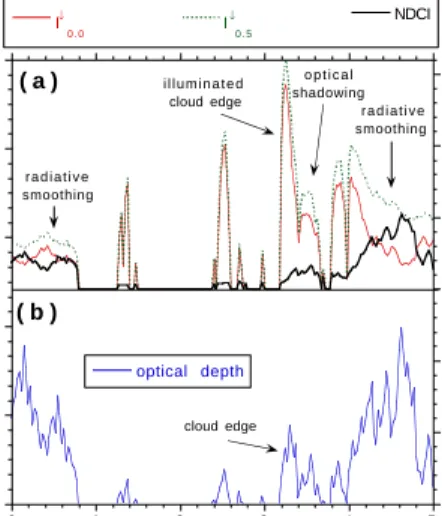
For a simulated broken cloud field with optical depths in Fig. 2b, Fig. 2a shows a 5-km fragment of zenith radiance calculated with 25 m resolution. Assuming a 5 m/s wind speed and frozen turbulence, this can also be interpreted as a 1000-s time series of zenith radiances "measured" by an upward-looking radiometer with 5-s averaging.
0 3 0 6 0 0 0.5 1 1.5 0 1 2 3 4 5 optical depth I↓ 0 . 0 I ↓ 0 . 5 NDCI optical depth, τ zenith radiances and NDCI x (km) ( a ) ( b ) r a d i a t i v e smoothing r a d i a t i v e smoothing i l l u m i n a t e d cloud edge o p t i c a l shadowing cloud edge
Figure 2. 3D radiative effects. (a) A 5-km fragment of
zenith radiances, I↓(x), calculated by Monte Carlo methods for “black” surface (ρsur = 0.0), and “bright”
surface (ρsur = 0.5). Spectral index NDCI is also shown.
Pixel size is 25 m, solar zenith angle θ0 = 60o
(illumination from the left), ϖ0 = 1.0,
Henyey-Greenstein scattering phase function. (b) A 5-km fragment of horizontal distribution of optical thickness,
τ(x), that corresponds to the zenith radiances plotted in panel (a). 10-steps bounded cascade model (Cahalan et al., 1994) with parameters 〈τ〉 = 13, β = 1.4 and p = 0.35 has been used; the outer-scale L = 25.6 km. Holes are added as in Marshak et al. (1998). Geometrical cloud thickness is 300 m.
In Fig. 2a, we see sharp changes in brightness around cloud edges (x ≈ 3.2 km) and shadows behind them (x ≈ 3.4 km). By contrast, in regions of large optical thickness (x ≈ 0–0.8, and 4.2–5 km), we observe much smoother behavior of zenith radiances compared to the corresponding cloud optical depth field. This is “radiative smoothing” (Marshak et al.,
1995)a process determined by multiple scattering and photon horizontal transport (for an experimental study, see Savigny et al., 1999). Thus, there are two competing radiative processes: shadowing (a “roughening” trend) and smoothing. Indeed, shadowing enhances fluctuations, while radiative smoothing suppresses them. All these 3D effects prevent a one-to-one relationship between optical depth and zenith radiances and thus make it impossible to retrieve cloud optical thickness on a pixel-by-pixel basis.
Finally, Fig. 3 shows wavenumber spectra of cloud optical and simulated zenith radiances. While the wavenumber spectrum E(k) of optical depth τ is a power law with a spectral exponent β ≈ 1.4 (as observed),
E(k) ~ k–β, (1)
the spectrum of zenith radiances has a more complex structure due to the dependence of the above-mentioned 3D radiative effects on scale. For large and intermediate scales (≈ 0.5 to 20 km) the radiance spectrum flattens, indicating larger fluctuations; for small scales the spectrum steepens, indicating smaller fluctuations. The former is a signature of shadowing, the latter of radiative smoothing.
-5.0 0.0 5.0 10.0 15.0 20.0 25.0 30.0 0.0 2.0 4.0 6.0 8.0 log 2 E(k) log 2(kL), L=25.6 km β=1.4 optical depth, τ zenith radiance, I↓ 0.0 NDCI 25.6 6.4 1.6 0.4 0.1 scale, r (km)
Figure 3. Wavenumber spectra of 10 realizations of
cloud optical depths, zenith radiances and NDCI defined in Eq. (4). A slope β = 1.4 that corresponds to the spectral exponent of a cloud optical depth model is added for reference.
In order to use zenith radiances for estimating cloud optical properties, one has to remove the 3D radiative effects of shadowing and smoothing. As long as fluctuations of cloud optical thickness and zenith radiance are qualitatively different at a given scale, it is impossible to reliably retrieve optical thickness at this scale—it becomes an indeterminate or multi-valued problem. One solution is to devise a nonlinear transformation of the radiance field that
leads to wavenumber spectra similar to those of the optical depth field.
2.2 A nonlinear transformation
The chlorophyll in green vegetation strongly absorbs solar radiation in the VIS but not in the NIR region. Thus, the NIR albedo of vegetation often exceeds 50%. Vegetation (or spectral) indices that exploit this albedo contrast are quite popular in the land-surface remote sensing community. Among more than a dozen which have been proposed (Verstraete and Pinty, 1996), the most widely used is the Normalized Difference Vegetation Index (NDVI; Tucker, 1979) which is just the difference of the NIR and red channels divided by their sum.
By analogy with NDVI, we define the Normalized Difference Cloud Index (NDCI) as a ratio between the difference and the sum of two zenith radiances measured for two narrow spectral bands around wavelengths λ1 and λ2,
NDCI = I
↓(λ2) – I↓(λ1)
I↓(λ2) + I↓(λ1)
. (2)
The wavelengths λ1 and λ2 are chosen to have similar cloud optical parameters but different surface reflectance, e.g., λ1 = 0.65 µm and λ2 = 0.86 µm (cf. Figs. 1ab). Note that in Eq. (2), "I" refers not to an actual intensity but an intensity normalized by the amount of solar flux hitting the top of the atmosphere in the corresponding spectral interval.
2.3 Numerical example
Figure 2a shows NDCI, along with the two zenith radiances going into its definition, for the case discussed above. We can see how the NDCI transformation largely removes 3D effects and causes NDCI to fluctuate similarly to the cloud optical depth. NDCI is much more sensitive to cloud optical depth structure than either of the two zenith radiances, and furthermore it shows a monotonicity with respect to cloud optical depth which augurs well for a one-to-one relationship. In the simulation, the o n l y difference between simulated zenith radiances at wavelengths λ1 and λ2 is the surface albedo (spatially homogeneous, Lambertian) which was set to 0.0 and 0.5, respectively. For simplicity, all other optical and geometrical parameters of the model are the same.
The improvement is confirmed by the wavenumber spectra (Fig. 3). It has the same slope as its cloud optical depth counterpart down to about r = 0.4 km; below this scale, NDCI(x) is smoother than τ(x) which is clearly seen if one compares three curves in
Fig. 2a. This means that, averaged over a 0.4 km scale, both NDCI and τ have similar fluctuations; thus cloud optical depth can be successfully retrieved at this scale.
2.4 Measurements
Downwelling spectral flux at the surface was measured by Spectral Flux Radiometer (SPFR) at the Atmospheric Radiation Measurement (ARM) site in Oklahoma. SPFR measures solar spectral flux between 0.25 and 2.5 µm, continuously, in 10 nm bands (Pilewskie, et al., 1998). Next to SPFR, there was a Microwave Water Radiometer (MWR) that measures column-integrated amounts of water vapor and liquid water (Liljegren, 1994).
Figure 4 shows a ratio between the difference and the sum of two downwelling fluxes (per unit incident flux) measured by SPFR at 0.65 and 0.86 µm on September 21, 1997. The ratio (NDCI) was plotted on the same plot as cloud liquid water path (LWP) from MWR averaged over 1 min. It is clearly seen that NDCI is highly correlated with LWP. The correlation is expected to be better if radiances are used instead of fluxes and measurements are corrected for Rayleigh scattering and aerosol optical depths different for 0.65 and 0.86 µm.
0.01 0.02 0.03 0.04 0.05 0.06 0.07 0.08 0.09 0 0.02 0.04 0.06 0.08 0.1 0.12 0.14 -50 0 50 100 150 200 250 Sept. 21, 1997 NDCI cos(SZA)/10 LWP (cm) NDCI LWP min
Figure 4. NDCI and cloud LWP measured at the ARM
site in Oklahoma and averaged over 1 min. NDCI is defined in Eq.(2) with transmittances instead of radiances. Cosine of the solar zenith angle is added for reference.
3. Theoretical basis of NDCI
3.1 Expansion of the downward radiation
Any ground measurements of either radiative flux or radiance can be represented as a sum of two components: the radiation calculated for a “black” surface (blk) and the remaining radiation (rem). In case of zenith radiance,
In Eq. (3), the second component, Irest, accounts for additional radiation due to surface-cloud multiple reflection.
It is known (e.g., Chandrasekhar, 1960, p. 273; Box et al., 1988) that for the case of simple slab geometry and a Lambertian surface with albedo ρsur,
Irem = 1–ρsurρsurR Tblk Is. (4) Here, R is the spherical albedo for isotropically illuminated clouds, Tbs is the transmittance in the black surface case, and Is is the radiance generated by an isotropic source located at the surface.
Although in a 3D case the surface-cloud interactions term cannot be expressed in such a simple form as Eq. (4), the physical meaning of the representation (3) captures the essential physics— namely (Knyazikhin et al., 1998), that the downwelling radiance at the surface can be expressed in terms of
• the radiation in a cloudy layer for a black surface; • surface reflectance (which is independent of cloud); • the radiation in a cloudy layer generated by
anisotropic sources located at the surface.
3.2 Surface-cloud interactions
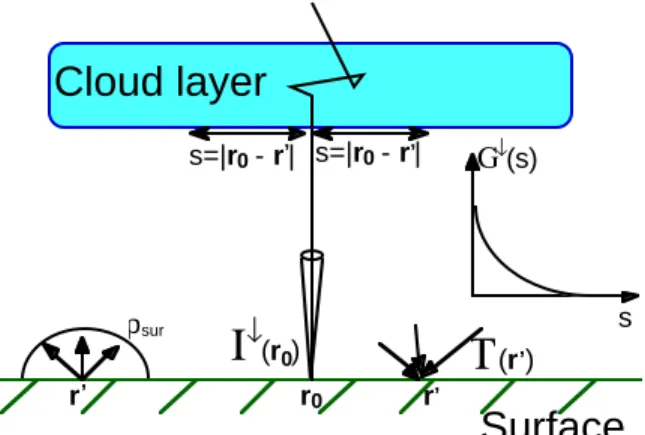
Figure 5 is a schematic illustration of these ideas. Using adjoint radiative transfer (e.g., Bell and Glasstone, 1970), it can be shown that the surface-cloud interaction term Irem can be expressed as a product of ρsur and an integral (over the whole surface) of the downward flux T and a radiative-transfer Green function G,
Irem(r0) = ρsur
∫
T(r’) G(|r0-r’|)dr’. (5)The Green function is the cloud radiative response to the illumination from below by point sources uniformly distributed over the whole surface.
This is similar to Davis et al.’s (1997) idea of illuminating clouds by a laser beam and measuring the resulting “spot-size,” which involves the radiative transfer Green function. Based on the diffusion approximation, Davis et al. were able to analytically derive a relationship between the spot’s r.m.s. radius and cloud optical and geometrical thicknesses. Actual measurements of G are reported by Davis et al. (1999).
3.3 NDCI
Since vegetation reflectance varies considerably between VIS and NIR while cloud optical properties are nearly constant, the difference between two zenith radiances I↓(λ1), λ1∈VIS, and I↓(λ2), λ2∈NIR, measured at the same location is
equal to the difference between surface-clouds interactions at the same wavelengths, i.e.,
I↓(λ2) – I↓(λ1) = I↓rem(λ2) – I↓rem(λ1). (6) Normalizing (6) by the sum of two radiances, we get the NDCI defined in Eq. (2).
ρsur r0
I
↓(r0) r’T
(r’) sCloud layer
Surface
r’ G ↓(s) s=|r0 - r’| s=|r0 - r’|Figure 5. Surface-cloud interaction. I↓(r0) is measured
zenith radiance at a point r0; ρsur surface albedo; T(r’) is
downward flux “measured” at r’, G↓(s), s=|r0–r’|, is the
radiative transfer Green function which is the cloud’s response to illumination by a δ-function source at r’.
In summary, the NDCI method uses the surface as a powerful reflector to obtain information on cloud optical properties even in the presence of strong 3D cloud structure.
Acknowledgments. AM was supported by the Department of Energy (under grant DE-A105-90ER61069 to NASA’s GSFC) as part of the Atmospheric Radiation Measurement (ARM) program, and by NASA’s EOS Project Science Office at GSFC (under grant NAG5-6675) as part of the EOS Validation Program. YK was supported by NASA under grant NAG5-96061. We thank B. Holben, R. Myneni, L. Oreopoulos, A. Smirnov, and G. Wen for stimulating discussions.
References
Bell, G. I., and Glasstone, 1970: Nuclear Reactor
Theory, Van Nostrand Reinholt, New York, 619
p p .
Box, M. A., S. A. W. Gerstl, and C. Simmer, 1988: Application of the adjoint formulation of the calculation of atmospheric radiative effects. Beitr.
Phys. Atmosph., 61, 303–311.
Cahalan, R. F., 1994: Bounded cascade clouds: Albedo and effective thickness. Nonlinear Processes in
Chandrasekhar, S., 1950: Radiative Transfer, Oxford University Press, reprinted by Dover, 1960, New York (NY), 393 pp.
Davis, A., A. Marshak, R. Cahalan, and W. Wiscombe, 1997: The Landsat scale-break in stratocumulus as a three-dimensional radiative transfer effect, implications for cloud remote sensing. J. Atmos.
Sci., 54, 241–260.
Davis, A. B., R. F. Cahalan, J. D. Spinhirne, M. J. McGill, and S. P. Love, 1998: Off-beam lidar: An emerging technique in cloud remote sensing based on radiative Green-function theory in the diffusion domain, Phys. Chem. Earth, 24, 757-765.
Harrison, L. C., and J. J. Michalsky, 1994: Objective algorithms for the retrieval of optical depths from ground-based measurements. Appl. Optics, 33, 5126–5132.
Knyazikhin, Y., J. V. Martonchik, R. B. Myneni, D. J. Diner, and S. W. Running, 1998: Synergistic algorithm for estimating vegetation canopy leaf area index and fraction of absorbed photosynthetically active radiation from MODIS and MISR data. J. Geophys. Res., 103, 32257-32275.
Leontieva, E., and K. Stamnes, 1996: Remote sensing of cloud optical properties from ground-based measurements of transmittance: a feasibility case.
J. Appl. Meteor., 35, 2012–2022.
Liljegren, J. C, 1994: Observations of total column precipitable water vapor and cloud liquid water path using a dual-frequency microwave radiometer. In Microwave Radiometry and Remote Sensing of the Environment, D. Solimini, ed. VSP Press.
Marshak, A., A. Davis, W. Wiscombe, and R. Cahalan, 1995: Radiative smoothing in fractal clouds. J.
Geophys. Res., 100, 26247–26261.
Marshak, A., A. Davis, W. J. Wiscombe, W. Ridgway, and R. F. Cahalan, 1998: Biases in shortwave column absorption in the presence of fractal clouds. J. Climate, 11, 431–446.
Min, Q. L., and L. C. Harrison, 1996: Cloud properties derived from surface MFRSR measurements and comparison with GOES results at the ARM SGP site. Geophys. Res. Lett., 23, 1641–1644. Pilewskie, P., A. F. H. Goetz, D. A. Beal, R. W.
Bergstrom, and P. Mariani, 1998: Observations of the spectral distribution of solar irradiance at the ground during SUCCESS. G. Res. Lett., 25, 1141–1144.
Ricchiazzi, P., C. Gautier, and D. Lubin, 1995: Cloud scattering optical depth and local surface albedo in the Antarctic - simultaneous retrieval using ground-based radiometry. J. Geophys. Res., 100, 21091–21104.
Savigny, C., O. Funk, U. Platt, and K. Pfeilsticker 1999: Radiative smoothing in zenith-scattered sky light transmitted through clouds to the ground. G. Res.
Lett., (in press).
Tucker, C. J., 1979: Red and photographic infrared linear combination for monitoring vegetation. Remote
Sens. Environ., 8, 127–150.
Verstraete, M. M., and B. Pinty, 1996: Designing optical spectral indexes for remote sensing applications. IEEE Trans. Geoscience Rem.