https://doi.org/10.1007/s13209-019-0188-6
O R I G I N A L A R T I C L E
Efficiency evaluation of hotel chains: a Spanish case study
Yaguo Deng1·Helena Veiga2,3·Michael P. Wiper2Received: 29 October 2018 / Accepted: 25 February 2019 / Published online: 15 March 2019 © The Author(s) 2019
Abstract
The tourism industry, in particular the hotel sector, is a highly competitive market. In this context, it is important that an hotel chain operates efficiently if it wants to improve or maintain its market position. The objective of this work is to compare the relative efficiency of hotel chains operating in Spain. To do this, we have designed a stochastic frontier model to measure revenue efficiency as a function of various different inputs such as total staff or number of rooms. Given that chains vary considerably in size, both inputs and outputs are normalized by an appropriate size measure. In contrast to most previous work, we account for heterogeneity in hotel chains by introducing relevant variables, such as the proportion of hotels in the chain with three stars or fewer, into the efficiency term of the stochastic frontier model. Our results suggest that in the Spanish case, in the period of the economic crisis, hotel chains increase overall revenue by investing in fewer, big hotels rather than more, small hotels. Furthermore, in terms of revenue efficiency, it appears better for hotel chains to invest in hotels of three or fewer stars than in higher star rated hotels. Finally, there is no clear evidence of a relationship between the size of a hotel chain and its efficiency.
Keywords Bayesian inference·Efficiency·Heterogeneity·Revenue function· Stochastic frontier analysis
JEL Classification C11·C13·Z30
B
Michael P. Wiper [email protected]1 Department of Statistics, Universidad Carlos III de Madrid, Getafe, Spain
2 Department of Statistics and Instituto Flores de Lemus, Universidad Carlos III de Madrid, Getafe, Spain
1 Introduction
The high level of competition in the tourism market, especially the hospitality industry, makes the formulation of a marketing strategy, strengthening hotel operations and improving the quality of service essential, not only for the profitability, but also for the survival of both individual hotels and hotel chains; see Hwang and Chang (2003). All these factors, directly or indirectly, depend on the efficient management of hotel chains. In addition, due to its characteristic of an oligopolistic market, Barros (2004) and Phillips (1999) indicate that the level of competition in the hospitality sector requires efficiency; see also Teague and Eilon (1973).
In the twentieth century, many efficiency studies in the tourism industry focused on measuring efficiency via accounting-based measures (Baker and Riley1994; Phillips and Louvieris2005). However, modern approaches to efficiency measurement have been based on the idea of an efficient frontier function representing the output which may be achieved by an efficient company. One popular technique is data envelopment analysis (DEA), which assumes a deterministic frontier that can be estimated using optimization techniques. One advantage of this methodology is its ability to handle multiple inputs and outputs without imposing strong assumptions on the production frontier. However, the existence of statistical noise and measurement errors in the data, in particular in cross-sectional analyses, may lead to biased efficiency estimation, with terrible consequences for policy implications; see, e.g., Banker et al. (1993) and Bifulco and Bretschneider (2001), for simulations on the impact of measurement errors on the estimation of efficiencies. Therefore, in cross-sectional analyses, stochastic frontier analysis (SFA) is often preferred. Here, a composite error term, composed of a random component and a component measuring inefficiency, is introduced to the frontier and statistical estimation techniques can be applied; see, e.g., Coelli (2005) and Behr (2015), for good overviews of both DEA and SFA. Two of the first studies using the concept of the efficient frontier in the hospitality sector are Johns et al. (1997) and Anderson et al. (1999). For a very good, recent survey of the literature on efficiency in this area; see Assaf and Josiassen (2016).
In most studies of efficiency using SFA, it is assumed that the inefficiency term is homogeneous. However, in many situations, inefficiency may be related to character-istics of a company that do not affect the frontier. For example, charactercharacter-istics such as the star status or location of a hotel might be considered as belonging to this cate-gory. Heterogeneity in terms of such characteristics can lead to inaccurate inefficiency measurement; see, e.g., Reifschneider and Stevenson (1991), Caudill and Ford (1993) and Caudill et al. (1995). Nevertheless, there are relatively few works that explore this issue. Some examples are Greene (2005), Galán et al. (2014) and Arbelo et al. (2018). Although the majority of works on SFA are based on the use of frequentist sta-tistical approaches, stemming from van den Broeck et al. (1994b) and more recently Griffin and Steel (2007), who showed how to implement the Bayesian approach in a straightforward way using the freely available software packageWinBUGS, there has been recent interest in applying Bayesian statistical methods. Bayesian approaches have a number of advantages as compared to more traditional approaches, as outlined in van den Broeck et al. (1994a). In particular, regularity conditions are easily incorpo-rated and parameter uncertainty is formally considered in deriving posterior densities
for individual efficiencies. Bayesian approaches have been applied in the hospitality industry in Assaf (2012), Assaf and Magnini (2012), Assaf and Barros (2013) and Arbelo et al. (2018).
The majority of works on efficiency in the hotel sector focus on comparing the efficiencies of individual hotels or of companies owning a small number of establish-ments. Some exceptions are the studies by Brown and Ragsdale (2002) and Neves and Lourenço (2009) where the DEA methodology is applied to study the efficiency of large international chains and Ferreira et al. (2017) who examine Portuguese hotel chains. In the context of SFA, Oliveira et al. (2013b) examine the relative efficiency of hotels and small hotel chains in the Algarve region of Portugal. In contrast to Oliveira et al. (2013b), where chains are composed only of two or three hotels at most, a contri-bution of our paper is to compare the relative efficiencies of large, Spanish hotel chains via the SFA methodology. All chains in our survey have more than a thousand rooms and the two biggest chains studied (Meliá and NH) have 139 and 137 establishments, respectively.
There are some difficulties associated with using this methodology to analyze chains rather than individual establishments. Firstly, the selection of inputs for hotel chains cannot be carried out in exactly the same way as for individual establishments. For example, typically the price of a room varies within different hotels in the same chain so that if we wish to consider room price as an input, then we need to use an average price measure. Furthermore, in the case of the Spanish hotel chains studied in this article, total revenue is typically almost directly related to chain size. Therefore, when modeling using SFA, in contrast to Oliveira et al. (2013b) who suggested including a dummy variable in the frontier function to account for the ownership of multiple hotels, here we prefer to normalize revenue by an appropriate measure of chain size. These normalizations avoid problems of multicollinearity which lead to unstable estimation results from the regression model.
In this paper, we analyze a cross-sectional data set of Spanish hotel chains. There-fore, given the criticisms of DEA pointed out previously, we prefer to use SFA to analyze hotel chain efficiency. We use both frequentist and Bayesian approaches to compare the revenue efficiencies of different chains using SFA under the assumption of homoscedastic efficiency terms. There is evidence that the estimated efficiencies are correlated with exogeneous factors such as the proportion of hotels of three or fewer stars or the proportion of beach hotels in the chain, which suggests that these factors should be incorporated in the inefficiency model. In order to do this, we use a Bayesian statistical approach which is implemented in the free softwareRvia the R2OpenBUGSpackage.
The rest of this paper is organized as follows. In Sect.2, we give a brief review of the relevant literature. Then, Sect.3introduces the SFA model and its inference through frequentist and Bayesian techniques. In Sect. 4, we give a brief overview of the Spanish hotel sector and in Sect. 5, we introduce some working hypothe-ses concerning the efficiency of Spanish hotel chains. In Sect. 6, we describe the data covering Spanish hotel chains and the relevant variables as inputs. We also ana-lyze the data through SFA with heterogeneity using Bayesian inference. Finally, in Sect.7we provide some conclusions and consider some possible extensions of our approach.
2 Literature review
In this section, we review different works that focus on hotel efficiency estimation based on the SFA methodology. As stated before, this is a parametric methodology that considers a firm that deviates from its optimal frontier to be inefficient.
Many different types of output, input and exogenous variables have been considered in the efficiency literature on the hotel industry; see, e.g., Anderson et al. (1999), Bar-ros (2004), Chen (2007), Barros et al. (2010) and Bernini and Guizzardi (2010). Most papers consider total revenue, sales, number of rooms, market share or guest num-bers as output variables. As inputs, several studies have chosen variables that reflect strategic, financial and operation decisions and that contribute to revenues. Strategic decisions are those related to the investment made. On the other hand, financial deci-sions are related to the capital structure and operational decideci-sions include both the cost of goods and services provided and the working capital requirements; see, e.g., Neves and Lourenço (2009). The majority of these studies estimate technical effi-ciency and use cost functions as frontiers. Exceptions are the works by Oliveira et al. (2013b) and Arbelo et al. (2018) where revenue and profit efficiency are considered, respectively. Arbelo-Pérez et al. (2017) point out that cost inefficiency has several drawbacks since it does not differentiate between hotels in terms of the quality of their services.
Regarding the quality of hotel services, only Assaf and Magnini (2012) consider customer satisfaction as a proxy of hotel quality, and they find that this can change hotel efficiency rankings considerably when it is taken into account. Other authors suggest using star rating as a proxy of hotel quality; see, e.g., Abrate et al. (2011), Becerra et al. (2013) and Núnez-Serrano et al. (2014). However, the literature does not provide a clear conclusion concerning the relationship between technical effi-ciency and star rating. Such-Devesa and Peñalver (2013) find evidence in the case of Spain that the star rating of a hotel is positively correlated with technical efficiency while Jorge and Suárez (2014) conclude the opposite and Oliveira et al. (2013a) find that the star rating does not influence the technical efficiency of Portuguese hotels.
Another variable that has also been related to hotel quality is the existence of golf facilities. For instance, Oliveira et al. (2013b) find that hotels with golf facilities present higher efficiency than hotels without golf since they attract customers with higher purchasing power who are looking for a differentiation in service quality. Also, the location of a hotel is also relevant for determining efficiency, since once a hotel is established, it is very costly to relocate it. Moreover, location is an important factor in the choice decision made by a tourist. For example, Barsky and Labagh (1992) and Chu and Choi (2000) report evidence that holiday tourists find the location of a hotel establishment crucial in their decision process. Arbelo et al. (2018) find that profit efficiency is higher in hotels based in resort areas. Some of the location variables considered in the literature are the distance from an international airport (Hu et al.
2010; Honma and Hu2012), the existence of a major road or the distance from a city (Barros2005) and a seaside town (Bernini and Guizzardi2010); see Yang et al. (2014), for a complete review of the main models and variables used in deciding upon a hotel’s location.
3 Methodology
In this section, we present the stochastic frontier model which is motivated by the idea that deviations from the efficient frontier are not always entirely under the control of a firm.
3.1 Efficiency and the frontier function
According to Koopmans (1951), a company is technically efficient if it is able to use inputs efficiently. In other words, the company can produce the maximum output given a certain amount of inputs. Thus, technical efficiency is associated with the physical use of resources in the production process and is not linked to any economic objective. Assuming that the aim is to maximize output (in our case this will be revenue), besides being technically efficient, a firm needs to obtain an allocation of inputs that generates as much output as possible. If the firm is able to achieve this allocation, it is (revenue) efficient.
The frontier function,I(xi;β), representing the maximum output, depends on the
inputs employed, sayxn, forn =1, . . . ,N. The actual output of firmi,Ei, satisfies
Ei ≤ I(xi;β) fori =1, . . . ,K. (1)
The output efficiency of firmi, sayO Ei ≤1, is defined as
O Ei =
Ei
I(xi;β)
(2) and is equal to one only if the firm is 100% efficient.
Various specifications for the frontier functionI(xi;β)are possible. In this paper,
we use a log-linear, Cobb–Douglas function whose specification is given by: lnI(xi, β)=β0+
n
βn lnxni. (3)
The use of the Cobb–Douglas function is justified by its simple interpretation and estimation. Although other functions such as the translog are more flexible, their estimation results are more difficult to interpret and require the estimation of many more parameters. In our context, we have a relatively small sample size, which would likely imply that the translog function would not be estimated accurately.
3.2 The stochastic frontier
Inefficiency can be due to both inherent problems in an individual firm’s activity and factors that are beyond their control. Therefore, it is reasonable to consider the possibility of a stochastic frontier function by including an error in the definition of the frontier,I(xi;β), so that, taking logarithms, we have:
lnI(xi, β)=β0+
n
βn lnxni +vi, (4)
wherevi represents the idiosyncratic error component which is often assumed to be normally distributed. Taking logarithms in (2), now gives the SFA equation
lnEi =β0+
n
βn lnxni +vi−ui, (5)
whereui = −lnO Ei ≥0.
3.3 Inference for SFA models
In order to undertake inference for the SFA model, we need either to use a nonparamet-ric approach (see, e.g, Kumbhakar et al.2007) or otherwise to specify distributional forms for the error termsvi andui in Eq. (5). Here, we assume throughout that the
idiosyncratic errors,vi, fori =1,2, . . ., are independent and identically distributed normal variables with a common variance term,vi ∼ N(0, σv2). For the inefficiency term, many parametric forms have been proposed in the literature; see, e.g., Greene (2008). In this article, we shall generally assume one of the most standard functional forms, that is a half-normal distribution modelui ∼ N+(0, σui2)where in this case,
when we allow for efficiency heterogeneity, the scale parameter may depend on indi-vidual hotel chain characteristics.
Two of the most common approaches to fitting SFA models use classical or fre-quentist and Bayesian statistical techniques, respectively. This subsection summarizes the characteristics of these two methods.
3.3.1 Classical approach
The most popular approach to parameter estimation for SFA models is via maximum likelihood estimation that is, given the data sample, the optimal set of parameters is that which maximizes the likelihood function. Given the error distributions commented previously, the likelihood function can be calculated explicitly and then likelihood maximization can be carried out directly. A number of software packages are available for parameter estimation, and in this case we use thefrontierpackage (Coelli and Henningsen2013) withinRfor implementation.
In the models we analyze, there are quite a large number (twelve) of possible explanatory variables which could be included in the frontier function (as well as others which might affect the inefficiency term). Therefore, it is important to decide which of these are relevant. In order to do this, we propose using standard model selection criteria to choose between different fitted models. Within the classical framework, the two most popular of these are the Akaike information criterion (AIC) and the Bayesian information criterion (BIC).
3.3.2 Bayesian approach
In contrast to classical methods, a Bayesian approach begins by assuming that, given a model M, there is a prior distribution, f(θ|M), available for the unknown model parametersθ. Given the datay, the prior distribution can then be updated to a posterior distribution, f(θ|y,M)via Bayes theorem:
f(θ|y,M)∝ f(θ|M)f(y|θ,M). (6) van den Broeck et al. (1994a) present several advantages of Bayesian inference as opposed to the classical approach. In particular, a posterior distribution for the ineffi-ciency term,ui, of firmican be obtained as:
f(ui|y,M)=
f(ui|y,θ,M)f(θ|y,M)dθ,
which permits interval estimation of the inefficiencies instead of just point estimation. Unfortunately, for most of the models analyzed here, the exact calculation of poste-rior distributions is impossible. Therefore, we must apply simulation methods which allow us to simulate a sample from the posterior parameter distribution such as Markov chain Monte Carlo approaches; see Robert and Casella (2013). Fortunately, Griffin and Steel (2007) show that these methods can be implemented for SFA models via the WinBUGSstatistical package. We proceed in a similar way and use the more recent packageOpenBUGSviaR2OpenBUGSinRto carry out the fitting of Bayesian mod-els.
To select models under the Bayesian approach, we consider a version of the deviance criterion (deviance information criterion or DIC) of Spiegelhalter et al. (2002), which is, in the context of regression models, similar to a Bayesian version of the AIC. A major advantage of this approach is that it makes DIC to be very easy to calculate through the output of OpenBUGS and this criterion is recommended for use in the SFA context in Griffin and Steel (2007). Unfortunately, it is illustrated in Celeux et al. (2006) that in models with latent variables (such as the efficiencies in SFA), the original DIC may give inaccurate results. Celeux et al. (2006) present several variants of the DIC to resolve this problem and recommend the use of DIC3 criterion, which we use in this paper. The interpretation is the same as that of the DIC: the lowest value of DIC3 indicates the best model.
4 The Spanish hotel sector
Tourism is one of the most important contributors to the Spanish economy, with earn-ings from this sector contributing around 11% of the Gross Domestic Product and over 75 million foreign tourists visiting the country in 2016. The high quantity of both internal and foreign visitors clearly requires accommodating and, by 2015, there were almost 17,000 hotels in Spain. Many Spanish hotels are run by large chains and, for example, by 2011, approximately 20% of the market was dominated by the biggest
five hotel chains (Meliá, Riu, NH, Barceló and Iberostar and nearly 30% by the biggest ten chains). Therefore, in the Spanish context, it is important not to consider hotels just as single entities but also to examine the relative efficiencies of different hotel chains, which is one of the main objectives of this paper.
The five most popular tourist destinations in the country are Catalonia, the Canary Islands and the Balearics, followed by Andalusia and Valencia, that is the Spanish coastal communities and islands with lots of sun and sand tourism although in recent years, there has been increasing interest in other types of tourism such as ecotourism, wine tourism, etc., away from the traditional tourist zones; see, e.g., Aguiló et al. (2005).
5 Working hypotheses
Size has different meanings according to whether we consider companies (chains) or individual hotels. Chain size is often measured via the number of employees hired or the number of establishments in the chain, while hotel size is often measured by the number of rooms. The evidence found in the literature regarding hotel size and performance is not completely clear, although several studies have suggested that larger, individual hotels can achieve higher levels of performance due to economies of scale, higher bargaining power and more possibilities of funding and investment; see, e.g., Claver et al. (2007a,b), Kim et al. (2013) and Babayan et al. (2014). Assaf et al. (2012) and Arbelo et al. (2018) report evidence that large chain hotels achieved a better performance than small, independent hotels. Also, Babayan et al. (2014) show that the size of a hotel positively affects the total revenue and that establishments with less than one hundred rooms do not seem to manage their assets so well.
In the Spanish context, where the market is dominated by mass tourism, it would also seem reasonable to suppose that tourists would typically prefer to go to a cheaper, larger establishment than to pay more for a stay in a smaller, dearer hotel. Therefore, extending the previous arguments to chains of hotels, this would suggest that a big chain of small establishments is likely to perform worse than a chain with fewer, large establishments in terms of overall revenue. Putting this evidence together, we propose the following initial research hypothesis:
H1:For a chain, it is better, in terms of revenue, to invest in fewer large hotels
rather in more small establishments.
Bernini and Guizzardi (2010,2016) propose a novel stochastic frontier production function that specifies the mean of the inefficiency term as a function of the internal characteristics of a hotel. In particular, they use dummy variables to account for dif-ferent star categories and other exogenous variables such as the asset/revenue ratio, the percentage of days without guests and the hotel location. Jorge and Suárez (2014) include territorial dummy variables for capturing the effect of hotel locations in differ-ent Spanish regions, and they conclude that the location is quite significant. Lazzeretti et al. (2008) provide evidence that hotels tend to be concentrated in particular areas, and there is a strong connection between hotel competitiveness and destinations. Arbelo et al. (2018) suggest that hotels in resort areas are more efficient than those in urban
centers. However, the majority of Spanish destinations are seaside towns with hotels of comparable size and star rating and most large hotel chains tend to have similar profiles in the range of establishments in their portfolios, with in general, high pro-portions of establishments in these resort areas. This means that in practice, it will be difficult to discriminate between chains based on location.
Spanish hotel chains differ more in the star categories of their establishments. Some chains concentrate on cheaper, 3 star accommodation, and others opt to invest in more upmarket or boutique 4 or 5 star hotels. As commented previously, studies of individual hotels have provided mixed conclusions concerning the relationship between star rating and efficiency. However, given the standard Spanish tourist model where beach tourism is the norm, we think that it is reasonable to suggest that most tourists in these destinations will not require a very high star rating but are more interested in a comfortable hotel which is close to the beach and only require the standard facilities as given by most, three star hotels. In 2014, 86.5% of the international tourists who visited Spain came for leisure and holiday activities. The three countries that contributed most tourists were the United Kingdom, with 15 million visitors, France with 10.6 million and Germany with 10.42 million which correspond to 55.4% of the total foreign tourists visiting Spain in this year. These tourists had a preference for low cost, sun, sea and sand-based vacations. The average expenditure of German, British and French tourists was 962 euros, 849 and 617 euros, respectively; see Lojo (2016), for details on the characteristics of tourists visiting Spain. This would imply that it would be preferable in terms of revenue efficiency for a hotel chain to invest in more 3 star establishments rather than higher star rated hotels in coastal zones. Thus, we can formulate the following working hypothesis:
H2: There is observable efficiency heterogeneity between hotel chains and it is
disadvantageous in terms of revenue efficiency for chains to try to increase their proportions of higher (4 and 5 star) rated hotels.
In contrast to the results on hotel performance, several studies find no relation in terms of efficiency between individual hotels of different sizes; see Hwang and Chang (2003), Wang et al. (2006) and Sanjeev (2007). Examining Portuguese hotel chains via DEA, Barros et al. (2011) suggest that there is no clear relationship between chain size and managerial efficiency in this case. Exceptions are Poldrugovac et al. (2016) who find a difference in efficiency between small- and medium-sized hotels, although this difference disappears when these are compared with larger establishments and Such-Devesa and Peñalver (2013) who use the DEA approach to find that in the Spanish context, larger hotels have greater technical efficiency than smaller establishments. In the Spanish context, Arbelo et al. (2018) find that larger hotels show more profit efficiency and suggest that part of this is due to increased economies of scale leading to reductions in costs. They also suggest that chain hotels are more profit efficient than independent hotels.
For the Spanish hotel chains examined in our article, all chains have various hotels with over one thousand one hundred rooms and it has been observed that operational revenue increases proportionally with the size of the chain, as measured by either the number of rooms, establishments or employees. Therefore, when this revenue is
normalized by a measure of chain size, it appears reasonable to hypothesize that there is no relationship between revenue efficiency and hotel chain size, that is:
H3:The size of the chain does not influence the efficiency.
6 Spanish hotel chains: a case study
The data that we analyze in this article correspond to the year 2014 and have been collected from the system for library automation (SABI) database. The sample consists of forty-four Spanish hotel chains, each with at least one thousand one hundred and eighty rooms in total. The total sizes of the chains we consider vary considerably. The biggest chain in our study is Meliá with 139 hotels and a total of 5541 employees, while the smallest chain is Dreamplace Hotels and Resorts with 4 hotels and 249 employees.
Combining the hotels in all of the chains studied, there are seven hundred and eighty-seven individual hotels. Of these, there are four one star hotels, twenty two star hotel, two hundred and forty three star hotels, four hundred and sixty five four star hotels and fifty-six five star hotels.
As well as the information available from SABI, we also use other sources, such as HOSTELTUR1in order to find the average number of rooms available in each hotel chain, as well as the individual Web sites of each hotel chain in order to calculate the average room prices of the different chains andBooking.com2to find the proportion of hotels with golf facilities and the proportion of beach hotels in each chain. Finally, we calculate the proportion of hotels close to airports using Google Maps3.
6.1 Variable selection
In this article, we propose using the total operating revenue of each chain (O.R) as the basic output variable. The available input variables to the frontier are average room price (P.R), the average price of food price (P.F), the total number of rooms (N.R), total assets (T.A), material expenses (M.E), employee expenses (EM.E), number of employees (N.EM), financial expenses (F.E), funds (F), cash flow (C.F), operating expenditure (O.E) and number of establishments (N.ES).
A variety of different variables have been considered as possibly influencing hotel efficiency in the literature. Here, we follow Oliveira et al. (2013b) and consider factors that reflect the operating environment as potential exogenous variables. In particular, we use the proportion of hotels with three stars or less within each chain (Star123), the proportion of beach hotels (Beach), the proportion of golf hotels (Golf) and the proportion of hotels that are ten kilometers or less from an airport (Airport) as possible heterogeneous variables.
1 http://www.hosteltur.com/.
2 http://www.booking.com/.
Table 1 Correlation among variables
O.R. N.R T.A M.E EM.E N.EM F.E C.F O.E N.ES O.F P.R P.F
O.R. 1.00 0.96 0.94 0.93 0.99 0.98 0.89 0.72 1.00 0.89 0.93 0.41 0.26 N.R 0.96 1.00 0.92 0.84 0.97 0.95 0.89 0.67 0.96 0.93 0.88 0.37 0.21 T.A 0.94 0.92 1.00 0.85 0.95 0.87 0.99 0.81 0.93 0.76 0.95 0.33 0.23 M.E 0.93 0.84 0.85 1.00 0.91 0.91 0.79 0.70 0.92 0.77 0.88 0.29 0.17 EM.E 0.99 0.97 0.95 0.91 1.00 0.97 0.92 0.72 0.99 0.89 0.92 0.37 0.22 N.EM 0.98 0.95 0.87 0.91 0.97 1.00 0.81 0.63 0.98 0.94 0.87 0.38 0.22 F.E 0.89 0.89 0.99 0.79 0.92 0.81 1.00 0.80 0.88 0.70 0.91 0.29 0.18 C.F 0.72 0.67 0.81 0.70 0.72 0.63 0.80 1.00 0.70 0.50 0.84 0.27 0.41 O.E 1.00 0.96 0.93 0.92 0.99 0.98 0.88 0.70 1.00 0.91 0.91 0.41 0.25 N.ES 0.89 0.93 0.76 0.77 0.89 0.94 0.70 0.50 0.91 1.00 0.76 0.36 0.18 O.F 0.93 0.88 0.95 0.88 0.92 0.87 0.91 0.84 0.91 0.76 1.00 0.32 0.26 P.R 0.41 0.37 0.33 0.29 0.37 0.38 0.29 0.27 0.41 0.36 0.32 1.00 0.78 P.F 0.26 0.21 0.23 0.17 0.22 0.22 0.18 0.41 0.25 0.18 0.26 0.78 1.00
Fig. 1 Relationship between total operating revenue and chain size as measured by number of rooms (N.R.), establishments (N.ES.) and employees (N.EM.), respectively
6.2 Exploratory data analysis
Before formally defining the SFA models that we consider in this paper, we first perform some simple data analyses in order to illustrate some of the specific problems we face in applying SFA to hotel chains as opposed to individual establishments.
Firstly, in Table1, we report the correlations between the different input and output variables. It can be observed that there are very high, positive correlations between the dependent variable, O.R, and the independent variables, number of rooms (N.R), number of employees (N.EM) and number of establishments (N.ES). Indeed, all of the variables excepting room price and food price are highly correlated.
Figure1backs this up by showing regression plots of operating revenue against these variables, which suggest an approximately linear relationship in each case, espe-cially in the case of the number of employees, even though this impression may be exaggerated due to the fact that the largest three chains in our study are much bigger than the remainder of the chains. The underlying explanation is that all of these vari-ables are influenced by the size of the hotel chain. We would not only expect a larger chain to have higher total revenues but also to employ more staff, have more rooms in total, have more hotels, etc.
As the hotel chains in our study vary considerably in size, if we wish to compare them in terms of revenue, it is therefore necessary to normalize both revenue and size-dependent inputs via some size measure. We choose to normalize revenue and (non-price) inputs either by the number of rooms, the number of employees or the number of establishments. Note that this first normalization, which leads to revenue per room, has been used in hotel efficiency problems to compare individual hotels of different sizes; see, e.g., Barros et al. (2010). Obviously, when these variables are used to normalize the other input and output variables, they are not then included in the resulting SFA model. This implies that when we normalize using number of rooms, for example, then we can only draw conclusions about how to optimize the number of employees or establishments given a fixed number of rooms. Similarly, when normalizing in terms of establishments, we can optimize the number of rooms or the number of employees conditional on a fixed number of establishments.
6.3 A revenue stochastic frontier model for hotel chains
According to Kumbhakar and Lovell (2003), a change in prices should not cause a change in efficiency of a firm. Therefore, revenue efficiency only depends on relative output prices. This implies that for the frontier to satisfy this restriction, both output and price input terms should be normalized. Following Oliveira et al. (2013b), we normalize by dividing operational revenue and room price by food price. This leads to the following SFA model for hotel chain revenues:
ln O.Ri siP.Fi =β0+ n βn ln xni si +βn+1 lnP.Ri P.Fi +vi− ui, (7)
wheresi ∈ {N.Ri,N.EMi,N.ESi}, is the size correction andxi represents the input
variables related to size for chaini.
6.4 Model and variable selection
To fully specify our models, we need to choose a distribution for the inefficiency component and to select the input variables. We consider both the half-normal and the truncated-normal distributions for the inefficiency component. Note that for a given inefficiency distribution and size normalization, we have ten potential independent variables, and consequently, 210 =1024 possible models.
As Bayesian analysis of all models is somewhat more time-consuming than the classical approach, before examining Bayesian approaches, we first fit all possible model specifications via maximum likelihood using theR frontierpackage.
Table2reports the rankings of the optimal models selected by the AIC and BIC. It can be observed that the AIC and BIC values are very similar under both the half-normal and truncated-half-normal inefficiency distributions although slightly preferring the simpler, half-normal model. To discriminate between the two, we also perform a likelihood ratio test whose statistic is:
Table 2 Model selection using AIC and BIC
Model number Half-normal Truncated normal Test
Ranking by AIC
AIC BIC Ranking
by AIC AIC BIC τ Normalized by N.R 751 1 38.965 56.807 1 40.861 60.027 0.104 744 2 39.866 57.708 2 41.866 60.487 0.000 759 3 39.930 57.772 3 41.930 60.914 0.000 Normalized by N.ES 717 1 36.000 50.273 1 38.000 54.057 0.000 733 2 36.973 53.031 2 38.862 55.345 0.111 973 3 37.894 53.952 3 39.894 56.565 0.000 Normalized by N.EM 749 1 36.973 53.031 1 38.862 56.704 0.111 765 2 38.343 56.185 3 40.186 58.220 0.157 751 3 38.355 56.197 2 40.150 57.537 0.205
Table 3 Top models under different size normalizations
τ = −2 ln L(βHN)
L(βNT) ∼χ
2 1.
The values of theτ statistic are shown in the last column of Table2. In all cases, the value ofτ is less than the 95th percentile of theχ12, which implies that there is no evidence to reject the half-normal distribution. Therefore, in all future analyses in this paper, we assume that the efficiency term is modeled with a half-normal distribution throughout.
Table3shows the independent variables that are included in the top three mod-els under each size normalization, together with the signs of the coefficients that are associated with each variable. The results are very consistent in terms of the selected variables: The selection criterion always chooses those models that include as input variables material expenses (M.E), employee expenses (EM.E), cash flow (C.F), operating expenses (O.E) and price of room divided by price of food (P.R/P.F) as independent variables. Under all three normalizations considered, the regression coefficients of these variables are positively estimated. This is as to be expected. In the first place, if a chain spends more in terms of inputs (M.E, EM.E and O.E), it is invest-ing in a higher-quality product and should expect to obtain higher revenues. Similarly,
low or negative cash flows indicate problems of liquidity of a company which imply that they will have fewer resources for investment. In such cases, we would expect that client numbers decrease over the medium term as quality deteriorates.
As expected, the coefficient of the price per room and price for food ratio is positive, that is, if price per room increases relatively more than the food price, then so does revenue. Also, this suggests that, if food is expensive compared to room prices, then tourists may decide that it is not worth paying the extra for food inside a hotel and may prefer instead to eat out. Note that the majority of Spanish resorts have many restaurants and bars oriented to the tourist market and with a high level of competi-tion.
It is important to observe that (when it is not used as a normalizing factor), the number of establishments appears with a negative coefficient in the frontier function of the top models. Therefore, for a given number of rooms (or employees) this implies that it is optimal for a chain to invest in fewer, larger hotels rather than several smaller establishments. This result confirms hypothesisH1.
6.5 SFA with heterogeneity
In the previous analysis, we have not included any of the exogenous variables com-mented at the end of Sect.6.1in the SFA models specified in (7).
In their analyses, Oliveira et al. (2013b) include these exogenous variables in the frontier function. However, following, e.g., Greene (2008) and Coelli (2005), it is an open question whether it is better to include these variables in the frontier or in the inefficiency parameters. In this article, we take the second approach. Including these variables in the scale parameter of a half-normal inefficiency distribution as we do here implies that inefficiency possesses the scaling property; see, e.g., Wang and Schmidt (2002). This property has a number of modeling advantages, such as the fact that firm heterogeneity simply inflates or deflates the efficiency distribution without changing its shape, as outlined in, e.g., Alvarez et al. (2006) and Greene (2008).
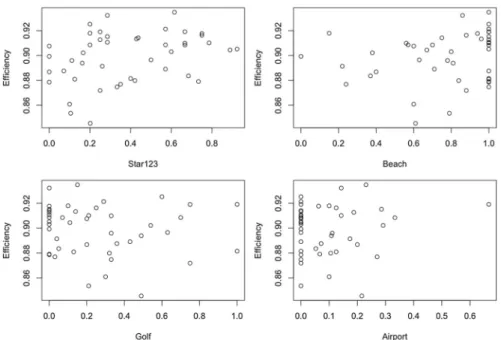
In order to select the relevant exogenous variables, Fig.2shows scatter plots of the efficiency estimates of the different firms against the possible heterogeneity factors using number of rooms as the size normalization. It can be seen that there is a slight positive relationship between the proportion of hotels in the three star or lower category (Star123) and the efficiency rankings and possibly, although to a much lesser extent if at all, in the case of the proportion of beach hotels (Beach). There is no real evidence of a relationship between estimated efficiency and the proportions of hotels with golf or hotels close (less than 10 km) to an airport. Therefore, we consider models that include either the proportion of beach hotels or the proportion of hotels of three or fewer stars as variables influencing the inefficiency term.
In order to include heterogeneity in the SFA model of (7), we now introduce a log-linear model for the scale parameter of the inefficiency as follows:
ui ∼N+
0, σui2
Fig. 2 Scatter plots showing the relation between the estimated efficiency and the exogenous variables: proportion of beach hotels (Beach), proportion of hotels with 3 stars or fewer (Star123), proportion of hotels with golf facilities (Golf) and proportion of hotels less than 10km from an airport
We also consider all different possible sub-models of this complete specification. For example, the basic model of (7) corresponds to the case γ1 = γ2 = 0 and the sub-model containing just the proportion of beach hotels as a heterogeneity variable corresponds toγ2=0.
6.5.1 Bayesian estimation
Unfortunately, it is not straightforward to fit the SFA model including heterogeneity using the classical approach, and therefore, we adopt a Bayesian framework in this section.
In order to compare the Bayesian approach with the classical results, we first run the top three models under the half-normal inefficiency specification as illustrated in Table2without considering heterogeneity, but now using Bayesian inference. In all cases, relatively weak, normal priors are used for the regression coefficients, an inverse gamma prior is applied for the variance of the idiosyncratic error and an inverse gamma prior is used for the inefficiency scale parameter. In this last case, the prior is designed so that the prior mean efficiency estimate is close to the estimated, average efficiency under the classical approach.
Under this specification, the results of the Bayesian analysis are very similar to those of the classical analysis. For example, when Kendall’s rank correlation measure is used to compare the Bayesian mean efficiency rankings and classical efficiency rankings of the different chains, correlations of at least 0.9 are achieved in all models
and in the majority of cases, there is an almost linear relationship between the estimated efficiency rankings.
We also fit the models including heterogeneity as described in Sect.6.5, again with diffuse normal priors for the coefficientsγ0, γ1, γ2.
Table4shows the value of the DIC3 criterion for the best three models of Table
2, but now also including the different combinations of exogenous variables in the inefficiency as in (8).
We can see that, excepting the case of normalization via N.EM, when the orders of the second and third models are reversed, the rankings selected by the AIC and DIC3 for the models without heterogeneity are consistent. This consistency in model selection does not appear to be altered by the inclusion of heterogeneity variables. Thus, in the case of normalization by number of rooms, model 751 is more popular than model 744 or model 759, whichever set of exogenous variables are included.
Furthermore, under each basic model, the DIC3 of the sub-model considering the percentage of hotels of three or fewer stars always outperforms the other models. This suggests that this is an important influencing factor in hotel chain efficiency in line with the hypothesisH2.
In contrast to the case of star ratings, surprisingly, including the proportion of beach hotels does not appear to improve upon the basic model as the DIC3 values in this case are virtually identical. A reasonable explanation for this, as can be observed in Fig.2, may be that apart from a very few chains, the great majority of chains in our study have high proportions of 60% or more beach hotels in their portfolios. Thus, given the similarity of the chains under this criterion, it is difficult to use it to discriminate between them.
Table5shows the posterior mean parameter estimates under the best models under each normalization, selected using the DIC3 criterion. These models are model 751 when normalizing by number of rooms, model 733 when normalizing by number of establishments and model 749 when normalizing by number of employees. In each case, we have used the proportion of hotels with three or fewer stars as the heterogeneity variable. It can be observed that the signs of the estimated coefficients are the same as in Table3under all normalizations, which suggests that the results are fairly robust to the inclusion of the heterogeneity variable. Thus, for example, we can see that, as previously suggested, for a fixed number of staff or a fixed number of rooms, relative revenue increases when a hotel chain invests in a small number of larger hotels as opposed to a larger number of small hotels, again in confirmation of hypothesisH1.
Secondly, it is interesting to observe the negative coefficient for the proportion of hotels of three or fewer stars. This has important implications for hotel chain managers, suggesting that it is not advantageous, in the Spanish context, in terms of revenue efficiency, for a hotel chain to undertake the extra work and costs required to gain more four star ratings for their hotels and confirming our hypothesisH2. This may be
due to the Spanish sun and sand model of tourism where clients may just require a comfortable place to stay near the beach but are not necessarily interested in paying the extra premium required for higher-rated hotels. This result contrasts a little with the findings of Oliveira et al. (2013b) who found that, for the Algarve region, revenue is higher for five star hotels than for four star hotels in general. However, in this paper, these variables are included in the frontier and not in the inefficiency. Observe also
Table 4 Comparing D IC3 under d if ferent size normalizations Model number Ranking AIC Exogenous variables DIC3 Ranking DIC3 Model number Ranking AIC Exogenous variables DIC3 Ranking DIC3 Model number Ranking AIC Exogenous variables DIC3 Ranking DIC3 Normalized by N.R Normalized by N.ES N ormalized by N.EM 751 1 B oth factors 83.0324 5 717 1 B oth factors 81.5644 5 749 1 B oth factors 82.1886 4 Star123 81.7669 1 S tar123 81.0300 2 S tar123 80.3991 1 Beach 82.6710 3 B each 81.2040 3 B each 82.3284 5 W ithout factor 82.9677 4 W ithout factor 81.2367 4 W ithout factor 81.8743 3 744 2 B oth factors 84.4288 11 733 2 B oth factors 82.8526 11 765 2 B oth factors 85.8080 11 Star123 82.5417 2 S tar123 80.0405 1 S tar123 82.4448 6 Beach 83.3069 6 B each 82.7235 9 B each 86.6276 1 2 W ithout factor 83.4305 7 W ithout factor 82.1156 6 W ithout factor 85.2321 10 759 3 B oth factors 84.6053 12 973 3 B oth factors 82.9188 12 751 3 B oth factors 82.6560 7 Star123 83.8011 8 S tar123 82.2893 7 S tar123 80.8058 2 Beach 84.2521 10 Beach 82.7439 10 Beach 84.5361 9 W ithout factor 84.2224 9 W ithout factor 82.5983 8 W ithout factor 83.5665 8
Table 5 Estimation results of the best models under different normalizations
Normalized by N.R Normalized by N.ES Normalized by N.EM
Estimate SD Estimate SD Estimate SD
ˆ β0 −3.867 1.285 −3.833 1.153 −3.807 1.163 ˆ β1(M.E) 0.200 0.074 0.201 0.073 0.200 0.073 ˆ β2(EM.E) 0.535 0.306 0.570 0.294 0.564 0.293 ˆ β3(N.EM) −0.278 0.279 −0.304 0.271 – – ˆ β4(C.F) 0.077 0.036 0.074 0.037 0.075 0.036 ˆ β5(O.E) 0.366 0.170 0.367 0.169 0.366 0.172 ˆ β6(N.ES) −1.001 0.201 – – −0.973 0.148 ˆ β7(P.R/P.F) 1.072 0.127 1.066 0.128 1.068 0.129 ˆ γ0 −10.742 9.075 −10.839 9.021 −10.975 9.211 ˆ γ2(Star123) −15.831 9.968 −11.013 5.680 −12.461 6.754
that the great majority of the hotels in the Spanish chains considered in our analysis belong to the three and four star categories. Note also that our analysis considers the year 2014 toward the end of the Spanish and European economic crisis, when it may be that customers preferred to pay less for a three star hotel experience than invest more in a four star hotel.
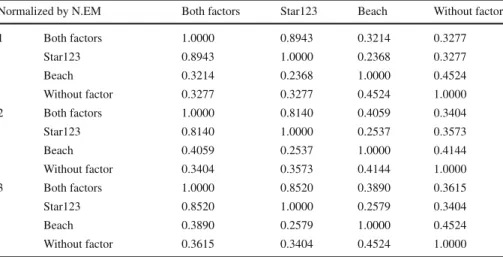
It is also interesting to explore whether including exogenous variables in the ineffi-ciency term changes the relative rankings of the different hotel chains. In Table6, we show the rank correlations of the efficiencies under the top three models previously selected by the AIC criterion and analyzed under all combinations of factors when normalizing by the number of employees. We observe a high correlation between rankings obtained with models with both factors and the model with the percentage of hotels with three or fewer stars. The rankings without including this factor and rankings including Star123 are much lower correlated, indicating that the inclusion of this variable does cause a substantial change in efficiency rankings.
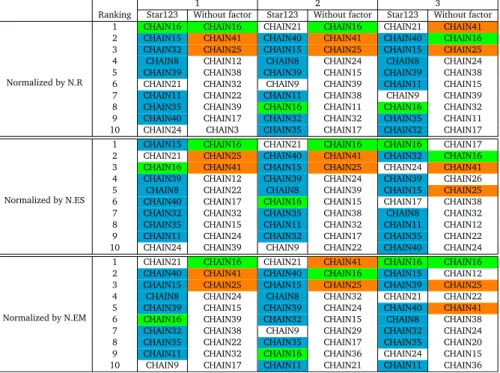
This is further illustrated in Table7which gives the top ten ranked chains under each model specification. Columns “1”, “2”, “3” correspond to the best three models classified by the AIC criterion.
The green cells represent chain 16 which is the only chain that remains in the top ten under all models and normalizations, with and without the inclusion of heterogeneity in the inefficiency term.
The orange cells indicate the top ten ranked chains (24, 25, 38 and 41) under all three models and normalizations when inefficiency heterogeneity is not considered. The top three positions are always occupied by the same three chains (16 in first position and 25 or 41 in second or third positions). However, only half of the top ten chains remain constant under all different model specifications which implies some instability in the rankings when inefficiency heterogeneity is not accounted for.
Finally, the blue cells indicate the high ranked chains (8, 11, 15, 21, 32, 35, 39 and 40) in all cases when inefficiency heterogeneity is included. Few of the best chains
Table 6 Kendall correlations for efficiency rankings under size normalization N.EM
Normalized by N.EM Both factors Star123 Beach Without factor
1 Both factors 1.0000 0.8943 0.3214 0.3277 Star123 0.8943 1.0000 0.2368 0.3277 Beach 0.3214 0.2368 1.0000 0.4524 Without factor 0.3277 0.3277 0.4524 1.0000 2 Both factors 1.0000 0.8140 0.4059 0.3404 Star123 0.8140 1.0000 0.2537 0.3573 Beach 0.4059 0.2537 1.0000 0.4144 Without factor 0.3404 0.3573 0.4144 1.0000 3 Both factors 1.0000 0.8520 0.3890 0.3615 Star123 0.8520 1.0000 0.2579 0.3404 Beach 0.3890 0.2579 1.0000 0.4524 Without factor 0.3615 0.3404 0.4524 1.0000
Table 7 Rankings of the top ten most efficient hotel chains under the three best models and different size normalizations
Green=top ranking chains under all models and size normalizations with and without the inclusion of exogenous variables. Orange=top ranking chains when exogenous variables are not included. Blue=top ranking chains when exogenous variables are included
under the basic model maintain their positions when taking into account the exogenous variable. It is important to observe the consistency of the rankings in this last case. Nine out of the ten top ranked chains (including chain 16) are the same under all models and normalizations. Furthermore, in all cases but one (when it is ranked second), chain 21 occupies the first ranking position while chain 40 occupies the second ranking position in seven out of nine cases (and in the remaining two is ranked first and fifth). It is also
Fig. 3 Relationship between efficiency and number of employees
important to note that chain 16, which is ranked first among all chains in all models without the inclusion of inefficiency heterogeneity is lower ranked when inefficiency heterogeneity is included. Chains 25 and 40 also disappear from the top rankings when inefficiency heterogeneity is accounted for, which suggests that their initial high rankings may be an unreliable representation of their true level of efficiency. 6.5.2 The (lack of) relationship between efficiency and hotel chain size
In analyzing individual hotel efficiencies, a number of works have encountered a relationship between hotel size and efficiency. For example, Davutyan (2007) and Pol-drugovac et al. (2016) observe an increasing relationship between the size of individual hotels and their efficiency in the case of Anatolian and Croatian hotels, respectively. Conversely, Pulina et al. (2010) find that medium-size hotels are more technically efficient than either small or large hotels in a DEA analysis of the Italian hospitality sector. In the case of chains, it might be expected that bigger chains can take advantage of economies of scale to reduce overall costs. On the contrary, it may be that smaller chains can only survive in a competitive market if they are efficient, whereas larger chains can continue to operate at lower efficiency levels due to having higher reserves, easier access to financial credit, etc.
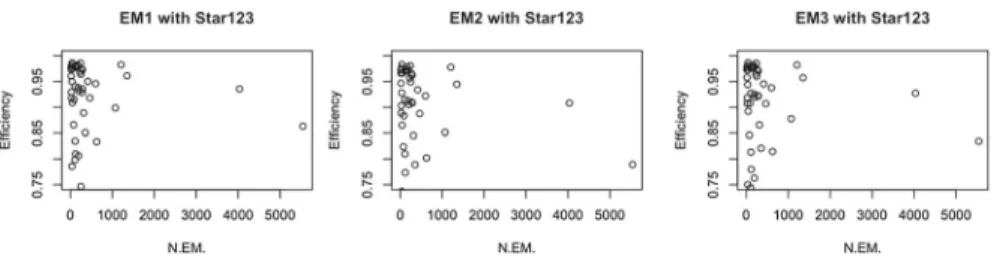
Figure 3 shows the posterior mean efficiency levels under the Bayesian model including the percentage of hotels of three or fewer stars as an exogenous variable, versus the size of hotel chains when revenues are normalized by number of employees as a size measure.
In line with our hypothesis H3, there is no obvious relationship between the size
of a hotel chain (as measured by number of employees) and efficiency, but this could be a consequence of the fact that the two largest hotel chains are over twice as big (in terms of number of employees) than the rest of the chains in the study. Thus, it could be that these chains behave differently in terms of their efficiencies than chains of more similar sizes. Therefore, it is interesting to exclude these two chains from the analysis in order to explore the relationship between size and efficiency more clearly. Table 8 shows the top ten ranked chains under a Bayesian analysis, both with and without the inclusion of the proportion of hotels of three and fewer stars as a heterogeneity factor, and under different normalizations in the same way as Table
7. The top ranked chains remain similar to those in Table7. Note that chain 21 is still top ranked in five out of nine cases when inefficiency heterogeneity is included although it falls out of the top ten under one of the model structures. This suggests
Table 8 Rankings of the top ten most efficient hotel chains under the three best models and different size normalizations when the two largest chains are excluded
Green=top ranking chains under all models and size normalizations with and without the inclusion of exogenous variables. Orange=top ranking chains when exogenous variables are not included. Blue=top ranking chains when exogenous variables are included
that the inclusion of the two biggest chains does not overly influence the results of the analysis.
Therefore, there is no clear evidence of a relation between chain size and efficiency here, confirming hypothesisH3.
7 Conclusions and policy implications
In this paper, we have measured the revenue efficiency of hotel chains in Spain in the year 2014. In order to compare chains of very different sizes, we have proposed to use a normalization by either number of hotels, number of rooms or number of employees. Using both classical and Bayesian analyses, our results give a number of important insights for hotel chain managers. Firstly, in terms of overall revenue, it is preferable for chains to invest in fewer, big hotels than in a higher number of smaller establishments. We have also shown that it is important to take exogenous information into account when this is available as this can be very influential in efficiency estimates. Our results contrast with those of Oliveira et al. (2013a), where it is found that in the case of individual hotels in the Portuguese region of the Algarve, efficiency is influenced by
the presence of golf courses and is not clearly affected by star ratings. The Algarve is recognized as a high end tourist destination where clients require very good quality accommodation and facilities. Golf tourism in Algarve is integrated with beach tourism and gives the Algarve region an additional international projection. This type of tourism depends on the north and central Europe markets where there are a large amount of golf courses and players. It represents an important diversification of tourism products crucial for the sustainability perspective of tourism and for less dependence on certain markets; see, e.g, Pedro (2006) and Completo and Gustavo (2014).
For large Spanish hotel chains however, it appears that the ownership of golf courses has little influence on a chains revenue efficiency, whereas it is better to concentrate on three star (and lower) rather than four star (and higher) hotel categories. In contrast to the Algarve, the Spanish tourist model has tended toward cheaper, mass tourism (less than 10% of the hotels run by the chains in our study have 5 stars) where extras such as golf are not so much in demand, and this may be a cause of these apparently contradictory findings. This suggests that Spanish hotel chains with a high proportion of hotels with golf courses are not exploiting these resources adequately. Golf facilities might be used to reduce the dependence on beach tourism. For example, chains could promote golf facilities in the winter season by offering full packages with accom-modation and golf fees, and advertising in northern European tourism channels. In a similar way, chains with a high proportion of luxury hotels should explore ways to attract international and national tourists by promoting the extras they offer such as spas, gastronomy, etc., in the low season.
Also, in contrast to the results of Poldrugovac et al. (2016) for individual hotels, when hotel chains are considered, there appears to be little relationship between chain size and revenue efficiency. As we observed previously, for the case of large Spanish hotel chains, total operational revenue appears to be proportional to the size of the chain, so that revenue per room, etc., is not greatly influenced by chain size in general. Therefore, as we might expect, revenue (per room, etc.) efficiency is also independent of chain size.
Finally, rural and winter tourism is a growing area in Spain, but less developed than in it’s European neighbors; see Perales (2002), Barke (2004) and Cánoves et al. (2004). Indeed, most of the chains in our study have very few, if any, establishments based in the countryside or in winter resort areas. This means that it would be very difficult to try and draw conclusions concerning this type of tourism, which is typically a very different market to that attracted by beach hotels. An interesting extension of the study would be to include smaller chains of hotels concentrating on this sector in order to see if our conclusions still hold true.
Acknowledgements The authors acknowledge financial support from the Spanish Ministry of Economy and Competitiveness, research projects ECO2015-66593-P, ECO2015-70331-C2-2-R, ECO2015-65701-P and Fundação para a Ciência e Tecnologia grant UID/GES/00315/2013. The authors thank two anonymous referees and the Associate Editor for useful comments on an earlier version of this manuscript.
Compliance with ethical standards
Informed consent We declare no ethical issues or issues needing informed consent.
Open Access This article is distributed under the terms of the Creative Commons Attribution 4.0 Interna-tional License (http://creativecommons.org/licenses/by/4.0/), which permits unrestricted use, distribution, and reproduction in any medium, provided you give appropriate credit to the original author(s) and the source, provide a link to the Creative Commons license, and indicate if changes were made.
References
Abrate G, Capriello A, Fraquelli G (2011) When quality signals talk: evidence from the Turin hotel industry. Tour Manag 32(4):912–921
Aguiló E, Alegre J, Sard M (2005) The persistence of the sun and sand tourism model. Tour Manag 26:219– 231
Alvarez A, Amsler C, Orea L, Schmidt P (2006) Interpreting and testing the scaling property in models where inefficiency depends on firm characteristics. J Prod Anal 25(3):201–212
Anderson RI, Fish M, Xia Y, Michello F (1999) Measuring efficiency in the hotel industry: a stochastic frontier approach. Int J Hosp Manag 18(1):45–57
Arbelo A, Arbelo-Pérez M, Pérez-Gómez P (2018) Estimation of profit efficiency in the hotel industry using a Bayesian stochastic frontier model. Cornell Hosp Q 59:364–375
Arbelo-Pérez M, Arbelo A, Pérez-Gómez P (2017) Impact of quality on estimations of hotel efficiency. Tour Manag 61:200–208
Assaf AG (2012) Benchmarking the Asia Pacific tourism industry: a Bayesian combination of DEA and stochastic frontier. Tour Manag 33(5):1122–1127
Assaf AG, Barros CP (2013) A global benchmarking of the hotel industry. Tour Econ 19(4):811–821 Assaf AG, Josiassen A (2016) Frontier analysis: a state-of-the-art review and meta-analysis. J Travel Res
55(5):612–627
Assaf AG, Magnini V (2012) Accounting for customer satisfaction in measuring hotel efficiency: evidence from the US hotel industry. Int J Hosp Manag 31(3):642–647
Assaf A, Barros CP, Josiassen A (2012) Hotel efficiency: a bootstrapped metafrontier approach. Int J Hosp Manag 31:621–629
Babayan N, Canós-Darós L, Santandreu-Mascarell C (2014) Financial performance of spanish hotels during the crisis. WPOM—working papers on operations management, vol 5, No 1. pp 15–30
Baker M, Riley M (1994) New perspectives on productivity in hotels: some advances and new directions. Int J Hosp Manag 13(4):297–311
Banker RD, Gadh VM, Gorr WL (1993) A Monte Carlo comparison of two production frontier estimation methods: corrected ordinary least squares and data envelopment analysis. Eur J Oper Res 67(3):332– 343
Barke M (2004) Rural tourism in Spain. Int J Tour Res 6:137–149
Barros CP (2004) A stochastic cost frontier in the Portuguese hotel industry. Tour Econ 10(2):177–192 Barros CP (2005) Evaluating the efficiency of a small hotel chain with a Malmquist productivity index. Int
J Tour Res 7(3):173–184
Barros CP, Dieke PU, Santos CM (2010) Heterogeneous technical efficiency of hotels in Luanda, Angola. Tour Econ 16(1):137–151
Barros C, Botti L, Peypoch N, Solondrosana B (2011) Managerial efficiency and hospitality industry: the Portuguese case. Appl Econ 43(22):2895–2905
Barsky JD, Labagh R (1992) A strategy for customer satisfaction. Cornell Hotel Restaur Adm Q 33(5):32–40 Becerra M, Santaló J, Silva R (2013) Being better vs. being different: differentiation, competition, and
pricing strategies in the Spanish hotel industry. Tour Manag 34:71–79 Behr A (2015) Production and efficiency analysis with R. Springer, Berlin
Bernini C, Guizzardi A (2010) Internal and locational factors affecting hotel industry efficiency: evidence from Italian business corporations. Tour Econ 16(4):883–913
Bernini C, Guizzardi A (2016) Internal features and agglomeration externalities for the hotels’ competi-tiveness in Emilia-Romagna. Palgrave Macmillan, New York
Bifulco R, Bretschneider S (2001) Estimating school efficiency: a comparison of methods using simulated data. Econ Educ Rev 20(5):417–429
Brown J, Ragsdale C (2002) The competitive market efficiency of hotel brands: an application of data envelopment analysis. J Hosp Tour Res 26(4):332–360
Cánoves G, Montserrat V, Pristley GK, Blanco A (2004) Rural tourism in Spain: an analysis of recent evolution. Geoforum 35:755–769
Caudill SB, Ford JM (1993) Biases in frontier estimation due to heteroscedasticity. Econ Lett 41(1):17–20 Caudill SB, Ford JM, Gropper DM (1995) Frontier estimation and firm-specific inefficiency measures in
the presence of heteroscedasticity. J Bus Econ Stat 13(1):105–111
Celeux G, Forbes F, Robert CP, Titterington DM (2006) Deviance information criteria for missing data models. Bayesian Anal 1(4):651–673
Chen C-F (2007) Applying the stochastic frontier approach to measure hotel managerial efficiency in Taiwan. Tour Manag 28(3):696–702
Chu RK, Choi T (2000) An importance-performance analysis of hotel selection factors in the Hong Kong hotel industry: a comparison of business and leisure travellers. Tour Manag 21(4):363–377 Claver A, Pereira J, Molina J (2007) Imapcto del tamaño, el tipo de gestión y la categoría sobre el desempeño
de los hoteles españoles. Cuad Tur 19:27–45
Claver A, Pereira J, Molina J (2007) The impact of strategic behaviours on hotel performance. Int J Contemp Hosp Manag 19(1):6–20
Coelli TJ (2005) An introduction to efficiency and productivity analysis, 2nd edn. Springer, Berlin Coelli T, Henningsen A(2013) Frontier: Stochastic frontier analysis. R package version 1.1-0
Completo F, Gustavo N (2014) Golf tourism destination management: looking for a sustainable demand: the case of Portugal. J Manang Sustain 4(1):1925–4733
Davutyan N (2007) Measuring the quality of hospitality at Antalya. Int J Tour Res 9:51–57
Ferreira JJ, ao CE, Cruz R, Ratten V (2017) Contemporary approaches to performance evaluation of inter-national hotel groups in Portugal. J Global Bus Adv 11:173–192
Galán JE, Veiga H, Wiper MP (2014) Bayesian estimation of inefficiency heterogeneity in stochastic frontier models. J Prod Anal 42(1):85–101
Greene WH (2005) Reconsidering heterogeneity in panel data estimators of the stochastic frontier model. J Econom. 126(2):269–303
Greene EH (2008) The econometric approach to efficiency analysis. The measurement of productive effi-ciency and productivity growth, Chapter 2. Oxford University Press, Oxford, pp 92–250
Griffin JE, Steel MFJ (2007) Bayesian stochastic frontier analysis using WinBUGS. J Prod Anal 27(3):163– 176
Honma S, Hu J-L (2012) Analyzing Japanese hotel efficiency. Tour Hosp Res 12(3):155–167
Hu J-L, Chiu C-N, Shieh H-S, Huang C-H (2010) A stochastic cost efficiency analysis of international tourist hotels in Taiwan. Int J Hosp Manag 29(1):99–107
Hwang S-N, Chang T-Y (2003) Using data envelopment analysis to measure hotel managerial efficiency change in Taiwan. Tour Manag 24(4):357–369
Johns N, Howcroft B, Drake L (1997) The use of data envelopment analysis to monitor hotel productivity. Prog Tour Hosp Res 3(2):119–127
Jorge JD, Suárez C (2014) Productivity, efficiency and its determinant factors in hotels. Serv Ind J 34(4):354– 372
Kim WG, Cho M, Brymer RA (2013) Determinants affecting comprehensive property-level hotel perfor-mance: the moderating role of hotel type. Int J Hosp Manag 34(Supplement C):404–412
Koopmans TC (1951) An analysis of production as an efficient combination of activities, activity analysis of production and allocation. In: Koopmans TC (ed) Proceedings of a conference activity analysis of production and allocation. Wiley, London, pp 33–97
Kumbhakar SC, Lovell CK (2003) Stochastic frontier analysis. Cambridge University Press, Cambridge Kumbhakar SC, Park B, Simar L, Tsionas EG (2007) Nonparametric stochastic frontiers: a local maximum
likelihood approach. J Econom 137(1):1–27
Lazzeretti L, Boix R, Capone F (2008) Do creative industries cluster? Mapping creative local production systems in Italy and Spain. Ind Innov 15(5):549–567
Lojo A (2016) Chinese tourism in Spain: an analysis of the tourism product, attractions and itineraries offered by Chinese travel agencies. Cuad Tur 37:243–268
Neves JC, Lourenço S (2009) Using data envelopment analysis to select strategies that improve the perfor-mance of hotel companies. Int J Contemp Hosp Manag 21(6):698–712
Núnez-Serrano JA, Turrión J, Velázquez FJ (2014) Are stars a good indicator of hotel quality? Assymetric information and regulatory heterogeneity in Spain. Tour Manag 42:77–87
Oliveira R, Pedro MI, Marques RC (2013) Efficiency and its determinants in Portuguese hotels in the Algarve. Tour Manag 36:641–649
Oliveira R, Pedro MI, Marques RC (2013) Efficiency performance of the Algarve hotels using a revenue function. Int J Hosp Manag 35:59–67
Pedro A (2006) Chapter 10—urbanization and second-home tourism. In: Buhalis D, Costa C (eds) Tourism business frontiers. Butterworth-Heinemann, Oxford, pp 85–93
Perales RMY (2002) Rural tourism in Spain. Ann Tour Res 29(4):1101–1110
Phillips PA (1999) Performance measurement systems and hotels: a new conceptual framework. Int J Hosp Manag 18(2):171–182
Phillips P, Louvieris P (2005) Performance measurement systems in tourism, hospitality, and leisure small medium-sized enterprises: a balanced scorecard perspective. J Travel Res 44(2):201–211
Poldrugovac K, Tekavcic M, Jankovic S (2016) Efficiency in the hotel industry: an empirical examination of the most influential factors. Econ Res 29(1):583–597
Pulina M, Detotto C, Paba A (2010) An investigation into the relationship between size and efficiency of the Italian hospitality sector: a window DEA approach. Eur J Oper Res 204:613–620
Reifschneider D, Stevenson R (1991) Systematic departures from the frontier: a framework for the analysis of firm inefficiency. Int Econ Rev 32:715–723
Robert C, Casella G (2013) Monte Carlo statistical methods. Springer, Berlin
Sanjeev GM (2007) Measuring efficiency of the hotel and restaurant sector: the case of India. Int J Contemp Hosp Manag 19(5):378–387
Spiegelhalter DJ, Best NG, Carlin BP, van der Linde A (2002) Bayesian measures of model complexity and fit. J R Stat Soc Ser B 64(4):583–639
Such-Devesa MJ, Peñalver LFM (2013) Research note: size, efficiency and productivity in the Spanish hotel industry—independent properties versus chain-affiliated hotels. Tour Econ 19(4):801–809 Teague J, Eilon S (1973) Productivity measurement: a brief survey. Appl. Econ. 5(2):133–145
van den Broeck J, Koop G, Osiewalski J, Steel MFJ (1994) Stochastic frontier models: a Bayesian perspec-tive. J Econom 61(2):273–303
van den Broeck J, Koop J, Osiewalski J, Steel M (1994) Stochastic frontier models: a Bayesian perspective. J Econom 61:273–303
Wang H, Schmidt P (2002) One step and two step estimation of the effects of exogenous variables on technical efficiency levels. J Prod Anal 18:129–144
Wang F-C, Hung W-T, Shang J-K (2006) Measuring pure managerial efficiency of international tourist hotels in Taiwan. Serv Ind J 26(1):59–71
Yang Y, Luo H, Law R (2014) Theoretical, empirical, and operational models in hotel location research. Int J Hosp Manag 36(Supplement C):209–220
Publisher’s Note Springer Nature remains neutral with regard to jurisdictional claims in published maps and institutional affiliations.