Air Force Institute of Technology
AFIT Scholar
Theses and Dissertations Student Graduate Works
3-26-2015
Evaluating Machine Learning Classifiers for Hybrid
Network Intrusion Detection Systems
Michael D. Rich
Follow this and additional works at:https://scholar.afit.edu/etd Part of theInformation Security Commons
This Thesis is brought to you for free and open access by the Student Graduate Works at AFIT Scholar. It has been accepted for inclusion in Theses and Dissertations by an authorized administrator of AFIT Scholar. For more information, please [email protected].
Recommended Citation
Rich, Michael D., "Evaluating Machine Learning Classifiers for Hybrid Network Intrusion Detection Systems" (2015).Theses and Dissertations. 52.
EVALUATING MACHINE LEARNING CLASSIFIERS FOR HYBRID NETWORK
INTRUSION DETECTION SYSTEMS
THESIS
Michael D. Rich, MSgt, USAF AFIT-ENG-MS-15-M-046
DEPARTMENT OF THE AIR FORCE AIR UNIVERSITY
AIR FORCE INSTITUTE OF TECHNOLOGY
Wright-Patterson Air Force Base, OhioDISTRIBUTION STATEMENT A
The views expressed in this document are those of the author and do not reflect the official policy or position of the United States Air Force, the United States Department of Defense or the United States Government. This material is declared a work of the U.S. Government and is not subject to copyright protection in the United States.
AFIT-ENG-MS-15-M-046
EVALUATING MACHINE LEARNING CLASSIFIERS FOR HYBRID NETWORK INTRUSION DETECTION SYSTEMS
THESIS
Presented to the Faculty
Department of Electrical and Computer Engineering Graduate School of Engineering and Management
Air Force Institute of Technology Air University
Air Education and Training Command in Partial Fulfillment of the Requirements for the
Degree of Master of Science in Cyber Operations
Michael D. Rich, B.S. MSgt, USAF
March 2015
DISTRIBUTION STATEMENT A
AFIT-ENG-MS-15-M-046
EVALUATING MACHINE LEARNING CLASSIFIERS FOR HYBRID NETWORK INTRUSION DETECTION SYSTEMS
THESIS
Michael D. Rich, B.S. MSgt, USAF
Committee Membership:
Robert F. Mills, PhD (Chairman) Steven K. Rogers, PhD (Member) Maj Thomas E. Dube, PhD (Member)
AFIT-ENG-MS-15-M-046
Abstract
Existing classifier evaluation methods do not fully capture the intended use of classifiers in hybrid intrusion detection systems (IDS), systems that employ machine learning alongside a signature-based IDS. This research challenges traditional classifier evaluation methods in favor of a value-focused evaluation method that incorporates evaluator-specific weights for classifier and prediction threshold selection. By allowing the evaluator to weight known and unknown threat detection by alert classification, classifier selection is optimized to evaluator values for this application. The proposed evaluation methods are applied to a Cyber Defense Exercise (CDX) dataset. Network data is processed to produce connection-level features, then labeled by correlating packet-level alerts from a signature-based IDS. Seven machine learning algorithms are evaluated using traditional methods and the value-focused method. Comparing results from the two evaluation methods, fallacies are revealed with 2 of the 5 notional weighting schemes that would lead to suboptimal classifier and prediction threshold selection when using traditional methods that do not consider evaluator values.
Acknowledgements
First and foremost, I must thank my family. My wife and daughters give me the motivation to persevere through any challenge. I do this for them, because of their relentless support, love, and encouragement.
I give a sincere thank you to my research advisor, Dr. Robert Mills, for his guidance and flexibility allowing me to research a topic of interest. I would like to thank my sponsor and committee member, Dr. Steve Rogers, for the countless discussions that extend well beyond the research presented in this thesis. I would also like to thank my committee member, Maj Thomas Dube, for his knowledge and support with the technical aspects and results analysis of my research. My time as an AFIT student has been an incredible experience because of the great mentorship received from my thesis committee, other faculty members, and students.
Lastly, I would like to thank my supervisors and leadership from previous assign-ments for guiding my career and pushing me beyond my own self-imposed limitations.
Table of Contents
Page Abstract . . . iv Acknowledgements . . . v List of Figures . . . ix List of Tables . . . xiList of Acronyms . . . xiii
I. Introduction . . . 1
1.1 Research Goals and Hypothesis . . . 3
1.2 Research Contributions . . . 4
1.3 Preview . . . 4
II. Related Research . . . 5
2.1 Chapter Overview . . . 5
2.2 Intrusion Detection Systems . . . 5
2.2.1 Snort . . . 6
2.2.2 Bro . . . 9
2.3 Intrusion Detection Methodologies . . . 12
2.3.1 Misuse Detection . . . 13
2.3.2 Anomaly-Based Detection . . . 14
2.3.3 Stateful Protocol Analysis . . . 14
2.3.4 Hybrid Detection . . . 15
2.4 Machine Learning and Intrusion Detection . . . 18
2.4.1 General Network Traffic Classification . . . 19
2.4.2 Network Threat Detection Classification . . . 20
2.5 Classifiers . . . 25
2.5.1 Bayesian Network . . . 25
2.5.2 Instance-Based Learner (IBk) . . . 26
2.5.3 Sequential Minimal Optimization (SMO) . . . 26
2.5.4 Decision Trees . . . 27
2.5.5 Artificial Neural Networks (ANNs) . . . 27
2.5.6 Boosting Algorithms . . . 28
Page III. Methodology . . . 30 3.1 Chapter Overview . . . 30 3.2 Proposed System . . . 30 3.3 Dataset Description . . . 31 3.4 Network Sensor . . . 32 3.5 Data Preprocessing . . . 36
3.5.1 Processing Network Packet Capture Data . . . 36
3.5.2 Connection-Level Threat Labeling . . . 39
3.5.3 Data Cleanup . . . 43
3.5.4 Dataset Subsets . . . 44
3.5.5 Additional Features . . . 45
3.5.6 Data Balancing . . . 45
3.5.7 Final Dataset Descriptions . . . 46
3.6 WEKA Configuration . . . 46
3.7 Experiments . . . 47
3.7.1 Classifier Performance . . . 48
3.7.2 Unknown Threat Detection . . . 49
3.8 Performance Metrics . . . 51
3.8.1 Confusion Matrix . . . 52
3.8.2 Marginal Rates . . . 52
3.8.3 Overall Rates . . . 54
3.8.4 Precision-Recall Curves . . . 56
3.8.5 Unknown Threat Detection Rate . . . 58
3.9 Value Focused Thinking (VFT) Evaluation Approach . . . 58
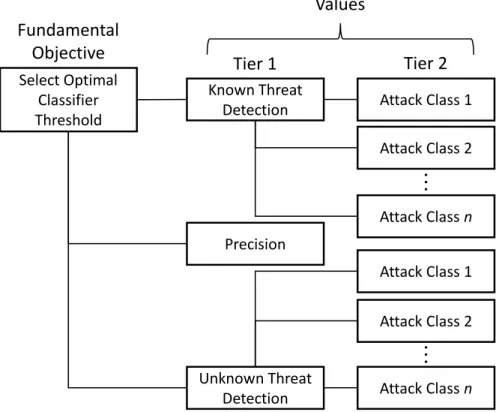
3.9.1 Applying VFT to Intrusion Detection . . . 59
3.9.2 Known Threat Detection . . . 62
3.9.3 Unknown Threat Detection . . . 63
3.9.4 Precision . . . 64
3.9.5 VFT Score Calculation . . . 65
3.10 Summary . . . 66
IV. Results and Analysis . . . 67
4.1 Chapter Overview . . . 67
4.2 Classification Results by Dataset . . . 67
4.2.1 All Network Data . . . 68
4.2.2 TCP Data . . . 70
4.2.3 HTTP Data . . . 73
4.2.4 HTTP Data with Additional Features . . . 75
4.3 Value Focused Thinking Evaluation Results . . . 78
4.3.1 PR Curves by Alert Class . . . 79
4.3.2 Scenario 1 - Balanced . . . 81
Page
4.3.4 Scenario 3 - Detect Unknown Threats . . . 86
4.3.5 Scenario 4 - Confirm Known Threats . . . 88
4.3.6 Scenario 5 - High Precision . . . 90
4.3.7 VFT Results Summary . . . 92 4.4 Summary . . . 93 V. Conclusion . . . 96 5.1 Chapter Overview . . . 96 5.2 Conclusions of Research . . . 96 5.3 Research Contributions . . . 97
5.4 Recommendations for Future Research . . . 98
Appendix A. Default Snort Alert Classifications . . . 99
Appendix B. Network Sensor Configuration . . . 101
Appendix C. WEKA Commands and Options . . . 105
Appendix D. Confusion Matrices . . . 109
List of Figures
Figure Page
2.1. Snort Architecture and Data Flow . . . 7
2.2. Example Snort Rule . . . 8
2.3. Structure of Bro System [34] . . . 10
2.4. Anomaly-Misuse Detection System Workflow [16, 44] . . . 16
2.5. Misuse-Anomaly Detection System Workflow [16, 49] . . . 17
2.6. Parallel Detection System Workflow [16] . . . 18
3.1. Proposed System Architecture . . . 31
3.2. CDX Network Architecture [32] . . . 33
3.3. Example tcpreplay Output . . . 36
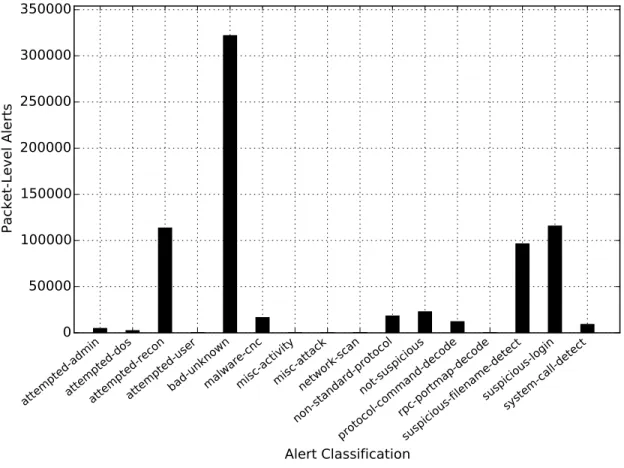
3.4. CDX Data Packet-Level Alert Classification Metrics . . . 37
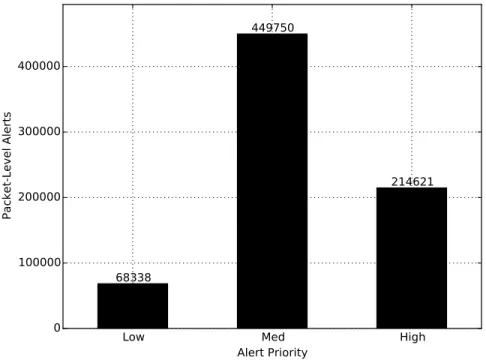
3.5. CDX Data Packet-Level Alert Priority Metrics . . . 38
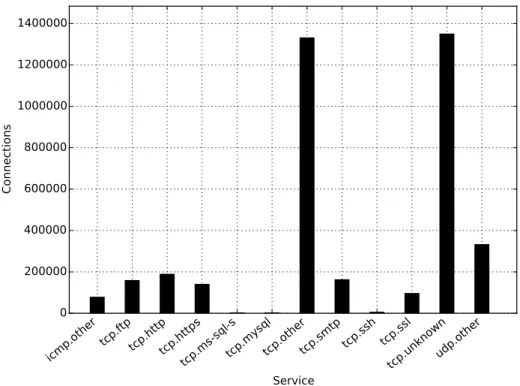
3.6. CDX Data Connections by Service . . . 39
3.7. Alert Dictionary Algorithm . . . 40
3.8. Connection-Alert Correlation and Labeling Algorithm . . . 41
3.9. CDX Data Connection-Level Threats by Service . . . 43
3.10. Unknown Threat Dataset Creation Algorithm . . . 50
3.11. Comparing Algorithms in ROC vs PR Space [14] . . . 57
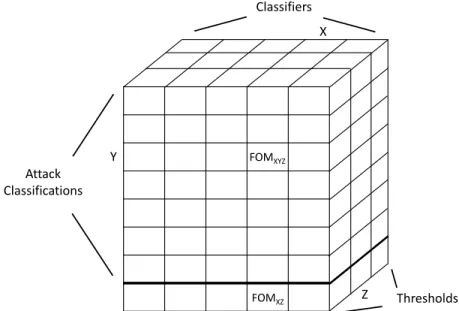
3.12. Calculating Figures of Merit (adapted from [27]) . . . 60
3.13. Calculating FOM with Classifier Thresholds . . . 61
3.14. VFT Intrusion Detection Hierarchy . . . 62
4.1. Classifier PR Curves - All Network Data . . . 70
Figure Page
4.3. Classifier PR Curves - HTTP Data . . . 75
4.4. Classifier PR Curves - HTTP Data with Additional Features . . . 77
4.5. PR Curves by Alert Class - Classifier Performance . . . 79
4.6. PR Curves by Alert Class - Unknown Threat Detection . . . 80
4.7. VFT Optimal Thresholds - Scenario 1 . . . 83
4.8. VFT Optimal Thresholds - Scenario 2 . . . 85
4.9. VFT Optimal Thresholds - Scenario 3 . . . 88
4.10. VFT Optimal Thresholds - Scenario 4 . . . 90
4.11. VFT Optimal Thresholds - Scenario 5 . . . 92
B.1. Checking Status of Security Onion Services . . . 102
List of Tables
Table Page
2.1. Bro conn.log Fields [2] . . . 11
2.2. Bro conn state Meanings [2] . . . 12
2.3. Bro history Meanings [2] . . . 13
2.4. Summary of Related Work . . . 25
3.1. CDX Data Set Description by Year . . . 32
3.2. Unified2 Log Entry Fields [6] . . . 34
3.3. Addtional Connection Log Features . . . 35
3.4. Final Dataset Descriptions . . . 46
3.5. Two-Class Confusion Matrix Example . . . 53
4.1. Mean Overall Rates with 95% CI - All Network Data . . . 68
4.2. Mean Marginal Rates with 95% CI - All Network Data . . . 69
4.3. Mean Overall Rates with 95% CI - TCP Data . . . 70
4.4. Mean Marginal Rates with 95% CI - TCP Data . . . 71
4.5. Performance Comparison of TCP-Only Connections . . . 72
4.6. Mean Overall Rates with 95% CI - HTTP Data . . . 73
4.7. Mean Marginal Rates with 95% CI - HTTP Data . . . 74
4.8. Mean Overall Rates with 95% CI - HTTP Data with Additional Features . . . 76
4.9. Mean Marginal Rates with 95% CI - HTTP Data with Additional Features . . . 76
4.10. Performance Comparison of HTTP-Only Connections . . . 78
4.11. VFT Weighting Scheme - Scenario 1 . . . 81
Table Page
4.13. VFT Weighting Scheme - Scenario 2 . . . 84
4.14. VFT Evaluation Results - Scenario 2 . . . 84
4.15. VFT Weighting Scheme - Scenario 3 . . . 86
4.16. VFT Evaluation Results - Scenario 3 . . . 87
4.17. VFT Weighting Scheme - Scenario 4 . . . 89
4.18. VFT Evaluation Results - Scenario 4 . . . 89
4.19. VFT Weighting Scheme - Scenario 5 . . . 91
4.20. VFT Evaluation Results - Scenario 5 . . . 91
4.21. VFT Weighting Schemes and Results Summary . . . 93
A.1 Default Snort Alert Classifications [6] . . . 99
B.1. Security Onion Virtual Machine Hardware Settings . . . 101
B.2. Security Onion Applications . . . 102
D.1. Confusion Matrix - All Network Data . . . 109
D.2. Confusion Matrix - TCP Data . . . 109
D.3. Confusion Matrix - HTTP Data . . . 109
D.4. Confusion Matrix - HTTP Data with Additional Features . . . 110
D.5. Confusion Matrix - FTP Data . . . 110
List of Acronyms
Acronym Page
IDS Intrusion Detection Systems . . . 1
TCP Transmission Control Protocol . . . 3
IP Internet Protocol . . . 3
VFT Value-Focused Thinking . . . 4
PR Precision-Recall . . . 4
NIST National Institute of Standards and Technology . . . 5
NIDS Network-Based Intrusion Detection System . . . 5
HIDS Host-Based Intrusion Detection System . . . 5
HTTP Hypertext Transfer Protocol . . . 7
SMTP Simple Mail Transfer Protocol . . . 7
FTP File Transfer Protocol . . . 7
POP3 Post Office Protocol v3 . . . 7
ET Emerging-Threats . . . 7
VRT Vulnerability Research Team . . . 7
SQL Structure Query Language . . . 8
UDP User Datagram Protocol . . . 9
ICMP Internet Control Message Protocol . . . 9
QoS Quality of Service . . . 19
DARPA Defense Advanced Research Project Agency . . . 21
AFRL Air Force Research Laboratory . . . 21
AdaBoost Adaptive Boosting . . . 23
Acronym Page
RLS Regularized Least Squares . . . 24
SVM Support Vector Machine . . . 24
WEKA Waikato Environment for Knowledge Analysis . . . 25
SMO Sequential Minimal Optimization . . . 26
ANNs Artificial Neural Networks . . . 27
MLP Multilayer Perceptron . . . 28
CDX Cyber Defense Exercise . . . 31
NSA National Security Agency . . . 31
NPS Naval Postgraduate School . . . 32
AFIT Air Force Institute of Technology . . . 32
ARFF Attribute-Relation File Format . . . 43
RFC Request for Comments . . . 45
API Application Program Interface . . . 47
TP True Positive . . . 52
TN True Negative . . . 52
FP False Positive . . . 52
FN False Negative . . . 52
TPR True Positive Rate . . . 53
TNR True Negative Rate . . . 53
FPR False Positive Rate . . . 53
FNR False Negative Rate . . . 54
CI Confidence Interval . . . 54
MCC Matthews Correlation Coefficient . . . 56
Acronym Page FOM Figures of Merit . . . 59 UTD Unknown Threat Detection . . . 69
EVALUATING MACHINE LEARNING CLASSIFIERS FOR HYBRID NETWORK INTRUSION DETECTION SYSTEMS
I. Introduction
Intrusion detection is often the primary triggering mechanism for network security analysts to respond to malicious activities on a computer network. The volume and velocity of communications on today’s networks require the use of automated Intrusion Detection Systems (IDS) as human analysts cannot review all transmitted information manually. IDS alerts are typically the starting point for an analyst’s review of an intrusion. After the initial alert, an analyst performs investigations into raw network data, system log sources, and other sources to confirm or deny the alert. An IDS often produces false alarms and misses threats. False alarms cause undue workload on analysts and missed threats leave the organization in a state of false security as intruders unknowingly infiltrate their networks.
The current cyber environment is littered with intrusions and data breaches. The 2013 Data Breach Investigations Report by Verizon analyzed 47,000 security incidents and 621 confirmed data breaches and indicated that 66% of the 621 data breaches “took months or more to discover” [45]. This high percentage of data breaches with delayed detection times reveals one of many problems with the operationalization of IDSes. Other challenges in the intrusion detection problem include false alarms, missed attacks, and the detection of unknown attacks.
Misuse detection, the use of signatures for known threats, is the primary method used in today’s IDSes. As vulnerabilities are discovered, signatures are created and used for detection. This method is reactive and is not capable of detecting unknown
threats, those threats which the detection system lacks a corresponding detection signature. Research on anomaly-based intrusion detection systems has been ongo-ing since the 1980’s but has failed to establish its place in the operational environ-ment that is dominated by signature-based systems. This is primarily attributed to high false positive rates from these anomaly-based systems. Being that signature-based systems cannot detect unknown threats, it is necessary that user confidence for anomaly-based systems improves and operational use of these systems increases. Hybrid solutions, those that incorporate both a misuse and anomaly detector, have been shown to provide many benefits such as reducing false positives and negatives, supporting verification of true and false positives, and detecting unknown threats.
Deploying an anomaly-based IDS in a hybrid configuration alongside an existing signature-based IDS is the next logical advancement in IDS technologies, allowing an organization to enhance an existing signature-based network sensor with the capabil-ity of detecting unknown threats. This is a classification problem that is commonly addressed using machine learning classifiers. Much research has been done over the past 15 years with machine learning in the intrusion detection domain. Yet, there is no clear method of selecting an optimal classifier, or set of classifiers, for use in a hybrid IDS architecture. While the “no free lunch” theorem [47] explains the im-plications of optimization, this research aims to fill the gap of selecting an optimal classifier in terms of evaluator-specified values by providing a methodology for eval-uating classifiers for specific use in hybrid IDS systems. The intent is to provide an evaluation method that will improve user confidence in the use of machine learning classifiers alongside existing signature-based IDSes.
1.1 Research Goals and Hypothesis
The overall goal of this research is to develop a methodology of evaluating a threat classifier system to use in a hybrid IDS architecture. Emphasis is placed on detecting unknown threats while minimizing false positives and negatives as these are common goals among all organizations. Threat classification is accomplished at the connection-level with experiments at multiple layers of the Transmission Control Protocol (TCP)/Internet Protocol (IP) stack to determine the appropriate layer to generalize network traffic. The proposed methodology should allow an organization to develop and test multiple machine learning classifiers in a sensor-specific manner, tailoring the selection to the organization’s own data and network services. The ability to tailor classifier selection based on other organization-specific goals, resources, and security requirements should also be included. As these goals and requirements change over time, the evaluator should be able to quickly reevaluate classifiers. An evaluator should be able to weight parameters for detecting known and unknown threats, false positives, and detection rates by type of attack. Specific research goals are:
1. Provide a machine learning classifier evaluation methodology which incorporates a weighted scheme allowing evaluator-specific requirements to be considered in the evaluation process.
2. Demonstrate an engineering advantage by applying the methodology to evalu-ate multiple classifiers used in intrusion detection experiments using notional weighting schemes.
3. Conduct experiments at various layers in the TCP/IP stack to determine if the layer in which network traffic is generalized has any statistical significance in results.
The hypothesis is that there will be an engineering advantage to incorporating an evaluator-specific weighting scheme into the classifier evaluation process. While not measured, user confidence for selected machine learning classifiers should increase by selecting classifiers developed that align with user values.
1.2 Research Contributions
This research contributes to the field of intrusion detection, with an emphasis in the application of machine learning. This research presents a comprehensive ap-proach, similar to cross-validation, to evaluate a classifier’s ability to detect unknown threats by allowing every malicious connection in the dataset the opportunity to be tested as an unknown threat. This research also applies the Value-Focused Thinking (VFT) decision-making approach, from the field of operations research, to evaluate classifiers using a value hierarchy model constructed towards using the classifiers in a hybrid IDS architecture. Lastly, this research presents a unique approach to parsing a traditional Precision-Recall (PR) curve into multiple curves representing different attack classifications allowing the classification performance for each classifier to be compared by attack class across the entire range of prediction thresholds.
1.3 Preview
This chapter introduced problems within the intrusion detection domain, focus-ing on the operationalization of machine learnfocus-ing in hybrid IDS architectures. The research goals, hypotheses, and contributions were also presented. Chapter II covers related work to include a background of IDS technologies and the application of ma-chine learning to intrusion detection. Chapter III explains the methodologies used for the experiments in this research. Experiment results are in Chapter IV. Conclusions are provided in Chapter V along with recommendations for future research.
II. Related Research
2.1 Chapter Overview
This chapter provides a background of IDS technologies and how machine learning is being applied to the problem. The first section covers a brief history of IDSes and two popular open-source IDS applications. The following section examines intrusion detection methodologies, thoroughly explaining the difference between misuse and anomaly detection and how they can be applied in a hybrid configuration. Next, a literature review of recent research on the application of machine learning to net-work traffic and threat detection classification is presented. Finally, a brief technical background of the machine learning classifiers used in this thesis is provided.
2.2 Intrusion Detection Systems
An intrusion is “the act of wrongfully entering upon, seizing, or taking possession of the property of another” [4]. Adapting this definition to the cyber domain, an intrusion can be considered any attempt to compromise a system’s confidentiality, integrity, or availability. The early works of detecting intrusions in the cyber domain can be traced back to the 1980’s with the seminal research conducted by Ander-son [11] and Denning [15]. The detection methodology shifted from primarily manual inspection of audit logs to automated systems that analyze large amounts of data in real-time.
The National Institute of Standards and Technology (NIST) categorizes IDSes by the method used to collect and analyze audit data [40]. A Network-Based Intru-sion Detection System (NIDS) analyzes network traffic for suspicious behavior. A Host-Based Intrusion Detection System (HIDS) monitors activity on a specific host. A wireless IDS analyzes wireless network traffic for suspicious behavior. Finally, a
network behavior analysis system analyzes statistical features of network traffic to identify suspicious behavior.
Many challenges exist in intrusion detection. Intrusion detection is ultimately a classification problem. Audit data is collected, analyzed, and classified as malicious or normal. As with any other classification problem, false positives and negatives are a challenge. Other challenges specific to network intrusion detection are constantly evolving environments, detection of novel attacks, and encryption. Research in the IDS domain is limited by lack of ground truth data and standardized datasets to evaluate IDS technologies.
This research is restricted to network-based IDS. The following sections provide in depth detail of two popular open-source NIDS, Snort and Bro, both of which are used in the research experiments of this thesis.
2.2.1 Snort.
Originally released in 1999, Snort built upon tcpdump, a packet sniffing tool, adding the ability for packet payload inspection using easy to write rules [38]. Snort has since become the leading open source signature-based IDS. The architecture show-ing the data flow through Snort is shown in Figure 2.1. Each process within the architecture is now briefly described:
• Libpcap Library: An open source, UNIX-based, library that provides an
appli-cation programming interface (API) to capture network packet data. Designed to be used with C or C++, but wrappers are available to access the API with languages like Perl, Python, Java, C#, or Ruby [20]. Winpcap is the Windows equivalent.
• Packet Decoder: Receives the Ethernet frame from libpcap and analyzes packet
per-Libpcap Library Packet Decoder Preprocessor Plug-Ins Detection Engine Output Plug-Ins Ruleset
Figure 2.1. Snort Architecture and Data Flow
form actions at this step if desired, such as dropping a packet prior to it being forwarded to the preprocessor.
• Preprocessor Plug-Ins: Modular plug-ins that run after each packet is decoded,
but prior to the detection engine [6]. Plug-ins are used for most application-level services (e.g., Hypertext Transfer Protocol (HTTP), Simple Mail Transfer Pro-tocol (SMTP), File Transfer ProPro-tocol (FTP), Post Office ProPro-tocol v3 (POP3)) in order to process application-layer header information prior to the detection engine. This allows rules to be written using protocol-specific fields. Other plug-ins are used for specific functionality, such as plug-inspecting fragmented packets and detection of port scan activities.
• Detection Engine: The process used to compare each packet with the rules
stored in the ruleset. A simplified view of this process is that every packet is compared to every rule in the ruleset. In fact, there is a complex data structure consisting of chains of rules and options that are used to compare rules to packet contents. Many improvements to this process have been researched to increase the speed of detections and minimize packet drops on high bandwidth interfaces. Specific details of this process is beyond the scope of this thesis.
• Ruleset: Repository of rules used to perform packet inspection.
Emerging-Threats (ET) [3], an open source ruleset library maintained by the Snort com-munity, and the Talos (formerly the Vulnerability Research Team (VRT)) [7]
ruleset libraries are the two leading rulesets in use. Both libraries offer paid subscription and free versions of their rulesets, the difference being less delay in receiving newly developed rules for paid users. Users also have the ability to create site specific rules in addition to these public rulesets. Rules are stored in flat-text files.
• Output Plug-Ins: Modular plug-ins that enable alerts to be output in various
formats. Alerts can be output as a simple text file or formatted for an Structure Query Language (SQL) database, syslog, or other desired format. The mod-ularity of the output plug-ins allows for customization to any user’s network security monitoring architecture.
Snort operates by inspecting individual packets using rules that match patterns of bytes. An example Snort rule is provided in Figure 2.2. This rule sends an alert when a TCP packet is detected from $EXTERNAL NET any port, to $HTTP SERVERS $HTTP PORTSmeeting the conditions specified within the parenthesis. $EXTERNAL NET, $HTTP SERVERS, and $HTTP PORTS are dynamic variables that are set in the Snort configuration file. The alert message “ET WEB SERVER cmd.exe In URI - Possible Command Execution Attempt” is sent when a TCP connection is established and the content of “/cmd.exe” is detected in the http uri field of the HTTP header. The reference document is noted along with the class type, signature identification number, and signature revision number. This signature ultimately alerts when “/cmd.exe” is found in a specific type of packet under specific conditions that have been deemed to alert tcp $EXTERNAL_NET any -> $HTTP_SERVERS $HTTP_PORTS (msg:"ET \
WEB_SERVER cmd.exe In URI - Possible Command Execution Attempt"; \ flow:to_server,established; content:"/cmd.exe"; fast_pattern:only; \ nocase; http_uri; reference:url,doc.emergingthreats.net/2009361; \ classtype:attempted-recon; sid:2009361; rev:6;)
represent a command execution attempt. This is a rather simple rule using a small set of the options available in Snort. A full description of options with more rule examples can be found in the Snort Users Manual [6].
Alert classification types are commonly used for management of rules and to aid in alert analysis. By default, the priority of each rule is set to the corresponding alert classification. Priorities can be modified per rule if desired. Example alert classifications are network scans, attempted denial-of-service, and shellcode detection. The complete list of default alert classifications and priorities are listed in Appendix A. The use of alert classifications will be leveraged in the experiments of this thesis.
2.2.2 Bro.
Bro is an open-source network security monitor originally developed by Paxson [34] and currently maintained as a joint team of researchers and developers at the Inter-national Computer Science Institute in Berkeley, CA and the National Center for Supercomputing Applications in Urbana-Champaign, IL [1]. Bro incorporates a sep-aration of mechanism and policy that does not inherit a “good” vs “bad” ideology like a typical IDS, but instead leaves the user to define a local policy designed around network-based events. Instead of loading rules that detect malicious activity, all net-work data is monitored and logged, then scripts are used to take action when specific criteria are met.
Bro also differs from a typical IDS in that it is connection-based rather than packet-based, meaning that events are related to connections where a typical IDS such as Snort relates alerts to packets. A connection can contain one or many pack-ets. Bro’s definition of a connection includes TCP connections as well as User Data-gram Protocol (UDP) and Internet Control Message Protocol (ICMP) flows. TCP connections in Bro are created when the first packet of an unknown connection, a
connection not actively being monitored, is seen and closed when the TCP connec-tion is terminated or a configured timeout interval has been reached. UDP and ICMP connections are created when the first packet of an unknown connection is seen and closed when a configured timeout interval has been reached. UDP and ICMP packets are related to actively monitored connections if they contain matching source and destination IP addresses and ports and arrive before the timeout interval has elapsed. Every connection receives a unique identifier.
The architecture of Bro is presented in Figure 2.3. Like Snort, network data is first filtered using libpcap. The filtered network data is processed by the Event Engine which abstracts events from the network data. Example events are connec-tion established, http request, http reply, and connecconnec-tion finished. Protocol analyz-ers are included for all common networking protocols which define each event and the information contained within each event. The event stream is then processed by the Policy Script Interpreter which contains a set of scripts that take action based on the events received. Actions could include logging information, generating alerts,
Network
Event stream Record to disk Real-time notification
Filtered packet stream
Event Engine
Policy script
Event control
Tcpdump filter
Packet stream
Policy Script Interpreter
libpcap
or executing additional scripts or programs. Default policy scripts are included with Bro to provide an initial logging and malicious detection capabilities. The default logs produced by Bro are the conn.log, http.log, dns.log, dhcp.log, ftp.log, smtp.log, and others. Each log contains specific features related to connections of a specific type. Users are also able to develop their own local policy scripts using the Bro programming language to produce logs and alerts as desired.
The conn.log is largest of the default logs as it contains the details on every
con-Table 2.1. Bro conn.log Fields [2] Feature Data Type Description
ts time Time of first packet
uid string A unique identifier of the connection
id.orig h addr Originator’s IP address
id.orig p port Originator’s port number
id.resp h addr Responder’s IP address
id.resp p port Responder’s port number
proto transport proto Transport layer protocol of the connection (TCP, UDP, ICMP)
service string Application protocol being sent over the
connec-tion (HTTP, FTP, DNS, etc)
duration interval Duration of the connection
orig bytes count Number of payload bytes the originator sent
resp bytes count Number of payload bytes the responder sent
conn state string State of connection (see Table 2.2)
local orig bool True if connection originated locally or false if originated remotely
missed bytes count Number of bytes missed in content gaps or
packet loss
history string Records state history of connections as a string
of letters (see Table 2.3)
orig pkts count Number of packets sent by originator
orig ip bytes count Number of IP level bytes sent by originator
(taken from IP total length header field)
resp pkts count Number of packets sent by responder
resp ip bytes count Number of IP level bytes sent by responder
(taken from IP total length header field) tunnel parents set[string] Set of uids if connection was over a tunnel
Table 2.2. Bro conn state Meanings [2] conn state Meaning
S0 Connection attempt seen, no reply.
S1 Connection established, not terminated.
SF Normal establishment and termination. Note that this is the same symbol as for state S1. You can tell the two apart because for S1 there will not be any byte counts in the summary, while for SF there will be.
REJ Connection attempt rejected.
S2 Connection established and close attempt by originator seen (but no reply from responder).
S3 Connection established and close attempt by responder seen (but no reply from originator).
RSTO Connection established, originator aborted (sent a RST). RSTR Established, responder aborted.
RSTOS0 Originator sent a SYN followed by a RST, we never saw a SYN ACK from the responder.
RSTRH Responder sent a SYN ACK followed by a RST, we never saw a SYN from the (purported) originator.
SH Originator sent a SYN followed by a FIN, we never saw a SYN ACK from the responder (hence the connection was half open).
SHR Responder sent a SYN ACK followed by a FIN, we never saw a SYN from the originator.
OTH No SYN seen, just midstream traffic (a partial connection that was not later closed).
nection seen by Bro. Features from the conn.log are used in the machine learning ex-periments in this thesis, therefore a complete description of it’s contents is warranted. The fields of the default conn.log are presented in Table 2.1. Further explanation of the conn state and history fields are presented in Tables 2.2 and 2.3, respectively.
2.3 Intrusion Detection Methodologies
The NIST classifies common detection methodologies as signature-based detec-tion, anomaly-based detecdetec-tion, and stateful protocol analysis [40]. Synonymous to signature-based, misuse-detection is common terminology in intrusion detection liter-ature and will be the terminology used in this thesis. All methods can be “stateful”,
Table 2.3. Bro history Meanings [2] Letter Meaning
s a SYN w/o the ACK bit set
h a SYN+ACK (“handshake”)
a a pure ACK
d packet with payload (“data”) f packet with FIN bit set r packet with RST bit set c packet with a bad checksum i inconsistent flags in packet
therefore protocol analysis is considered independently. A stateful IDS uses memory to store the state of the environment being observed, allowing state to aid the detec-tion criteria rather than acting on each individual observance alone. For example, a stateful NIDS is capable of detecting threats across multiple packets rather than just one individual packet. This is implemented to assist detection of fragmented attacks, a common IDS evasion technique used by attackers. Hybrid detection methods that combine the use of misuse and anomaly detection are covered in [16]. These four methods are discussed in detail in the following sections.
2.3.1 Misuse Detection.
Misuse detection relies on signatures that correspond to a known vulnerability or threat. A NIDS employing misuse detection will compare network traffic, each individual packet, to a database of signatures producing an alert when there is a match. Systems that use misuse detection are effective at detecting known threats when a corresponding signature is available. Misuse detection is not well suited to detect unknown threats, such as a zero-day attack, or even a variation of known threats. High detection rates with low false positive rates are achievable with a set of well-designed signatures. Snort [5] is the leading open-source misuse detection IDS and is covered in more detail in Section 2.2.1.
2.3.2 Anomaly-Based Detection.
Anomaly-based detection compares observed events to activities considered nor-mal in order to identify significant deviations from nornor-mal [40]. A baseline of “nornor-mal” must be captured to use as a comparison for the anomaly-based detection system. Challenges in creating a suitable baseline include ensuring that no malicious activity is present and the time period selected to baseline (days, weeks, or months). Activities deviating from the baseline are considered anomalous, but are not always considered a threat.
The primary advantage of an anomaly-based system is the ability to detect un-known threats. One disadvantage is a high rate of false positives, due to the engineer-ing decisions made selectengineer-ing thresholds for alerts. Another disadvantage is the lack of information provided to an analyst from an alert from an anomaly-based system. In a misuse detection system, analysts can see the signature that caused the alert and compare it to the suspect packet(s). The signature of an anomaly-based system typically relies on statistical methods comparing multiple features that will not be as easy for an analyst to decipher. Anomaly-based alerts typically require more time and expertise to investigate [?].
2.3.3 Stateful Protocol Analysis.
Stateful protocol analysis, sometimes referred to as “deep packet inspection”, compares profiles of acceptable protocol activity for each protocol to observed events to identify deviations [40]. This differs from anomaly-based detection as the focus is on specific protocols rather than network features. Bro [34] is a network security framework that uses protocol analyzers and was covered in detail in Section 2.2.2.
2.3.4 Hybrid Detection.
Hybrid detection methods involve the use of misuse-based and anomaly-based detection with the intent of capitalizing on the benefits of the combined approach. Engineering a solution that maintains the lower false positive rate of misuse detection with the ability to detect unknown threats of anomaly detection could drastically improve the security posture of our networks. Four methods of combining misuse and anomaly detection are misuse-anomaly, anomaly-misuse, parallel, and complex [16, 48, 49]. These hybrid methods are presented in the following sections.
The following sections contains a common use of terms and set notation as pre-sented in [16]. Cyber audit data is represented by set X. Au and An are
un-known and normal output from the anomaly detection system, with the properties: Au∪An=X, Au ∩An =∅. Mi and Mu are the intrusive and unknown output from
the misuse detection system, with the properties: Mi ∪Mu = X, Mi ∩Mu = ∅. A
detailed description that further breaks each subset into a confusion matrix of true and false positives, and true and false negatives based on known ground truth data can be found in [16, 44].
2.3.4.1 Anomaly-Misuse.
A detection system using the anomaly-misuse serial combination will classify with the anomaly detector first and forward unknown output to the misuse detector. The anomaly-misuse system provides three subsets of X: An, Au∩Mi, and Au∩Mu, as
shown in Figure 2.4, that represent normal, intrusive, and unqualified classes respec-tively [44]. Intuirespec-tively, the intrusive class,Au∩Mi, contains items that both detectors
alerted on and a higher true positive rate is expected for this subset over either de-tector used independently. Intuitively, the unqualified class, Au∩Mu, contains items
investigation from an analyst. Because An is not sent to the misuse detector, this
system should have an anomaly detector with a high accuracy rate of the normal class.
Anomaly
detection
Misuse
detection
X
A
uA
nA
u∩
M
uA
u∩
M
iFigure 2.4. Anomaly-Misuse Detection System Workflow [16, 44]
Tombini et al. [44] applied an anomaly-misuse detection system to HTTP traffic resulting in a reduction of 94.25% in log entries (alerts) in the unqualified class when filtering through the anomaly detector compared to using the misuse detector alone. This represents a drastic reduction in unqualified alerts that require investigation from an analyst. Qualitative results are presented showing a combined reduction of 94.52% in unqualified and intrusive classes explaining that a majority of the filtered intrusive class were likely to be false positives from the misuse detector based on the severity levels of the alerts. Ground truth data was unavailable to confirm the qualitative results.
2.3.4.2 Misuse-Anomaly.
A detection system using the misuse-anomaly serial combination will classify with the misuse detector first and forward unknown output to the anomaly detector. The misuse-anomaly system provides three subsets of X: Mi, Mu∩An, and Mu∩Au, as
shown in Figure 2.5, that represent intrusive, uknown-normal, and unqualified classes respectively. Intuitively, the unknown-normal class,Mu∩An, contains items that the
misuse detector classified as unknown and the anomaly detector classified as normal. While still requiring investigation from an analyst, the items in the unknown-normal
class would be a lower priority than the unqualified class, Mu∩Au, discussed in the previous section.
Misuse
detection
Anomaly
detection
X
M
uM
iM
u∩
A
uM
u∩
A
nFigure 2.5. Misuse-Anomaly Detection System Workflow [16, 49]
Zhang et al. [48, 49] applied a random-forests-based misuse-anomaly detection system to the KDD’99 dataset resulting in a detection rate of 94.7% with a false positive rate of 2% compared to the misuse detection used independently achieving a detection rate of 94.2% with a false positive rate of 1.1%. The anomaly detection used independently achieved a detection rate of 65% with a false positive rate of 1%. This research concluded that the misuse-anomaly detection system did detect intrusions missed by the misuse approach with minor increase in false positives.
2.3.4.3 Parallel.
A detection system using a parallel configuration will classify all cyber audit data with an anomaly detector and a misuse detector independently. Initially, the outputs Au, An, Mi, and Mu are created as each detector classifies audit data. A correlation
function, called resolver(), produces subsetsAn∩Mi,An∩Mu,Au∩Mi, andAu∩Muas
shown in Figure 2.6. Intuitively, setsAn∩Mu andAu∩Mi represent instances where
both detectors support the other and higher detection rates for normal and intrusive items should be expected. On the other hand, sets An∩Mi and Au ∩Mu represent
instances where the two detectors disagree, requiring an analyst to investigate. An advantage to the parallel configuration is that all subsets of results can be further analyzed compared to how anomaly-misuse does not classify instances in An with
Misuse detection Anomaly detection X An∩Mi Resolver() Mu∪Mi Au∪An An∩Mu Au∩Mi Au∩Mu
Figure 2.6. Parallel Detection System Workflow [16]
the misuse detector and how misuse-anomaly does not classify Mi with the anomaly
detector. Any false negatives in these two subsets have no chance of being discovered by the other detection method. On the other hand, showing all cyber audit data to both detectors could be viewed as a processing disadvantage.
2.3.4.4 Complex.
Complex detection systems use a combination of misuse and anomaly detection but do not exactly fit the structure of anomaly-misuse, misuse-anomaly, or paral-lel [16]. Examples include the use of multiple machine learning classifiers as the misuse and/or the anomaly detector, producing more combinations of sets and sub-sets of intrusive, normal, and unknown instances beyond what was presented in the previous sections.
2.4 Machine Learning and Intrusion Detection
Machine learning is a multidisciplinary field that utilizes knowledge from the fields of artificial intelligence, statistics, computational complexity theory, control theory, information theory, philosophy, psychology, neurobiology, and others [29]. Machine learning focuses on learning algorithms that build models from data that can then be used to make decisions or predictions. Thus, machine learning can be considered
a data-driven method of knowledge discovery.
Machine learning algorithms are generally categorized as supervised or unsuper-vised based on the method used to train the algorithm. In superunsuper-vised learning, labeled data in the form of instances are supplied to the algorithm to train with. The algo-rithm builds a model based on the features that correspond to the labeled instances. The labels are also known as classes. In unsupervised learning, the data supplied to the algorithm for training is not labeled. Instead, the unsupervised learning algorithm finds patterns or structure within the data to develop categories, or clusters, that can then be used to make decisions or predictions. More than one type of algorithm can be applied to a problem, for example, a clustering algorithm (unsupervised) can be used to label an unlabled dataset that a classification algorithm (supervised) then uses to train with. The experiments in this thesis use only supervised learning algorithms, but many types of algorithms are discussed in the following sections.
Machine learning has been applied more generally in the classification of network traffic and more specifically to classifying threats within network traffic. General network traffic classification has many purposes ranging from network planning and provisioning to maintaining Quality of Service (QoS) levels for customers. Network threat detection classification specifically focuses on identifying malicious network traffic. The following sections discuss relevant research in both of these areas.
2.4.1 General Network Traffic Classification.
Traditionally, network traffic was classified based on the set of assigned and ‘well-known’ port numbers. Moore and Papagiannaki [31] demonstrate that recent trends in port assignment and usage result in no better than 70% classification accuracy using the traditional port-based classification methods. Initally, this led to the use of statistical traffic properties and ultimately to the application of machine learning
algorithms to classify network traffic.
In order to generalize network traffic using machine learning, the first step is to extract features to represent the network traffic. Features can be extracted at the packet-level, but are more commonly extracted at the connection-level. Connections, sometimes referred to as flows, consist of one or more packets and represent a session between two hosts for a connection-oriented protocol such as TCP. For connectionless protocols, such as UDP, connections can contain packets to and from the same hosts for a specified duration.
Moore et al. [30] present a comprehensive list of 249 discriminators (features) to use in flow-based classification applications. All features are extracted from packet header information from the packets within a connection. Therefore, each connection represents an instance with 249 features. Statistical features include means, variances, standard deviations, minimums, maximiums, and quartile measures for connection-level data such as byte counts, packet inter-arrival times, TCP flag counts, and more. Nguyen and Armitage [33] present a survey of 17 machine learning research papers focused on the general classification of network traffic. Supervised, unsupervised, and combined approaches are discussed which use various machine learning algorithms and feature sets to conduct experiments on many different datasets. High accuracy (up to 99%) is reported for many offline analysis and a focus for real-time analysis is now trending. A full review of these methods is beyond the scope of this thesis. The intent of this section is to document the related field of general network traffic classification and provide resources to the reader.
2.4.2 Network Threat Detection Classification.
This section discusses the use of machine learning classifiers specific to the appli-cation of network threat detection. First, common datasets problems are discussed.
Then a discussion of semantics relating to anomaly detection and threat classification is presented. Finally, a collection of related work is reviewed.
2.4.2.1 Datasets.
Machine learning research in classification of network threats is similar to general network traffic classification and commonly uses similar connection-level features. One difference is requirement for data that contains attacks along with normal traffic. There is a lack of standard datasets or methods to create data to be used in network threat detection research. The commonly used datasets are considered “no longer adequate for any current study” [41], leaving many researchers to produce their own data to conduct experiments that are not easily compared to research performed by others.
A prominent dataset used in IDS research is a synthetic dataset created by MIT’s Lincoln Laboratory with sponsorship by the Defense Advanced Research Project Agency (DARPA) and the Air Force Research Laboratory (AFRL) [28]. Shortcom-ings of the DARPA ’98 and ’99 datasets and the methods used to create the synthetic network data have been presented by Mahoney and Chan [25] and McHugh [26]. The KDD’99 dataset was derived from the DARPA ’98 dataset for the International Knowledge Discovery and Data Mining competition [17] by processing the raw tcp-dump data into instances of connections represented by 41 features each. While inheriting some of the same criticism as the DARPA datasets, the KDD’99 dataset is the most widely used among IDS researchers. The recently released Kyoto2006+ dataset was created from three years of data (2006-2008) collected from a honeypot at Kyoto University [42]. The Kyoto2006+ dataset attempts to solve the synthetic and out-of-date problems associated with the KDD’99 dataset.
2.4.2.2 Anomaly Detection vs Threat Classification.
It is important to discuss the difference between anomaly detection and other machine learning classification approaches to intrusion detection as the terms are often used interchangeably when, perhaps, they should not be. Symons and Beaver [43] factor the intermixing of terms to the common use of clustering, an unsupervised machine learning approach, to the anomaly detection problem. Normal instances are clustered, then outliers are identified as anomalous.
Sommer and Paxson [41] relate outlier detection of this manner to a “closed world” approach where outliers are assumed to belong to the negative class and consider this as a primary challenge for the application of machine learning to intrusion detection. The authors continue to explain that domains in which machine learning has been applied successfully rely on true classification problems, using samples of positive and negative classes to train a learner. Finally, the authors suggest that machine learning would be better suited for findingvariations of known attacks rather than discovering
unknown attacks.
Symons and Beaver [43] argue the semantics of variations of known attacks versus
unknown attacks orpreviously unseen attacks presented by Sommer and Paxson [41],
taking the view that normal traffic can be completely different from anything pre-viously seen and that prepre-viously unseen attacks may not appear anomalous in the original feature space, but may in fact have distinguishing features that are more similar to known attacks than normal traffic. Their argument is concluded by sug-gesting the problem is finding the right view, the appropriate expert-derived feature set, through which these distinctions can be made.
This thesis adopts the assumptions of Symons and Beaver [43] on the topic of classifying unknown threats. The supervised algorithms used in the experiments presented in Chapter III are trained with a set of features which the classifier uses to
develop a feature space used to make classification decisions. The developed feature space may resemble that of the original feature space, such as in a decision tree, or it may not resemble the original feature space at all, such as in a neural network. The similarity between a known threat, one which the system has seen, versus an unknown threat, one which the system has not seen, is not simply a variation of the known threat in the original feature set observed by a human analyst, but a similarity in a feature space of the classifier, which was derived from the original feature set by the machine learning algorithm. This similarity in feature space may or may not represent a variation of a known attack or a completely novel attack in terms of the original feature space which a human analyst works with.
There is no common definition of unknown threats with respect to machine learn-ing classifiers and intrusion detection. There is no common method to evaluate a classifier’s ability to detect unknown threats. This property is arguably the most important measure to consider for a classifier used as an IDS and because of this, an experiment and evaluation method is presented in Chapter III in an attempt to address this issue.
2.4.2.3 Related Work.
Beaver et al. [12] developed a system with the objectives of complementing a signature-based IDS, detecting attacks previously unseen by the system, while demon-strating a high detection and low false positive rate. A boosted decision tree algo-rithm, using Adaptive Boosting (AdaBoost), was tested alongside a signature-based sensor on a self-created dataset comprised of 40 features similar to those from the DARPA 1999 KDD dataset. A penetration test team conducted various attacks, some of which the system was not trained for. The machine learning system detected 82% of the attacks missed by the signature-based system and 89% of the attacks which it
had not been trained. The overall detection rate of the machine learning sensor was 94% with a false positive rate of 1.8%. While the authors demonstrate the usefulness of a hybrid architecture, the complete methodology used to create unknown attacks is not disclosed, leaving the audience to question whether the method of selecting unknown attacks for the experiments was comprehensive enough to validate the re-sults. Unknown attacks with similar features, in the classifier’s feature space, to the attacks which the system was trained could have been used which would lead to high detection rates. The comprehensive unknown threat detection method, such as the one presented in this thesis, would better support such results.
Symons and Beaver [43] address the challenge of training an IDS in-situ, in the environment of intended use, by comparing two semi-supervised machine algorithms, Laplacian Eigenmap (LEM) and Laplacian Regularized Least Squares (RLS), to a signature-based system, a linear Support Vector Machine (SVM) classifier, and a maximum entropy classifier. The Kyoto2006+ dataset, which has instances of known and unknown attacks, was used in this research. The authors demonstrate the advan-tage of the Laplacian RLS algorithm, compared to the other algorithms, when using small training sets. The Lapalacian RLS is also shown to perform well when detecting unknown attacks, detecting 397 of the 398 unknown attacks with a false positive rate of 0.01619. The unknown attack detection capabilities of the other machine learn-ing algorithms are not presented in this research. While comparisons are made to a signature-based system, the combined results and value of a hybrid configuration are not discussed in the research.
A summary of the reviewed literature for machine learning methods used in net-work threat detection is presented in Table 2.4. The algorithm and dataset used is included along with whether a hybrid architecture and unknown threats were consid-ered.
Table 2.4. Summary of Related Work
Author(s) Algorithm(s) Dataset Hybrid Unk Threats
Zhang et al. [49] Random Forests KDD ’99 X
Beaver et al. [12] AdaBoost Decision Tree Self-Created X X
Symons and Beaver [43] Laplacian Eignenmap Kyoto2006+ X
Laplacian RLS Linear SVM Maximum Entropy
2.5 Classifiers
Many machine learning classifier algorithms have been applied to the intrusion detection problem. In the limited scope of this thesis, five algorithms along with two boosted variations will be compared. The Waikato Environment for Knowledge Analysis (WEKA) machine learning suite from the University of Waikato [21] is used to conduct the experiments for this thesis. All of the algorithms used in this research are supervised machine learning algorithms which utilize labeled training data to construct models used to make classification decisions. The following sections will provide the necessary background and relevant WEKA-specific implementations for each of the algorithms used in this research.
2.5.1 Bayesian Network.
Bayesian classifiers are probabilistic and produce probability estimates rather than hard classifications when making classification decisions [46]. Na¨ıve Bayes, a com-monly used Bayesian classifier, uses a joint probabilistic model which assumes inde-pendence among features. While Na¨ıve Bayes is often successful, assuming indepen-dence among features is not always possible, which is when a more general Bayesian Network is preferred. Bayesian Networks are a network of nodes, one node for each feature, connected by directed edges such that there are no cycles, a directed acyclic graph. The connections between nodes represent conditional probabilistic properties
between features. Within each node is a table which defines a probability distribution that is used to produce probability estimates when classifying new instances.
2.5.2 Instance-Based Learner (IBk).
Instance-based learners generate predictions by comparing instances to be classi-fied to the set of saved instances rather than using a set of abstractions of specific-instances as a model [9]. The classification decision matches the classification of the closest matching instance in the test set. Instance-based learners are considered lazy algorithms since a model is not built causing the computational expense to occur during classification. IBk is an intance-based learner in WEKA that uses a k-nearest neighbor classifier to determine the closest matching instance with a Euclidean dis-tance function [46].
2.5.3 Sequential Minimal Optimization (SMO).
Sequential Minimal Optimization (SMO) is a training algorithm applied to a Sup-port Vector Machine (SVM) [35]. An SVM algorithm is used for two-class classifica-tion problems [13]. Input vectors are non-linearly mapped to a highly dimensional feature space and a linear decision surface is created, separating the two classes. The dimensionality of the feature space is defined by the kernel function selected for use in the SVM algorithm. Linear or polynomial kernel functions can be used. In a two-dimension space, a line would be created to represent the decision barrier while the algorithm seeks to maximize distance from the line for the instances of each class. The instances closest to the decision barrier are called support vectors. In multi-dimension space, the decision barrier is represented by a hyperplane. SVMs can also be used for multi-classification problems by splitting the problem into multiple two-class classification problems and applying an SVM to each subproblem.
The mathematical problem of calculating the optimal hyperplane to use in an SVM is a very large quadratic programming optimization problem [35]. SMO breaks this quadratic problem into a series of the smallest possible quadratic problems, keeping the training process between the linear to quadratic range with regards to the training set size, where the standard SVM algorithm training process falls between the linear to cubic range with regards to the training set size. WEKA utilizes the SMO training process for its SVM implementation.
2.5.4 Decision Trees.
C4.5 is a popular open-source decision tree algorithm developed and improved by Quinlan [37, 36]. A tree structure is produced such that each node represents a decision that corresponds to a specific feature and each leaf node represents a classification decision. Each instance to be classified begins at the root node and traverses down the tree until reaching a leaf node where the classification decision is made. A pruning process is used to reduce the overall size of the decision tree and to reduce the chance of overfitting, a problem that occurs when too many branches are created to represent the training set that ends up not generalizing well with test data.
WEKA’s implementation of the C4.5 algorithm is called J48, which implements a later, slightly improved, version of C4.5 before the release of the proprietary version C5.0 [46]. J48 is implemented in Java rather than C, explaining the use of J rather than C in the algorithm’s name.
2.5.5 Artificial Neural Networks (ANNs).
Artificial Neural Networks (ANNs) are inspired by biological learning systems comprised of complex networks of interconnected neurons [29]. A set of inputs, the
values of features for each instance, are connected to hidden layers of nodes, which are connected to specific outputs, representing the classes in a classification problem. Each connection is a weighted function that is updated with a training process which maps the input features to the labelled output. The network is trained on multiple iterations of the training data, updating the weight on each iteration until a suitable model is constructed.
WEKA’s Multilayer Perceptron (MLP) is an ANN which uses backpropagation for training and allows the user to select the number of hidden layers, training cycles, and other parameters [46].
2.5.6 Boosting Algorithms.
Boosting algorithms are applied to reduce errors of a weak learning algorithm, whose performance is a little better than random guessing [19]. This is accomplished by running the weak learner multiple times over the training data and combining the resulting models from the weak classifier into a combined composite classifier.
WEKA implements the AdaBoost.M1 algorithm which assigns weights to each training instance during each iteration of the boosting algorithm [46]. Instances re-ceive an equal weight for the first iteration, then the weights decrease or increase for correctly and incorrectly classified instances, respectively. This leaves “easy” to clas-sify instances with a low weight and “hard” to clasclas-sify instances with a high weight. Subsequent iterations of the AdaBoost.M1 algorithm focus on correctly classifying the hard to classify instances, ultimately producing a model with reduced error.
2.6 Summary
In summary, this chapter provided a background of IDS technologies, reviewing the architecture and processes of Snort and Bro. IDS methodologies were discussed in
detail, including the various hybrid IDS configurations. A review of machine learning research applied to general network traffic classification and network threat detection classificiation was presented. Finally, the necessary background on the classifiers used in the experiments of this thesis was provided.
III. Methodology
3.1 Chapter Overview
This chapter explains the methodology used in this thesis. The first section de-scribes a proposed system architecture which encompasses the methodology used. Next, a description of the dataset used in the experiments is provided. The chapter then discusses the network sensor configuration. The data preprocessing steps are then presented, followed by the classifier configuration. The chapter then explains the machine learning experiments conducted and the performance metrics used for evaluation. Finally, the chapter concludes with the development of a Value-Focused Thinking (VFT) hierarchy to be used for classifier evaluation.
3.2 Proposed System
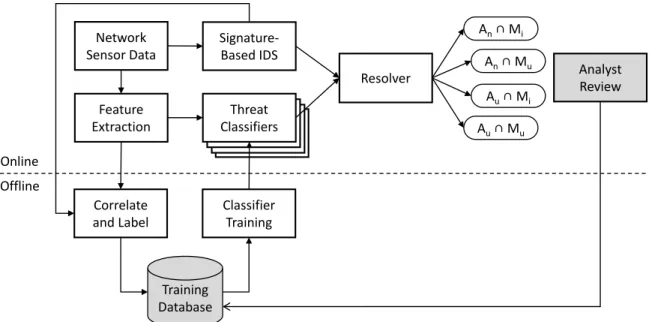
This research proposes a multi-modality hybrid IDS which uses a packet-level signature-based IDS and a connection-level machine learning threat classifier system. The proposed architecture is provided in Figure 3.1. Network sensor data is classified at the packet-level by the signature-based IDS and also sent to extract connection-level features. In the online process, the connection-connection-level features would be classified by the trained threat classifier(s), then passed to the resolver. The resolver would cor-relate packet-level alerts to connections, then produce the desired subsets previously discussed in Section 2.3.4 for the analyst to review.
Dua and Du [16] mention the lack of details of the resolver presented by Anderson et al. [10]. A possible implementation in this proposed architecture is to first correlate the packet-based alerts from the signature-based IDS to the connections identified by the connection-level feature extraction, then create a normal and alert set for each classifier, including Snort. Any desired subset combination, for multiple classifiers,
Network Sensor Data Signature-Based IDS Resolver Analyst Review Feature Extraction Threat Classifiers Correlate and Label Online Offline Training Database Classifier Training An∩ Mi An∩ Mu Au∩ Mi Au∩ Mu
Figure 3.1. Proposed System Architecture
can then be produced from the resolver using simple set operations.
The offline portion illustrates the correlation and labeling process used to create training datasets for the threat classifiers. The shaded components are not addressed in this research, but are provided here as a possible mitigation for the assumption of training classifiers with data that is not labeled with ground truth. The idea being that a human analyst will review and update the training data with ground truth prior to training classifiers. The details specific to each component are covered in the rest of this chapter.
3.3 Dataset Description
As discussed in Chapter II, datasets are among the challenges in IDS research. The data used in this research comes from the Cyber Defense Exercise (CDX), an annual cyberwarfare exercise sponsored by the US National Security Agency (NSA). The network environment and situation in which this dataset originated can be found in [32]. The CDX is an annual competition between military service schools including
the US Military Academy at West Point, US Air Force Academy, Naval Postgraduate School (NPS), US Naval Academy, US Coast Guard Academy, US Merchant Marine Academy, and the Air Force Institute of Technology (AFIT). During the competition, students, as the “blue team”, were tasked to defend similar suites of network equip-ment and services against attacks. Attacks came from the “red team” which was comprised of highly trained practitioners from the NSA, the Air Force Information Warfare Center, the Navy Information Operations Center, the Army’s 1st Information Operations Command, the Marine Corps Network Operation Center, and the Army Reserve Information Operations Command. The “red team” was able to exploit the “blue team” networks with any open source or publicly available means they desired, leading to a high variation of attack methods from a reputable team of attackers.
The specific data used in this research is the network traffic collected from AFIT’s network during the CDX, as represented in Figure 3.2. All inbound and outbound network traffic was collected in libpcap format using TCPDump. Data was available for years 2003 through 2007, and 2009. Table 3.1 shows the yearly breakout including the total size (in MB) and number of packets collected per year. Having data that spans six years provides the ability to analyze changes in attack methods over time, making it less restrictive than a dataset of a lesser time span.
Table 3.1. CDX Data Set Description by Year
2003 2004 2005 2006 2007 2009 Total Size (MB) 1,639 712 704 411 931 502 4,899
Packets 5,861,337 2,888,609 1,609,533 1,130,422 10,452,163 1,808,471 23,750,535
3.4 Network Sensor
The network sensor selected for this research is Security Onion, a Linux distri-bution that is preloaded with many network security applications. The two primary
Workstations Servers Observation subnet USMA VPN VPN Observation subnet USAFA VPN VPN Observation subnet USMMA VPN VPN Observation subnet USNA VPN VPN Observation subnet USNA VPN VPN Attack network White cell Hub IDS Router
VPN Switch Printer Workstations
Router Observation VPN Switch Servers Printers Monitoring subnet VPN
Cyber defense exercise Information assurance networks
AFIT OMICRON domain Lissard domain IDS Laptop VPN Simple switch AFIT boundary router
IDS: Intrustion-detection system VPN: Virtual private network
USMA: US Military Academy at West Point USNA: US Naval Academy, Annapolis, MD
USMMA: US Merchant Marine Academy, Kings Point, NY USAFA: US Air Force Academy, Colorado Springs, CO USCGA: US Coast Guard Academy, New London, CT AFIT: Air Force Institute of Technology, Dayton, OH
Internet
Figure 3.2. CDX Network Architecture [32]
applications used in this research are Bro and Snort. Bro is used to extract connection-level features through the use of the default logs it produces along with additional customized logs. Snort is used to identify packet-level threats. The following briefly explains the configurations of the sensor. A detailed explanation of the configuration process can be found in Appendix B.
![Figure 2.6. Parallel Detection System Workflow [16]](https://thumb-us.123doks.com/thumbv2/123dok_us/9908272.2484025/35.918.173.742.102.315/figure-parallel-detection-system-workflow.webp)
![Figure 3.2. CDX Network Architecture [32]](https://thumb-us.123doks.com/thumbv2/123dok_us/9908272.2484025/50.918.183.783.225.807/figure-cdx-network-architecture.webp)
![Figure 3.11. Comparing Algorithms in ROC vs PR Space [14]](https://thumb-us.123doks.com/thumbv2/123dok_us/9908272.2484025/74.918.161.755.103.405/figure-comparing-algorithms-roc-vs-pr-space.webp)
![Figure 3.12. Calculating Figures of Merit (adapted from [27])](https://thumb-us.123doks.com/thumbv2/123dok_us/9908272.2484025/77.918.284.635.184.463/figure-calculating-figures-merit-adapted.webp)