A fullreference image quality assessment for multiply
distorted image based on visual mutual information
Article (Published Version)
http://sro.sussex.ac.uk
Zhang, Yin, Xuehan, Bai, Yan, Junhua, Xiao, Yongqi, Zhang, Wanyi, Chatwin, Chris and Young,
Rupert (2019) A full-reference image quality assessment for multiply distorted image based on
visual mutual information. Journal of Imaging Science and Technology. ISSN 1062-3701
This version is available from Sussex Research Online: http://sro.sussex.ac.uk/id/eprint/85011/
This document is made available in accordance with publisher policies and may differ from the
published version or from the version of record. If you wish to cite this item you are advised to
consult the publisher’s version. Please see the URL above for details on accessing the published
version.
Copyright and reuse:
Sussex Research Online is a digital repository of the research output of the University.
Copyright and all moral rights to the version of the paper presented here belong to the individual
author(s) and/or other copyright owners. To the extent reasonable and practicable, the material
made available in SRO has been checked for eligibility before being made available.
Copies of full text items generally can be reproduced, displayed or performed and given to third
parties in any format or medium for personal research or study, educational, or not-for-profit
purposes without prior permission or charge, provided that the authors, title and full bibliographic
details are credited, a hyperlink and/or URL is given for the original metadata page and the
content is not changed in any way.
c
Society for Imaging Science and Technology 2019
A Full-Reference Image Quality Assessment for Multiply
Distorted Image based on Visual Mutual Information
Yin Zhang and Xuehan Bai
Nanjing University of Aeronautics and Astronautics, College of Astronautics, Nanjing, 210016, China
Junhua Yan
Nanjing University of Aeronautics and Astronautics, College of Astronautics, Nanjing, 210016, China University of Sussex, School of Engineering and Informatics, Brighton BN1 9QT, UK
E-mail: [email protected]
Yongqi Xiao and Wanyi Zhang
Nanjing University of Aeronautics and Astronautics, College of Astronautics, Nanjing, 210016, China
C. R. Chatwin and R. C. D. Young
University of Sussex, School of Engineering and Informatics, Brighton BN1 9QT, UK
Abstract. A full-reference image quality assessment (FR-IQA) method for multi-distortion based on visual mutual information (MD-IQA) is proposed to solve the problem that the existing FR-IQA methods are mostly applicable to single-distorted images, but the assessment result for multiply distorted images is not ideal. First, the reference image and the distorted image are preprocessed by steerable pyramid decomposition and contrast sensitivity function (CSF). Next, a Gaussian scale mixture (GSM) model and an image distorted model are respectively constructed for the reference images and the distorted images. Then, visual distorted models are constructed both for the reference images and the distorted images. Finally, the mutual information between the processed reference image and the distorted image is calculated to obtain the full-reference quality assessment index for multiply distorted images. The experimental results show that the proposed method has higher accuracy and better performance for multiply distorted images. c 2019 Society for Imaging Science and Technology. [DOI: 10.2352/J.ImagingSci.Technol.2019.63.6.060504]
1. INTRODUCTION
In the processes of image acquisition, transmission, pro-cessing, and so on, it is likely that the distortions can be introduced to images. For example, blur appears when shooting is out of focus, and compression is inevitable when transmission is limited by bandwidth. As for noise, it can be introduced in image acquisition, processing, transmission, and so on. Thus distortions in the obtained image are usually multiply distorted. The existing full-reference image quality assessment (FR-IQA) methods are primarily for single-distorted images, and the evaluation of multiply distorted images is ineffective. Therefore, it is of great practical significant to conduct research on the quality assessment for multiply distorted images.
Received Sept. 8, 2017; accepted for publication Mar. 26, 2019; published online June 17, 2019. Associate Editor: Marius Pedersen.
1062-3701/2019/63(6)/060504/11/$25.00
Due to the variety of distortion types in the multiply distorted images, the visual quality of the images will be affected by different distortions, and mutual cancellation or mutual enhancement will occur in these effects, making the evaluation of multiply distorted images more complex than single-distorted images. Different image distortion will introduce change of image information capacity: noise will increase the information capacity; blur will damage image edge structure and reduce the information capacity; the block effect caused by JPEG compression will produce new edges in the image, which increases the information capacity. In addition, different degrees of the distortion will bring about different changes in the information capacity. Therefore, it is possible to measure the degree of distortion and assess quality of multiply distorted images by quantifying the change of information capacity. In the current image quality assessment methods [1], some scholars have proposed the use of information entropy to characterize the image quality, and achieved positive results. Sheikh et al. [2] proposed a single-distorted FR-IQA index based on the information fidelity criterion (IFC) by calculating the number of common information between the visual perception of the reference image and the distorted image. The IFC method quantifies the information shared between the reference image and the distorted image, explores the relationship between the statistical information of the image and the visual quality, and can effectively evaluate the single-distortion image quality. However, when the multiply distortion exists, the model of the IFC method is too simple to simulate the visual quality of the multiply distorted image effectively so that the subjective consistency of the evaluation result is not high. Sheikh et al. [3] then introduced the visual model based on the IFC index, and presented the index based on the visual information fidelity (VIF). The VIF index performs high subjective consistency for single-distorted
images, but the performance is still unsatisfactory for multiply distorted images. Yong, Yuan et al. [4] extracted the mutual information of the Gabor features (MIGF) of the image, and constructed a single-distortion full-reference image quality assessment index mutual information of Gabor features. Liao et al. [5] improved the performance of the SSIM metrics by mutual information weighting, and constructed an improved single-distortion full-reference image quality assessment index. Liu et al. [6] extracted the spatial and spectral entropies of the image, and proposed a single-distorted no-reference image quality assessment index spatial–spectral entropy-based quality. These methods show good performance for single-distorted images, but their performances for multiply distorted images are still unsatisfactory.
Okarma et al. [7] proposed a multiply distorted image quality assessment method which combines four indexes (CM4). In the CM4, different exponential weights are assigned initially to the four indexes IFC, noise quality measure (NQM), visual signal-to-noise ratio (VSNR), and VIF, and then they are multiplied to obtain the image quality score. Chetouani et al. [8] proposed a method combining different indexes with support vector regression (CMSVR) for multiply distorted image quality assessment. In the CMSVR, first, four indexes, SSIM, IFC, VIF, and wavelet based sharp features image quality assessment metric (WASH) [9] are selected as features. Then these features are used to train a support vector regression (SVR) model with different mean opinion score (DMOS). Finally, the trained SVR model is used to obtain image quality scores. Chaofeng Li et al. proposed [10] a multi-scale learning local phase and amplitude blind image quality assessment for multiply distorted images (MS-LQAF). First the distorted image is decomposed into three scales, and its phase congruency image (PCI), phase congruency covariance maximum image (PCCmax), phase congruency covariance minimum image (PCCmin) are constructed. Then the contrast sensitivity function (CSF) and gray level-gradient co-occurrence matrix (GCCM) features are calculated from distorted image and its PCI, PCCmax and PCCmin and mean value of intensity of PCI, PCCmax, PCCmin, and overlapping blocked local amplitude of distorted image. At last SVR is used to obtain image quality scores. CM4, CMSVR, and MS-LQAF show high performance for multiply distorted images. However, these three methods are a combination of multiple indexes, they are complex, time-consuming and difficult to apply in real-time application.
In view of the successful application of information entropy in the existing methods, the mutual information between the reference image and the multiply distorted image is calculated in this article. The smaller the mutual information, the more serious image distortion and the poorer the image quality is. So a multiply distorted image quality assessment index MD-IQA based on visual mutual information is constructed. In order to effectively calculate the visual mutual information between the reference image and the multiply distorted image, this article combines the
multi-channel characteristic [11] and the contrast sensitive characteristic of the human vision based on the single-distorted image quality evaluation method IFC. After the steerable pyramid decomposition and the CSF [12] filter, the Gaussian scale mixture (GSM) model [13], the image distortion model, and the visual distortion model are used to calculate the sub-band mutual information between the reference image and the multiply distorted image. Finally, the index MD-IQA is obtained by calculating the sum of mutual information for all sub band images.
2. IMAGE MUTUAL INFORMATION
In information theory, mutual information is a measure of the information capacity that one random variable contains about another random variable [14]. When an image is distorted, part of the information in the reference image is affected (damaged or changed) by distortion. So the reference image becomes a distorted image. When the mutual information is applied to the image quality assessment, it can be used to measure the information capacity of the distorted image containing the reference image, that is, the information capacity common to the reference image and the distorted image. Taking mutual information as the image quality assessment index can measure the degree of the distorted image.
Assume that A and B, respectively, represent the reference image and the distorted image,H(A)andH(B), respectively, represent the information entropy of the refer-ence image and the distorted image. The condition entropy
H(A|B)is the information capacity that has changed in the
reference imageArelative to the distorted imageBdue to the distortion effect. The mutual information betweenAandB
is defined as follows:
I(A;B)=H(A)−H(A|B). (1)
The mutual informationI(A;B)reflects the similarity degree
between the reference imageAand the distorted imageB, and with respect toAandBsymmetry.
I(A;B) = I(B;A)
= H(B)−H(B|A) ≥ 0.
(2)
The higher the distortion degree of image B, the less information capacity common to the reference imageAand the distorted imageB, and the mutual informationI(A;B)is closer to zero.
3. A FULL-REFERENCE IMAGE QUALITY
ASSESSMENT INDEX FOR MULTIPLY DISTORTED IMAGES BASED ON VISUAL MUTUAL
INFORMATION
In this article, a full-reference image quality assessment method MD-IQA for multiply distorted images is proposed by combining contrast sensitivity of human eyes and visual
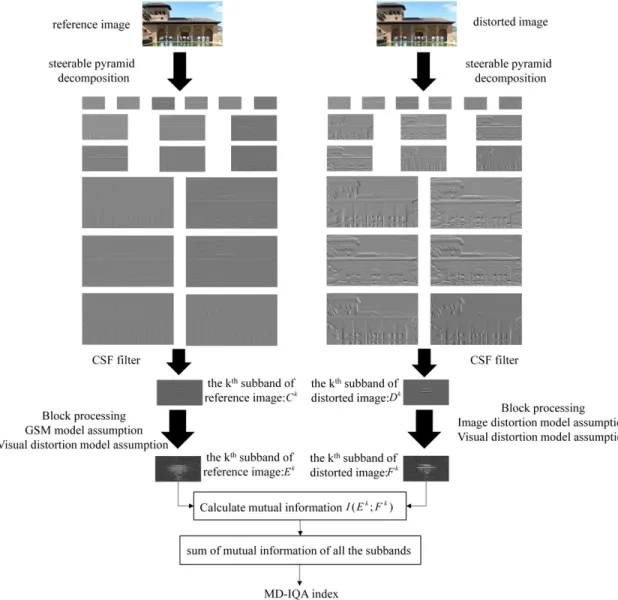
Figure 1. Flow chart of multiply distorted image quality assessment method MD-IQA.
distortion model. The flow chart of the proposed method MD-IQA is shown in Figure1.
In the initial stage of the MD-IQA method, the reference image and the distorted image are preprocessed by steerable pyramid decomposition and CSF filter to simulate the multi-channel characteristic and contrast sensitive characteristic of the human eyes. Then, the sub-bands of the reference image and the distorted image are segmented, a GSM model is modeled on the sub-band of the reference image, and an image distortion model including signal attenuation and additive noise is constructed for the sub-band of the distorted image. After that, a visual distortion model is constructed for both the reference image sub-band and the distorted image sub-band by introducing visual noise to simulate the generation of neuron noise from the human eyes to the brain. Finally, the mutual information between one reference image sub-band and one distorted image sub-band is calculated after through all above models, and the MD-IQA index is obtained by adding the mutual information of every sub-band.
3.1Steerable Pyramid Decomposition and CSF Filter
In this article, steerable pyramid decomposition and CSF filter are first used to visualize the reference image and the distorted image when calculating the multiply distorted image quality assessment index.
The steerable pyramid can decompose the image into sub-bands of different scales and different orientations, and can perform multi-scale analysis while simulating the multi-channel characteristics of human eyes. Since the perception of details of human eyes is usually dependent on the image resolution, multi-scale analysis can improve the effectiveness of the image quality evaluation method.
The reference imageAis decomposed by the steerable pyramid and divided intoKsub-bands:
A=(A1,A2, . . . ,AK) (3)
where Ak(k=1,2, . . . ,K)represents the kth sub-band of the reference imageA.
The distorted imageBis decomposed by the steerable pyramid and divided intoKsub-bands:
B=(B1,B2, . . . ,BK) (4)
whereBk(k=1,2, . . . ,K)represents thekth sub-band of the distorted imageB.
In order to highlight the perception characteristic that human eyes are more sensitive to image edges, the contrast sensitivity function (CSF) is used for filtering. For human eyes, the perception to the image contrast is not only related to the background brightness, but also to the spatial frequency. The relationship can be described by the CSF. The CSF model is [15]:
Y(f)=2.6(0.0192+0.114f)exp(−(0.114f)1.1) (5) wheref represents the spatial frequency, unit is cycle/degree. The human visual system has a certain degree of selectivity for the spatial frequency and direction of the signal. This means that, apart from the spatial frequency, the spatial angle of the image is also an important factor when simulating the perception of image signals. So the angle information is introduced intof, and the formula is:
f = π 180 arcsin 1 √ 1+d2 ·g(θ) q f2 x +fy2 (6)
where fx and fy respectively represent the horizontal and
vertical spatial frequencies, d represents the observation distance, and g(θ)is the angular frequency function. The formulas offx,fyandg(θ)are:
fx= −Q 2 −0.5 +q (7) fy= −P 2 −0.5 +p (8) g(θ)=1−w 2 cos(4θ)+ 1+w 2 (9)
whereP×Qrepresents the size of the sub-band image,(p,q)
represents the position of the corresponding pixel in the image; in Eq. (9)wrepresents the symmetrical parameter and the value is 0.7,θrepresents the azimuth between horizontal and vertical spatial frequencies, and the formula is:
θ=arctan f y fx . (10)
For thekth sub-band of the reference image and the distorted image,AkandBk, the effect of CSF is:
Ck=Ak·Yk(f) (11) Dk=Bk·Yk(f) (12)
whereCkrepresents thekth sub-band of the reference image after CSF filtering, Dk represents the kth sub-band of the distorted image after CSF filtering.
3.2Block Processing of Image Sub-bands
The reference image and the distorted image are decomposed into a plurality of sub-bands after the steerable pyramid decomposition and CSF filtering. In order to meet the requirements of the subsequent GSM model and the image distortion model, it is necessary to adopt a block processing algorithm on the sub-bands of reference image and distorted image.
Each of the sub-bands after visual preprocessing of the reference image is divided intoN non-overlapping blocks, each of which containsMcoefficients. Takingkth sub-band of the reference image (Ck) as an example,Ckis divided into
Nnon-overlapping blocks:
Ck=(CE1k,CE2k, . . . ,CENk) (13)
whereCEn(k n=1,2, . . . ,N)is thenth non-overlapping block inCk.
Correspondingly, the kth sub-band of the distorted image (Dk) is divided into:
Dk=(DEk
1,DEk2, . . . ,DEkN) (14)
whereDEkn(n=1,2, . . . ,N)is thenthnon-overlapping block inDk.
3.3GSM Model and Image Distortion Model
After taking block processing of the sub-bands, the reference image sub-band is modeled by the GSM model, and the distorted image sub-band is modeled by image distortion model.
(I) GSM model
Sheikh et al. described the GSM model as follows [2]: a GSM is a random field that can be expressed as a product of two independent random fields. A GSM vector field
C= { ECt :t∈ {1,2, . . . ,T}}, whereCEidenotes a GSM vector
andTdenotes the number of vectors in the vector field, can be expressed as:
C=SU= {StUEt :t∈ {1,2, . . . ,T}} (15)
whereS= {St:t∈ {1,2, . . . ,T}}is an independent random
scalar field, U = { EUt:t∈ {1,2, . . . ,T}} is a zero-mean
random Gaussian vector field.
In this article, thekthsub-band of the reference imageCk
is regarded as a GSM vector field, available from (15):
Ck= {Sk nUE
k
n:n∈ {1,2, . . . ,N}}. (16)
At the same time available from (13):
Ck= { ECnk:n∈ {1,2, . . . ,N}}. (17)
Then each non-overlapping blockCEnk can be regarded as a
GSM vector, so thatCEnkcan be decomposed into:
E Cnk=Sk
whereSknis the size factor ofCEnk, which is a positive scalar;UEnk
is a Gaussian vector with the distributionUEnk∼N(0,CUk),
that is, the Gaussian distribution with mean 0 and covariance matrixCUk.CUkis a covariance matrix related toC
k, the size
ofCUk isM×M.CUk can be calculated byC
k(in the form
of Eq. (13)): CUk= 1 M(C k−µk)( Ck−µk)T (19) µk=(µk 1, µ k 2, . . . , µ k N) (20)
whereµkn(n=1,2, . . . ,N)is the mean of coefficients inCEnk. For a particular reference image, sk=(sk
1,sk2, . . . ,skN)
donates a realization ofSk=(Sk
1,Sk2, . . . ,SkN)in GSM model
of Ck. skn can be calculated by the maximum likelihood
estimation method: (skn)2=( E Cnk)TC −1 Uk E Cnk N . (21)
The following conclusions can be obtained by establish-ing the GSM model above for reference image:
(1) in the same sub-bandCk, each non-overlapping blockCEnk
is independent of each other;
(2) in the same sub-band Ck,UEnk of each non-overlapping
blockCEnkhas the same distribution, and is independent ofSkn;
(3) the distribution of the non-overlapping block CEnk is determined by the size factor Skn, and it satisfiesCEnk∼ N 0, (skn)2CUk
, that is, it fits the Gaussian distribution with a mean of 0 and a covariance matrix of(skn)2CUk. (II) Image Distortion Model
The image distortion model describes the process of image damage. The most important reason for establishing an image distortion model is to provide a basis for subsequent mathematical processing and with low computational com-plexity.
In this article, the distortion process is simplified as signal attenuation and additional noise. That is, CEnk of the
reference image andDEknof the distorted image satisfy:
E
Dkn=gnkCEnk+ EVnk (22)
where gnk represents the signal attenuation factor, which is
a scalar;VEnk represents a zero-mean independent Gaussian
white noise vector, of which the covariance is CVn,k =
(σk
v,n)2I, whereI denotes the identity matrix.
The image distortion model can be approximated as a combination of local blur and local noise. The attenuation factorgnk reflects the loss of signal energy due to blur distortion.VEnkrepresents additional noise,
character-izing the increase in the amount of information due to noise distortion. Although the model cannot explain the blocking effect distortion, it provides a reasonable first-order approximation. The synthetic image obtained by the distortion model and the real blocking effect image have
similar image quality, [3] therefore the distortion model can reflect the blocking effect on image perception quality.
Since the input signal (CEnk) and the output signal (DEkn) are known, the values of the parametersgnkandσvk,ncan be estimated from the linear regression:
gnk=Covd(Cn,k Dkn)Covd(Cnk,Cn)k −1
(23)
(σk
v,n)2=Covd(Dkn,Dkn)−gnkCovd(Cnk,Dkn) (24)
whereCovd(X,Y)represents the covariance ofXandY.
3.4Visual Distortion Model
The visual distortion model simulates the process of images transfer from the eye to the brain, mainly by introducing visual noise to interpret neurons in the human eye.
After introducing visual distortion, the non-overlapping block of reference image sub-band and the distorted image sub-bandCEnk andDEknchange intoEEnk andFEnk; the formulas are: E Enk= ECnk+ EOkn (25) E Fnk= EDkn+ EO 0k n (26) whereOEknandOE 0k
n, respectively, represent the visual noises of
the reference image and the distorted image.
Assume that the visual noise is a zero-mean Gaussian white noise, let:
E O0nk=gk
nOE k
n. (27)
Then, the covariances ofOEknandOE
0 k n are: COn,k=σ 2 oI (28) CO0n,k=(gnkσo)2I (29)
where σo2 is the visual noise variance, which is the main
parameter of the visual distortion model. The optimal value ofσo2is determined by several experiments. In this article,σo2
is set to be 0.4.
According to Eqs. (22), (25)–(27), the relationship betweenEEknandFEnkis:
E Fnk=gk nCE k n+ EV k n+ EO 0k n =gk nEE k n+ EV k n. (30)
3.5Multi-distortion Image Quality Assessment Index
After the GSM model, the image distortion model and the visual distortion model described above, thekthsub-band of the reference image and the distorted image received by the brain can be expressed as:
Ek=(EEk
1,EE2k, . . . ,EENk) (31) Fk=(FE1k,FE2k, . . . ,FENk). (32)
In this method, I(Ek;Fk|sk) is used to represent the
mutual information betweenEEnk andFEnk. According to the three conclusions of the GSM model and Eqs. (2), (18)–(32), the formula ofI(Ek;Fk|sk)is:
I(Ek;Fk|sk)= N X n=1 I(EEnk; EFk n|skn) = N X n=1 H(FEnk|skn)−H(FEnk| EEnk,skn) = N X n=1 h(gnkCEnk+ EVk n+ EO 0k n|s k n)−h(VE k n|s k n) =1 2 N X n=1 log2 (gnkskn)2CUk+(σ k v,n)2I+(gnkσo)2I (σvk,n)2I ! (33) where |·| denotes the determinant, h(Z) represents the
entropy of the continuous random variable Z, and Z ∼ N(0, σ2). The formula ofh(Z)is:
h(Z)=1
2log22πeσ
2.
(34) Since the covariance matrixCUkis symmetric, soCUkcan be
written as:
CUk=Qk3kQ
T
k (35)
whereQkis a standard orthogonal matrix,3kis a diagonal
matrix, whose diagonal eigenvalue isλkj.
By matrix decomposition, Eq. (33) can be expressed as:
I(Ek;Fk|sk)=1 2 N X n=1 N X j=1 log2 1+(g k nskn)2λkj +(gnkσo)2 (σk v,n)2 ! . (36) Assuming that the sub-bands are independent of each other, then the sum of mutual information of all the sub-bands is obtained as the final image quality assessment index:
MD-IQA= K
X
k=1
I(Ek;Fk|sk) (37)
wherekindicates the serial number of the sub-bands. The smaller the value of the index MD-IQA, the more serious the image distortion and the poorer the image quality. 4. EXPERIMENTAL RESULTS AND ANALYSIS
10 currently single-distorted IQA methods are compared with the proposed method MD-IQA in the multiply dis-torted image database LIVE-MD [16] and MDID (Multiply Distorted Image Database) [17]. The subjective consistency of each method was compared and the performance of MD-IQA was verified by RMSE (Root Mean-Squared Error), PLCC (Pearson Linear Correlation Coefficient), SROCC (Spearman Rank Order Correlation Coefficient), and KROCC (Kendall Rank Order Correlation Coeffi-cient) [18]. All experiments were performed on a Dell OptiPlex desktop computer, which has an Intel Core i7-4790 processor with 8G memory. The operating system is win10, and the experimental platform is MATLAB R2014a.
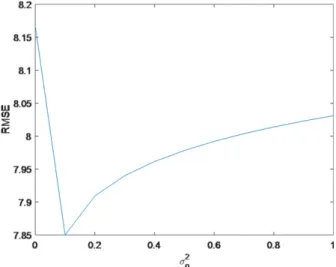
Figure 2. Comparison of the RMSE between different values ofσ2
o.
4.1Experimental Database and Subjective Consistency Evaluation Index
There are two categories of multiply distorted images in the selected database LIVE-MD. One category contains blur and noise distortion, and the other one contains blur and JPEG compression distortion. Each category contains 15 reference images and 225 distorted images, and each distortion is divided into four levels: distortion free, distortion level 1, distortion level 2 and distortion level 3. The subjective results of the database LIVE-MD are given in the form of different mean opinion score (DMOS), and the range of DMOS is [0,100].
The performance of the objective image quality assess-ment method is measured by calculating the correlation coefficient between the evaluation scores of the objective method and the DMOS given in the experimental database. In this article, RMSE, PLCC, SROCC, and KROCC are selected to compare the proposed method MD-IQA and other methods [18]. The smaller the RMSE, and the closer the PLCC, SROCC, and KROCC are to 1, indicating the higher accuracy of the method and the better performance of the method.
4.2The Selection of the Optimal Value of Visual Noise Varianceσo2
The performance of the full-reference multiply distorted image quality assessment index MD-IQA is related to the visual noise varianceσo2. In this article, the RMSE indexes of
the MD-IQA corresponding to different values of theσo2were obtained on the LIVE-MD database. The value ofσo2when RMSE is the smallest is selected. Figure2shows RMSE values for different values ofσo2in experiments. Smaller RMSE value
indicates higher accuracy of the MD-IQA. When the RMSE value is the smallest, the accuracy of MD-IQA is the highest. At this time the value ofσo2is 0.1, which is selected as the optimal value of the visual noise variance.
(a) (b) (c)
(d) (e) (f)
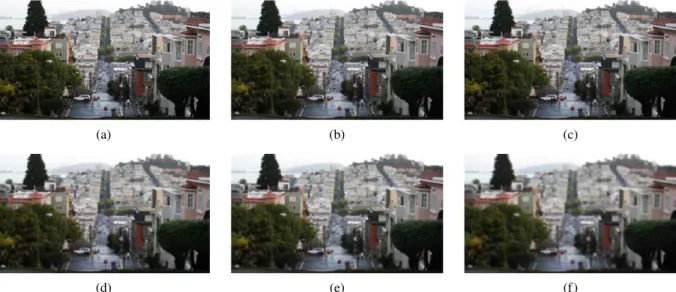
Figure 3. Subjective and objective scores of multiply distorted images with different degrees of blur and JPEG compression. (a) reference image, (b) blur level 1+JPEG compression level 1 DMOS=51.21 MD-IQA=7.0492, (c) blur level 1+JPEG compression level 2 DMOS=56.11 MD-IQA= 6.9378, (d) blur level 2+JPEG compression level 1 DMOS=63.42 MD-IQA=6.1762, (e) blur level 2+JPEG compression level 2 DMOS=67.16 MD-IQA=6.0898, (f) blur level 3+JPEG compression level 3 DMOS=80.00 MD-IQA=4.6681.
4.3Subjective Consistency of MD-IQA
In this article, subjective consistency experiments were performed on all multiply distorted images in the LIVE-MD database. Figure 3shows the representative examples that are sampled from all the images to illustrate the subjective consistency of MD-IQA. As shown in Fig. 3, four images are selected from the multiply distorted database LIVE-MD, where image (a) is the reference image, images (b)–(f) are distorted images from image (a) with different degrees of blur and JPEG compression distortions. The objective score and DMOS of each distorted image in Fig.3were given.
The higher the DMOS, the worse the image quality is. The image quality monotonically decreases from Fig. 3(b) to3(f). Correspondingly, the scores of the MD-IQA method significantly decreased with the decrease of image quality, indicating that the MD-IQA method has high subjective– objective consistency.
4.4Comparison of Subjective Consistency with Other IQA Methods in LIVE-MD
The subjective consistency scores of the proposed method MD-IQA and 12 currently commonly used IQA methods for multiply distorted images in database LIVE-MD are shown in TableI. The 13 currently commonly used IQA methods include: PSNR (peak signal-to-noise ratio), WSNR (weighted signal-to-noise ratio), SSIM [19] (structural similarity), MS-SSIM [20] (multi-scale SSIM), CW-SSIM [21] (SSIM in complex wavelet domain), VIF [3], VIFp [3] (VIF in pixel domain), IFC [2], FSIM [22] (feature similarity), VSI [23] (visual saliency-induced index), as well as methods CM4[7] CMSVR [8], and MS-LQAF [10], which combine multiple indexes. In the CM4, first, different exponential weights are assigned to the four indicators IFC, NQM, VSNR, and VIF, and then they are multiplied to obtain the image quality score. In the CMSVR, first, four indexes, SSIM, IFC, VIF,
and WASH [9] are selected as features, then these features are used to train a support vector regression (SVR) model with DMOS. Finally, the trained SVR model is used to obtain image quality scores. In the experiment of CMSVR, 75% of all distorted images in LIVE-MD are randomly selected as the training set and the remaining 25% as the test set, then the training set and the test set are entered into the SVR model for training and testing. The above experiment is repeated 1000 times to obtain the median of the subjective consistency performance of CMSVR. In TableI, bold font indicates that the correlation coefficient of the method is in the top four among all methods.
Table I shows that the MD-IQA method has RMSE values lower than 8, PLCC and SROCC values around 0.9, and KROCC values more than 0.7, which indicates that the MD-IQA method achieves excellent performance for the two types of multiply distorted images.
Having compared the results of different IQA methods in Table I, it is concluded that the existing PSNR, WSNR and other indicators which based on the image gray value calculation are not applicable to multiply distorted images. The subjective consistency scores of these methods are unsatisfactory. The performances of VIF, FSIM, VIFp, IFC,
and VSI are better, but still could not reach that of the proposed method. In LIVE-MD, the proposed method MD-IQA still ranks the forefront though the correlation values of CM4, CMSVR, and MS-LQAF are slightly higher than those of MD-IQA. Furthermore, the MD-IQA is more suitable for real-time applications than CM4, CMSVR, and MS-LQA because the three methods combine multiple indexes, rendering the algorithm complex and the running time long.
The scatter plots of the subjective and objective consis-tency scores of different IQA methods for blur and JPEG compression multiply distorted images are shown in Figure4.
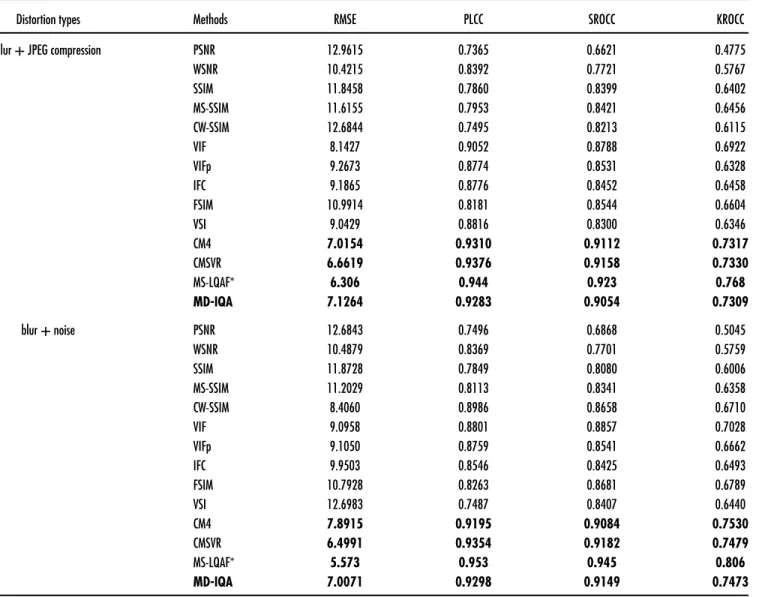
Table I. Comparison of the subjective consistency of different IQA methods in LIVE-MD.
Distortion types Methods RMSE PLCC SROCC KROCC
blur+JPEG compression PSNR 12.9615 0.7365 0.6621 0.4775
WSNR 10.4215 0.8392 0.7721 0.5767 SSIM 11.8458 0.7860 0.8399 0.6402 MS-SSIM 11.6155 0.7953 0.8421 0.6456 CW-SSIM 12.6844 0.7495 0.8213 0.6115 VIF 8.1427 0.9052 0.8788 0.6922 VIFp 9.2673 0.8774 0.8531 0.6328 IFC 9.1865 0.8776 0.8452 0.6458 FSIM 10.9914 0.8181 0.8544 0.6604 VSI 9.0429 0.8816 0.8300 0.6346 CM4 7.0154 0.9310 0.9112 0.7317 CMSVR 6.6619 0.9376 0.9158 0.7330 MS-LQAF* 6.306 0.944 0.923 0.768 MD-IQA 7.1264 0.9283 0.9054 0.7309 blur+noise PSNR 12.6843 0.7496 0.6868 0.5045 WSNR 10.4879 0.8369 0.7701 0.5759 SSIM 11.8728 0.7849 0.8080 0.6006 MS-SSIM 11.2029 0.8113 0.8341 0.6358 CW-SSIM 8.4060 0.8986 0.8658 0.6710 VIF 9.0958 0.8801 0.8857 0.7028 VIFp 9.1050 0.8759 0.8541 0.6662 IFC 9.9503 0.8546 0.8425 0.6493 FSIM 10.7928 0.8263 0.8681 0.6789 VSI 12.6983 0.7487 0.8407 0.6440 CM4 7.8915 0.9195 0.9084 0.7530 CMSVR 6.4991 0.9354 0.9182 0.7479 MS-LQAF* 5.573 0.953 0.945 0.806 MD-IQA 7.0071 0.9298 0.9149 0.7473
The values in the row of MS-LQAF* are experimental results in the original paper.
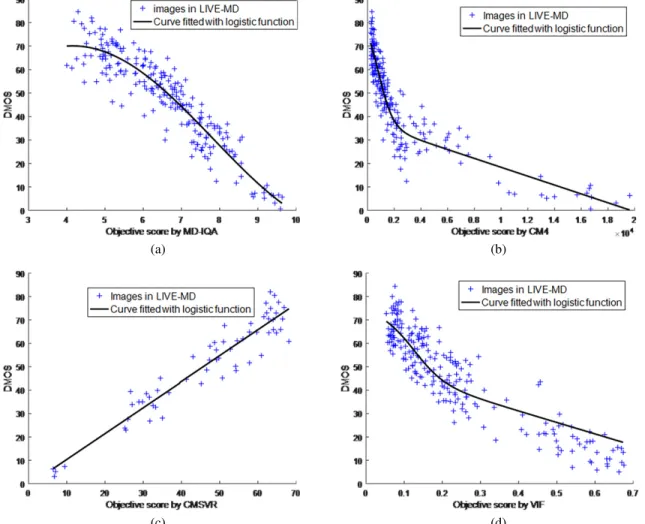
The scatter plots of the subjective and objective consistency scores of different IQA methods for blur and noise multiply distorted images are shown in Figure5. Limited by space, we have selected four methods for display, which are MD-IQA, CM4, CMSVR, and VIF. The x-axis denotes the objective score obtained by the image quality assessment method and the y-axis denotes the subjective score obtained by human eyes. Fig.4and Fig.5show that, in multiply distorted images, the scatter points of MD-IQA are more concentrated and the deviation of the points from the fitting curves is smaller, indicating better objective–subjective consistency.
4.5Comparison of Subjective Consistency with Other IQA Methods in MDID
MDID is an image database especially designed for evaluat-ing the performance of image quality assessment algorithms on multiply distorted images. It contains 20 reference images and 1600 distorted images. The reference images are
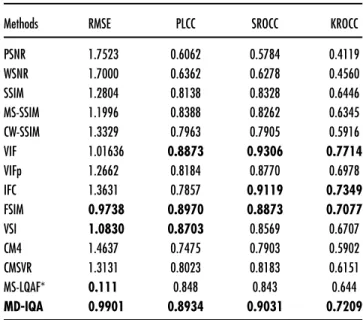
selected from a series of classical databases. Five distortions are introduced to obtain the distortion images, including Gaussian Noise, Gaussian Blur, Contrast Change, JPEG, and JPEG2000. Every distorted image is derived from degrading the reference image with random types and random levels of distortions. The subjective consistency scores of the proposed method MD-IQA and 13 commonly used IQA methods for multiply distorted images in MDID are shown in TableII. The 13 commonly used IQA methods include: PSNR, WSNR, SSIM, MS-SSIM, CW-SSIM, VIF, VIFp, IFC, FSIM, VSI as well as methods CM4, CMSVR, and MS-LQAF. In TableII, bold font indicates that the correlation coefficient of the method is in the top four among all methods.
Table II shows that the MD-IQA method has RMSE values lower than 1, PLCC and SROCC values are around 0.9, and KROCC values are more than 0.7, which indicates that the MD-IQA method achieves excellent performance for multiply distorted images.
(a) (b)
(c) (d)
Figure 4. Scatter plots of the subjective and objective consistency scores of different IQA methods for blur–JPEG compression multiply distorted images. (a) MD-IQA, (b) CM4, (c) CMSVR, (d) VIF.
Table II. Comparison of the subjective consistency of different IQA methods in MDID.
Methods RMSE PLCC SROCC KROCC
PSNR 1.7523 0.6062 0.5784 0.4119 WSNR 1.7000 0.6362 0.6278 0.4560 SSIM 1.2804 0.8138 0.8328 0.6446 MS-SSIM 1.1996 0.8388 0.8262 0.6345 CW-SSIM 1.3329 0.7963 0.7905 0.5916 VIF 1.01636 0.8873 0.9306 0.7714 VIFp 1.2662 0.8184 0.8770 0.6978 IFC 1.3631 0.7857 0.9119 0.7349 FSIM 0.9738 0.8970 0.8873 0.7077 VSI 1.0830 0.8703 0.8569 0.6707 CM4 1.4637 0.7475 0.7903 0.5902 CMSVR 1.3131 0.8023 0.8183 0.6151 MS-LQAF* 0.111 0.848 0.843 0.644 MD-IQA 0.9901 0.8934 0.9031 0.7209
In MDID, the correlation values of MD-IQA are higher than those of CM4, CMSVR, and MS-LQAF. The indexes of
MD-IQA, meanwhile, all rank the forefront. However, those of CM4, CMSVR and MS-LQAF are not at the front except the RMSE of MS-LQAF. Although indexes of FSIM are all at the front, and the VIF, IFC as well as VSI also perform well in MDID, none of these four methods rank the forefront in LIVE-MD. So MD-IQA has good robustness for different databases.
4.6Time Consumption of MD-IQA
The mean time spent respectively by the eight well-performing IQA methods (FSIM, VSI, VIF, VIFp, IFC, CM4,
CMSVR, and MD-IQA) to obtain objective scores of all images in the LIVE-MD database are showed in TableIII. TableIIIshows that the mean time spent by the proposed MD-IQA method is far less than those spent by CM4 and CMSVR. On average, the proposed MD-IQA method spent 2.0483 and 1.9111 seconds less than the VIF method and the IFC method, respectively. It only spent 1.0726, 1.1773, and 1.2817 seconds longer than the FSIM method, the VSI method, and the VIFp method, respectively. Thus
the proposed MD-IQA method has high evaluation and operation efficiency.
(a) (b)
(c) (d)
Figure 5. Scatter plots of the subjective and objective consistency scores of different IQA methods for blur–noise multiply distorted images. (a) MD-IQA, (b) CM4, (c) CMSVR, (d) VIF.
Table III.Mean time obtaining objective scores of all images in the LIVE-MD by different IQA methods.
FSIM VSI VIF VIFp IFC CM4 CMSVR MD-IQA Mean time (s) 0.4106 0.3059 3.5315 0.2015 3.3943 7.9027 7.7355 1.4832
5. CONCLUSION
In this article, an FR-IQA method for multiply distorted im-ages is proposed based on visual mutual information. In this method, the reference image and the distorted image are first visualized by the steerable pyramid decomposition and the contrast sensitivity function to simulate the multi-channel characteristic and contrast sensitivity of the human eye. Then the GSM model is constructed for the reference image, and the image distortion model with signal attenuation and additional noise is constructed for the distorted image. After that, the visual noise is introduced into the reference image and the distorted image. Finally, the mutual information between the reference image and the distorted image is calculated to construct the multi-distortion FR-IQA index MD-IQA. The experimental results in LIVE-MD and MDID show that the proposed method has high consistency with
subjective scores for multiply distorted images. The research of this article mainly focuses on common multiply distorted images. The research for gamut mapping contained multiply distorted images is not included and will be addressed in future research.
ACKNOWLEDGMENTS
This work was supported by the National Natural Science Foundation of China (61471194, 61705104), Science and Technology on Avionics Integration Laboratory and Aeronautical Science Foundation of China (20155552050), the Natural Science Foundation of Jiangsu Province (BK20170804), and National Defense Science and Technology Special Innovation Zone Project.
REFERENCES
1Z. Wang and A. C. Bovik,Modern Image Quality Assessment(Morgan and
Claypool Publishing Company, New York, 2006), pp. 55–63.
2H. R. Sheikh, A. C. Bovik, and V. G. De, ‘‘An information fidelity criterion
for image quality assessment using natural scene statistics,’’IEEE Trans. Image Process.14, 2117–2128 (2005).
3H. R. Sheikh and A. C. Bovik, ‘‘Image information and visual quality,’’
4Y. Ding, Y. Zhang, and X. Wang, ‘‘Perceptual image quality assessment
metric using mutual information of Gabor features,’’J. Sci. China Inf. Sci. 57, 1–9 (2014).
5Y. L. Liao, ‘‘An improved image quality assessment method based on
mutual information,’’ J. Computer Digital Engineering43, 1871–1874 (2015).
6L. Liu, B. Liu, and H. Huang, ‘‘No-reference image quality assessment
based on spatial and spectral entropies,’’ J. Signal Process. Image Commun.29, 856–863 (2014).
7K. Okarma, ‘‘Quality assessment of images with multiple distortions using
combined metrics,’’J. Elektronika Ir Elektrotechnika20, 128–131 (2014).
8A. Chetouani, ‘‘An image quality metric with reference for multiply
distorted image,’’ Int’l. Conf. on Advanced Concepts for Intelligent Vision Systems (ACIVS)(Springer International Publishing, Lecce, 2016), pp. 477–485.
9M. Reenu, D. David, and S. S. A. Raj, ‘‘Wavelet Based Sharp Features
(WASH): An Image Quality Assessment Metric Based on HVS,’’
Int’l. Conf. on Advanced Computing, Networking and Security (IEEE, Piscataway, NJ, 2014), pp. 79–83.
10C. Li, Y. Zhang, X. Wu, and Y. Zheng, ‘‘A multi-scale learning local phase
and amplitude blind image quality assessment for multiply distorted images,’’J. IEEE Access6, 64577–64586 (2018).
11A. Ninassi, O. L. Meur, and P. L. Callet, ‘‘On the performance of human
visual system based image quality assessment metric using wavelet domain,’’ Proc. SPIE6806, 680610–680621 (2008).
12F. Q. Kong, ‘‘Image quality assessment metrics based on human visual
system,’’ J. Image Graphics16, 1184–1191 (2011).
13M. J. Wainwright and E. P. Simoncelli, ‘‘Scale mixtures of Gaussians and
the statistics of natural images,’’ J. Gayana68, 609 (2004).
14T. M. Cover and J. A. Thomas,Elements of Information Theory(Tsinghua
University Press, Beijing, 1991), pp. 155–183.
15K. N. Ngan, K. S. Leong, and H. Singh, ‘‘Cosine transform coding
incorporating human visual system model,’’ Cambridge Symposium-Fiber/lase(International Society for Optics and Photonics, Cambridge, 1986), pp. 165–171.
16D. Jayaraman, A. Mittal, and A. K. Moorthy, ‘‘Objective quality assessment
of multiply distorted images,’’ 2012 Conf. Record of the Forty Sixth Asilomar Conference on Signals, Systems and Computers (ASILOMAR)
(IEEE, Piscataway, NJ, 2013), pp. 1693–1697.
17W. Sun, F. Zhou, and Q. Liao, ‘‘MDID: A multiply distorted image
database for image quality assessment,’’ J. Pattern Recognition 61, 153–168 (2017).
18Z. M. Wang, ‘‘Review of no-reference image quality assessment,’’
Acta Autom. Sin.411062–1079 (2015).
19Z. Wang, A. C. Bovik, and H. R. Sheikh, ‘‘Image quality assessment: from
error visibility to structural similarity,’’IEEE Trans. Image Process.13, 600–612 (2004).
20Z. Wang, E. P. Simoncelli, and A. C. Bovik, ‘‘Multiscale structural
similarity for image quality assessment,’’The Thirty-Seventh Asilomar Conf. on Signals, Systems & Computers(IEEE, Piscataway, NJ, 2004), pp. 1398–1402.
21G. Yang, A. Rehman, and W. Zhou, ‘‘CW-SSIM based image
classifica-tion,’’IEEE Int’l. Conf. on Image Processing(IEEE, Piscataway, NJ, 2011), pp. 1249–1252.
22L. Zhang, D. Zhang, and X. Mou, ‘‘FSIM: A feature similarity index for
image quality assessment,’’IEEE Trans. Image Process.20, 2378–2386 (2011).
23L. Zhang, Y. Shen, and H. Li, ‘‘VSI: a visual saliency-induced index for
perceptual image quality assessment,’’J. IEEE Trans. Image Process.23, 4270–4281 (2014).