Visual Interaction with Dimensionality Reduction:
A Structured Literature Analysis
Dominik Sacha, Leishi Zhang, Michael Sedlmair, John A. Lee, Jaakko Peltonen, Daniel Weiskopf, Stephen North, Daniel A. Keim
Abstract— Dimensionality Reduction (DR) is a core building block in visualizing multidimensional data. For DR techniques to be useful in exploratory data analysis, they need to be adapted to human needs and domain-specific problems, ideally, interactively, and on-the-fly. Many visual analytics systems have already demonstrated the benefits of tightly integrating DR with interactive visualizations. Nevertheless, a general, structured understanding of this integration is missing. To address this, we systematically studied the visual analytics and visualization literature to investigate how analysts interact with automatic DR techniques. The results reveal seven common interaction scenarios that are amenable to interactive control such as specifying algorithmic constraints, selecting relevant features, or choosing among several DR algorithms. We investigate specific implementations of visual analysis systems integrating DR, and analyze ways that other machine learning methods have been combined with DR. Summarizing the results in a “human in the loop” process model provides a general lens for the evaluation of visual interactive DR systems. We apply the proposed model to study and classify several systems previously described in the literature, and to derive future research opportunities.
Index Terms—Interactive visualization, machine learning, visual analytics, dimensionality reduction
1 INTRODUCTION
Dimensionality Reduction (DR) is one of the major data abstraction techniques in Visual Analytics (VA). In a typical setup, data is pro-cessed by a DR algorithm, and the output is visualized and presented to the analyst (Figure 1). DR aims at representing multidimensional data in low-dimensional spaces, while preserving most of its relevant structure, such as outliers, clusters, or underlying manifolds [36]. DR is commonly applied to map data from many dimensions down to just 3 or 2, so that salient structures or patterns can be perceived while exploring data visually, for example distances between data points in a scatterplot. It is also used as preprocessing for other algorithms, to improve performance by mitigating the curse of dimensionality [15].
Faced with a plethora of existing DR methods [54], it can be difficult for analysts to choose a good one, interpret the results, and apply DR to the best advantage in a broader VA process. A common approach to overcome this challenge is to involve analysts more closely, enabling them to investigate and adapt standard methods through interactive visualizations [39]. In such situations, tight integration of algorithmic techniques and visualizations is essential. Contributing tools that sup-port this duality is one of the major goals of VA [34]. Indeed, many VA
• Dominik Sacha is with the University of Konstanz, Germany. E-mail: [email protected]
• Leishi Zhang is with the Middlesex University, UK. E-mail: [email protected]
• Michael Sedlmair is with the University of Vienna, Austria. E-mail: [email protected]
• John A. Lee is a Research Associate with the Universit´e catholique de Louvain (UCL/SSS/IREC/MIRO) and with the Belgian F.R.S.-FNRS. E-Mail: [email protected]
• Jaakko Peltonen is with Helsinki Institute for Information Technology HIIT, Aalto University, and with the University of Tampere, Finland.
E-mail: [email protected]
• Daniel Weiskopf is with VISUS, University of Stuttgart, Germany. E-mail: [email protected]
• Stephen C. North directs Infovisible LLC, Oldwick, U.S.A. and graphviz.org. E-mail: [email protected]
• Daniel A. Keim is with the University of Konstanz, Germany. E-mail: [email protected]
Manuscript received xx xxx. 201x; accepted xx xxx. 201x. Date of Publication xx xxx. 201x; date of current version xx xxx. 201x. For information on obtaining reprints of this article, please send e-mail to: [email protected]. Digital Object Identifier: xx.xxxx/TVCG.201x.xxxxxxx
Fig. 1: A basic DR pipeline maps data to a DR algorithm. The results are visualized and presented to the analyst. Interaction feeds back to the pipeline components.
applications have been proposed that offer solutions for specific DR methods and analysis problems. In these examples, the goal is usually to support the analyst in steering the underlying algorithms through effective interactions in a visual interface (e.g., [6]), a concept that has become known as “semantic interaction” [18].
Despite these efforts, more general solutions that blend machine learning and VA still do not exist. Yet, it is these more general tools that are needed to deal successfully with real-world challenges [21, 48]. Aiming at a more general understanding of how to integrate algorithmic and visual components, a wide variety of theoretical VA models and frameworks have been proposed [12, 20, 34, 47, 48]. These models, however, often focus on high-level, abstract views, and fail to successfully characterize how a strong interplay between algorithms and visualizations would be realized and exploited.
To better understand the integration of DR and visual user interfaces, we formed an interdisciplinary group of VA and machine learning re-searchers. The motivating questions considered were“Exactly how do analysts interact with the DR pipeline?” and“How can we incor-porate our findings into the interactive DR process?”. To answer these questions, we conducted a semi-automated review of 1850 papers from the visualization and VA literature. In the first step, 377 relevant papers were selected and subsequently reviewed to identify specific examples of how DR interactions are realized, and to get a comprehen-sive, well-grounded understanding of the overall area. We summarize our main findings in the form of seven guiding scenarios that describe ways of combining DR with visualization (to an extent, inspired by previous work on guiding scenarios for visualization evaluation [35]) (Section 4). We also present some relevant statistics about DR and interaction techniques (Section 5). To relate our work to existing theo-retical models in VA, we incorporate the findings of the literature study in a conceptual process for interactive DR [47]. We illustrate how such models describe and support reasoning about dedicated systems, and enumerate five open research opportunities derived from our analysis (Section 6). Finally, we consider limitations of our work, and outline topics we plan to address in the future (Section 7 and 8).
2 RELATEDWORK
This study is related to previous work in several ways: it is concerned with general theoretical models of VA and their relationship to machine learning; it makes use of DR methods; it adopts basic ways of inter-acting with data visualizations; and it is related to the general idea of self-reflection in the visualization and VA community.
2.1 Theoretical Models
In the standard VA model [34], the discovery process is characterized by interaction between data, models of the data, visualizations, and the analyst. User interaction in this framework is aimed at model building and parameter refinement. Sacha et al. [48] extended it to describe the human knowledge generation process. The extended model clarifies the role of the analyst in knowledge generation, and highlights the impor-tance of tight integration of human and machine by enabling interaction with the system. The previous models apply to VA in a generic manner. In contrast, the study presented here focuses specifically on interacting with DR methods. Another framework describes the problem of DR as a two-stage process [12]: it first maps high-dimensional data to a lower-dimensional space, then allows another stage to reduce it to 2D for visualization. While this framework generalizes specific DR methods, it focuses on a specific application to clustered data and is limited to the two-stage process as described. The framework for observation-level interaction with statistical models [20] focuses on interaction by direct manipulation of visualization by different projection techniques. There-fore, it yields a generic approach toward interacting with the output of DR methods, which is one part of our human-in-the-loop process model; i.e., observation-level interaction directly fits in our proposed process of interaction with DR methods. Another general model is semantic interaction [18], taking acquired interaction data as a means to build user models and guide the VA system.
2.2 Surveys of DR and Interaction Techniques
DR maps data into fewer dimensions aiming to preserve structure like cluster gaps or local manifold continuity. In linear DR output axes are linear combinations of original features, for example directions of largest variation in principal component analysis (PCA), maximally statistically independent directions in independent component analysis (ICA) [26], directions of maximal between-class and minimal within-class variation in linear discriminant analysis (LDA), or directions of maximal correlation between feature subsets in canonical correlation analysis (CCA). Nonlinear DR finds either a mapping function or only output coordinates for the data set, interpreted through proximities or distances of output data; for example, mappings are sought to preserve pairwise data distances in multidimensional scaling (MDS), small distances in Sammon mapping, distances along a neighborhood graph in Isomap, or neighborhood relationships in neighbor embedding methods [54, 55]. Some methods seek mappings onto a regular grid of units as in self-organizing maps (SOMs) or generative topographic mapping (GTM). Details on PCA, MDS, Sammon mapping, Isomap, SOM, and GTM are available in books such as [36] and for LDA and CCA in [1].
Van der Maaten et al. [54] offer a comparative review of the state of the art in DR techniques, focusing on the performance of nonlinear techniques from the machine learning perspective. Similarly, Wism¨uller et al. [57] survey nonlinear DR, manifold and topological learning tech-niques. Bengio et al. [3] give an overview on representation learning in the context of deep learning. However, all the aforementioned works do not take into account VA or user interaction. A survey by Liu et al. [39] covers visualization of high-dimensional data, including DR as one of the main techniques. They include a short discussion of interaction, and embed examples into the traditional visualization pipeline. How-ever, they focus on general interaction techniques and not specifically how users interact with DR. Furthermore, they enumerate interactive model manipulation as a future research opportunity. Similarly, Buja et al. [9] review interaction techniques in the general setting of high-dimensional data visualization. Hoffman and Grinstein [24] and Bertini and Lalanne [4] discuss visualization methods for high-dimensional
Fig. 2: Our four stage analysis process: 1. Automated filtering, 2. Manual filtering, 3. Manual coding, 4. Manual sample validation. data mining, including projection and interaction methods. Keim [33] structures such visualization approaches according to the type of data to be visualized, the actual visualization technique, and the interaction and distortion method. However, none of these surveys performed a systematic exploration of the existing literature, nor did they focus on interaction techniques for DR.
2.3 Interaction Taxonomies
Our study addresses interaction in the context of DR. Therefore, re-lated work includes general models of interaction for visualization. For example, Yi et al. [58] identify seven interaction method categories: select, explore, reconfigure, encode, abstract/elaborate, filter, and con-nect. Brehmer and Munzner [7] provide a comprehensive description of visualization tasks, leading to a multi-level typology of abstract tasks (which includes the ones by Yi et al.). However, model interactions only arise in tasks they call “aggregate” or “derive” tasks. Von Lan-desberger et al. [56] define an interaction taxonomy that is suitable for tracking and analyzing user actions in VA, and provides two types of data processing interactions: data changes, such as editing or selecting data, and processing changes, such as scheme or parameter changes. In contrast, our work focuses less on a general description of user tasks, but rather on the process of interacting with DR methods.
2.4 Self-Reflection in the Visualization and VA Community Because our study is based on a systematic review, coding, and anal-ysis of previous work in the visualization and VA community, it is also related to previous work on self-reflection of empirical studies in information visualization [35], evaluation in visualization research in general [28], or affordance in human computation and human-computer interaction [14]. While we adopt the methodology of systematic analy-sis of previous work, our paper has a very different focus.
3 METHODS
To obtain a general understanding of visual interactive DR systems, we systematically reviewed the IEEE InfoVis, IEEE VAST, TVCG, and EuroVis literature. We first automatically identified a relevant subset of papers from these conferences and journals. Then, we carried out a qualitative in-depth analysis of the relevant papers, iteratively extracting and refining visual DR interaction characteristics. Our over-all approach to this analysis was inspired byGrounded Theory[11], in which data is systematically analyzed until meaningful categories emerge (see Section 4). This methodological approach is based on identifying and refining categories from a representative set of qualita-tive data, here papers, which are then used to incrementally build up a theoretical model (Section 6). This approach has been used in visual-ization research [28, 35, 51] and related areas such as HCI before [25], and its importance for building up the much needed theoretical foun-dation in visualization has been recognized [45, 51]. We next describe our method, followed by more detailed sub-sections on our analysis procedure and findings.
3.1 Methodological Choices
We began our endeavor with a curated list of landmark publications in interactive machine learning and visualization. Using these candidate papers, we first tried an open coding approach to identify “interesting” aspects at the intersection of VA and machine learning in general. This approach turned out to be very time consuming, and, ultimately,
impractical. While it led to a high level framework [47], our initial goals of thoroughly and systematically depicting how the VA and machine learning can be combined were largely unsatisfied. Hence we decided to analyze a much larger set of sample papers, resulting in three implications for our methodological choices. (1) We realized the need to focus on a specific machine learning problem (in our case, DR) to make the analysis more concrete, relevant, and actionable. (2) We needed automated methods to reduce the set of potentially interesting papers. (3) We opted for crisp, clear criteria for manual coding and filtering of papers. During this process, we refined the process, filtering criteria, and coding options several times. Our final workflow was then composed of four major steps, shown in Figure 2:1.) Automated keyword-based paper filtering,2.) Manual paper filtering,3.) Manual paper coding, and4.) Manual sample validation.
3.2 Sample Set of Papers
Our overall goal was to identify which DR methods are used, and how interaction is implemented in the VA and visualization communities. We decided to take a representative sample of papers, constituted of all IEEE VIS papers (1221) and EuroVis papers (629) from 2005 to 2015, for a total of1850 papers. From EuroVis we included all full and short papers, as well as EuroVA publications. The IEEE VIS papers included all InfoVis, VAST and TVCG papers. Our main focus was abstract, multi-dimensional data; consequently we did not include IEEE SciVis/Vis papers in the analysis, which generally focus on 3D spatial data (e.g., flow and volume rendering).
3.3 Automated Keyword-Based Filtering
We implemented a basic NLP pipeline to analyze the initial set of papers. The pipeline parses the full text of each paper, applying a tokenizer and a snowball stemmer implemented from StanfordNLP components1. The same was done with keyword lists, one list for DR and another for interaction keywords. From this, a feature vector of all keyword occurrences was derived. Papers without any keyword occurrences were deemed irrelevant and filtered out, and the remaining papers were listed in a csv file with associated keyword counts. This file was the basis for the subsequent manual filtering and coding steps. For the keyword definition, we examined previously published sur-veys and taxonomy papers in related fields, and formed a set of primary papers in DR and interactive visualization. The keywords of these papers were extracted and processed using the NLP pipeline. A manual validation process then followed to refine the keyword lists. For exam-ple, ambiguous abbreviations (such as,LLC), or words that become ambiguous after stemming (such asprojection, which stems toproject, orsome, which stems toSOM) were removed. The final keyword lists and statistics from the automated filtering process are provided as supplemental material.
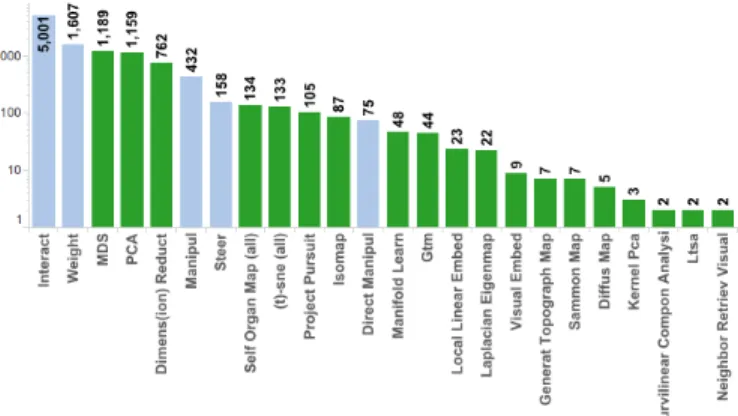
After the automated process, the initial set of 1850 papers was fil-tered to 382 relevant papers based on DR keywords, then reduced to 377 papers (108 EuroVis, 247 VIS) based on interaction keywords. Figure 3 illustrates a histogram of the keyword frequencies in a logarithmic scale. DR keywords are colored green and interaction keywords are shown in light blue.Interactis the outlier with the maximum occurrence in interaction keywords, whileMDSandPCAare the most frequently occurring DR methods.
3.4 Manual Expert Filtering
The remaining 377 papers were manually checked using the following criteria. First, we checked if the paper is a visualization application or technique paper, and if it handles “abstract data.” (We intended to exclude theory and evaluation papers, as well as papers focused on unrelated or tangential topics such as volume rendering or physical flow data). Second, we checked if the paper addresses the combination of visualization, DR and interaction, and if the interaction feeds back to the DR. For example Joia et al. [32] present an interesting technique for sampling and feature selection. However, there is no interaction that causes a recalculation of the DR. Given our focus on interactive DR,
1http://nlp.stanford.edu/software/
Fig. 3: The top keyword occurrences in the automatically identified papers shown in a log-scale histogram. DR keywords are colored in green and interaction keywords are colored in light blue.
we excluded interactions that do not feed back to the analysis pipeline, such as exploration/navigation/DoD (Details on Demand) interactions. Finally, we listed the DR techniques employed. Based on this, we obtained a candidate set of 70 relevant papers.
3.5 Manual Paper Coding
We next analyzed these 70 papers in detail, by open coding the “inter-esting” aspects of interaction described in each paper. For each paper, we extracted a brief description of the proposed interaction, including how interaction is performed and which parts of the DR pipeline are affected. In addition, we iteratively identified and refined a set of cri-teria. A more general model [47] and the different components of the DR pipeline (data, preprocessing, DR) served as initial set of criteria to encode which parts are affected by the analysts feedback. However, we had to adapt, split, and refine these criteria several times. As a result we arrived at seven scenarios for DR interaction, encoding “how the DR pipeline is changed” (see Section 4), the interaction paradigm (“how the interaction is performed”, see Section 5), theDR Method(s) or Algorithm(s), and combined machine learning techniques such as clusteringorclassification. During our process we had to discard several aspects that we initially were interested in. We started, for example, to encode “who” is expected to perform the actual interaction (e.g., DR expert or novice user), and “why” the human input is needed. However, investigating these aspects turned out to be challenging as the necessary information was not provided in many cases. A more detailed description of the final criteria and options is provided in the following sections. 8 more papers were filtered out in this iteration. 3.6 Manual Sample Validation
In a final validation iteration, we aimed at more detailed analysis of borderline cases and ended up removing 4 more papers. Our final corpus included 58 relevant papers, with the encoded information and the corresponding feature vector of keyword occurrences. We “cleaned” the encoded information and grouped the identified DR methods into higher-level categories (see Section 5.2).
4 SEVENGUIDINGSCENARIOS FORDR INTERACTION We next describe the interaction scenarios that emerged from our literature review. By examining the interactive machine learning pipeline proposed in [47], we identified the main potential interactions in data analysis, and classified them into seven guiding scenarios. This categorization is based on the outcome of several iterations of the paper filtering and open coding process, and is one of the major findings of our study. It enables us to evaluate various methods for “how the DR pipeline is controlled through interaction”. In the following, we briefly describe these seven DR interaction scenarios “along the DR pipeline” and illustrate them with examples:
S1 Data Selection & Emphasis: This group of interactions affects the data records (or observations) that will be supplied to the actual DR method. We found many examples in which a filter is applied to the data, and the DR pipeline is re-run on the remaining subset. In this scenario, we further identified several realizations. In some situations, analysts select subsets directly in a two-dimensional visual representation. In others, analysts specify conditions or filters through control panels. Furthermore, we identified various preprocessing configurations or parameters that can be adjusted by the analyst. An example is J¨ackle et al.’s temporal MDS plot technique [29], where a parameter sets the size of a sliding window. The resulting slices are taken as input for subsequent DR by one-dimensional MDS.S1 Data Selection & Emphasiswas identified 26 times.
S2 Annotation & Labeling: A second group of operations enrich data with annotations or labels on instances. In some systems, data may be enriched with additional information. For example, StarSPIRE [6] allows analysts to annotate documents with additional terms that will be included in the similarity calculation. Other systems enable the analyst to assign classification or cluster labels if the DR is combined with another form of machine learning (e.g. [23]). The cluster or classi-fication labels, as well as data structures (such as a hierarchy obtained from hierarchical clustering) are then translated into constraints for the DR algorithm (e.g., cluster preservation).
In the classification case, the analyst provides class labels within the two-dimensional embedding to train a classifier. Labels are provided for data instances, or in some settings, for pairs of instances. The classification result influences subsequent DR (e.g., [22]). In the clustering case, the analyst defines cluster memberships, such as by grouping elements into clusters, by adding or removing elements, or by splitting or merging clusters. Resulting clusters are used by the next iteration of DR. For example, the Bubble Cluster approach [23] lets the analyst re-position points or draw cluster boundaries in a 2D projection of the data, and use the new cluster assignments to update the projection.S2 Annotation & Labelingwas found in 15 papers.
S3 Data Manipulation: Some VA systems let the analyst explicitly manipulate data values by moving points in a spatialization, or by editing data in a table view. This interaction helps analysts to investigate “what if” scenarios. For example the iPCA system [30] allows the analyst to re-position a point in the 2D projection, and see how other values change. Interestingly, Jeong et al. reported that adjusting data values could be counter-intuitive to some of the subjects in their study. However, they argued that these interactions are still useful for revealing relationships in the data that might otherwise not be recognized.S3 Data Manipulationwas only rarely used (7 times).
S4 Feature Selection & Emphasis: We found many interaction examples that feed back to the initial data space by adapting the metric for calculating similarities or dissimilarities between data instances. Many DR applications adopt a “default” metric such as Euclidean distance. However, the default metric may not correspond well with the analyst’s “notion” of dissimilarity, and the metric needs to be adapted to the application. One way to do this is to associate adjustable weights with each data dimension. Distances can be calculated accordingly, giving more influence to relevant dimensions. For example, iPCA [30] provides the analyst with weighting sliders for each dimension. Another possibility is to infer the dimension loadings from direct manipulation interactions of visual elements. An example can be found in [43] where the analyst rearranges points serving as control points for a subsequent optimization of the projection matrix. Similarly in Dis-Function [8], an analyst drags and selects points on a 2D scatterplot, and a compatible distance function is learned by the system. When the user is finished with manipulations, a button is pressed to learn the distance function and re-render the result. Other systems such as [44] provide analysts with drop-down menus to select a distance metric. Further options are to let the analyst determine interesting features in combination with subspace clustering (e.g., [41]) or quality metrics (e.g., [31]).S4 Feature Selection & Emphasiswas
the most frequently implemented interaction scenario (37).
S5 DR Parameter Tuning: Some DR algorithms contain specific parameters that can be tuned, such as LDA regularization in [13]. An approach proposed by Schreck et al [49] allows the analyst to set the grid dimensions of a self-organizing map (number of neurons, DR structure). Some systems have parameters related to quality and accuracy, such as thresholds or level-of-detail parameters. Garg et al. [22] provide a similarity cutoff parameter that determines edges with low similarity to be removed from a graph layout. Others have parameters affecting visual appearance. For example, [16] allows adjusting node padding or forcing strength in a force-directed embedding. We also found examples where the analyst can define algorithmic variants (by setting parameters), that animate or show transitions between multiple DR results. In [43] a transition parameter (slider) is set to compare and track changes. Finally, parameter sets or configurations can be set indirectly, such as when the analyst is offered several visualization recommendations or previously defined parameter sets, and may compare them to select the most appropriate one. However, we did not identify any mature, ready-to-use system incorporating this kind of parameter tuning.S5 DR Parameter Tuning was found in 20 papers.
S6 Defining Constraints: Interactions can be translated directly to DR algorithm constraints. We identified several examples in which an analyst directly arranges points in the visualization. These modified points are interpreted as anchor points in the subsequent DR iteration, in which their positions should remain fixed to help the analyst track other changes. For example, Endert et al. [20] introduced Guided MDS, where user-defined anchor points are used to fix positions and adjust similarities for maintaining consistency in visualization. A similar example can be found in [6], where nodes representing objects are marked as “fixed” and subsequently not rearranged by a force-directed algorithm. Constraints such as region or containment, as well as visual constraints have also been proposed. For example the technique introduced by [17] allows analysts to group points and define regions that should not be split or overlap with others. In addition, constraints for the edges may be defined, such as pointing edge downward. Note, that in combination with another ML method, the ML output can be thought of as a constraint for DR, e.g., items that belong to the same cluster or classification should be placed close to each other, or a hierarchy obtained from hierarchical clustering should be preserved. In some systems, these constraints can also be interactively controlled (providing labels, setting parameters for the clustering, etc.).S6 Defining Constraintswas described in 15 papers.
S7 DR Type Selection: Visual embeddings of high-dimensional data can be generated by various DR algorithms and vary in terms of layout and quality. For example, linear methods project data to new axes, such as directions of maximal variance in PCA, whereas methods such as MDS aim to preserve distances or neighborhoods of data records. While some systems, such as iPCA and StarSPIRE, focus on one DR technique, others implement multiple algorithms so the analyst can select and compare their results while analyzing data. A system by Rieck and Leitte [46] visualizes and ranks embeddings from several DR algorithms according to quality measures. Another system by Liu et al. [40] lets the analyst select DR algorithms and compare them based on visualization of distortion measures. We can even envision approaches for indirect S7 DR Type Selection. Although we did not find examples, it seems potentially useful to infer an appropriate DR Type from user inputs automatically, on the fly. We elaborate on this idea in Section 6.S7 DR Type Selectionhad the lowest occurrence (4) among the seven scenarios. Note that some of the seven guiding scenarios overlap. For example, S1-S3 affect data items, and S5-S7 involve the choice of DR algorithm. However, we identified these particular scenarios as useful descriptions of the papers we studied. We found it useful to distinguish scenarios based on the way interaction affects the DR pipeline. For example, to
Table 1: Result of the proposed coding process. Blue, orange, yellow and green setups appear more frequently. Red points denote papers implementing 4 different interaction scenarios. The three main column groups specify interaction scenarios, combinations with other machine learning methods, and interaction paradigms.
distinguishS2 Annotation & LabelingfromS6 Defining Constraints interactions, we note that both add information to data items (e.g., a class label vs. a “pinned” information), butS2 Annotation & Labeling focuses on information about input data items, whileS6 Defining Constraintsinvolves information about desired results or outputs of the DR. Note also that the role of the VA system is to translate these similar inputs to different interaction scenarios (see Section 5).
Fig. 4: Embedding of 58 papers based on interaction scenarios. The plot shows a diverse set of interaction combinations. The main interaction scenarios areS4 Feature Selection & Emphasis(blue cluster),S1 Data Selection & Emphasis(orange cluster), the combination of S1 & S4 (yellow cluster), and S4 combined withS2 Data Manipulation(green cluster). The red cluster contains papers that combine 4 different interaction scenarios.
Observations: The final result of our coding process is shown in Table 1 and Figure 4. To provide an overview of the coded results, we created a 2D projection of the papers using Multiscale Jensen-Shannon Embedding [37], which aims to place papers with similar codes nearby in the projection. Together with Table 1 we can investigate combi-nations of interaction scenarios. In total, we identified 29 different combinations. We found a maximum of 4 scenarios per paper (in 4 papers, colored in red). Papers colored blue only coverS4 Feature Se-lection & Emphasis. This was the most frequent “setup” and appeared in 9 papers. The five orange dots denote papers that only includeS1 Data Selection & Emphasis, and the five yellow dots represent papers with combinations ofS1andS4. Work applyingS2 Annotation & La-belingandS4 Feature Selection & Emphasisoccurred 4 times (green dots). We color the rest of the papers gray, as their combinations of interactions occur less frequently. These gray dots generally appear further away from the center of the view. For example, papers including S5 DR Parameter Tuningare placed in the upper area, orS2. Annotation & Labelingpapers are placed near the upper left corner.
We further observe from Table 1 that some interaction scenarios appear more frequently than others. This applies toS4,S1, andS5 maybe because they are more general or convenient than others. S3 Data Manipulationis used least. One reason might be that manipulat-ing observations—often considered “ground truth”—is not common practice in many domains (e.g., machine learning). Also note thatS3 only appears in combination with other interaction scenarios.
In this respect, it would be interesting to investigate in more detail whysome interaction scenarios appear more or less frequently. This naturally raises the question about theeffectivenessof certain interac-tion scenarios. In-depth investigainterac-tion of effectiveness, however, goes beyond the scope of this paper. Previous work has shown that assessing effectiveness of interactive DR solutions depends heavily on context factors, such as users, data, domain, and tasks at hand [50, 52]. A generic comparison of the scenarios’ usefulness and effectiveness is thus a non-trivial endeavor, and further work is needed. The study in this paper is descriptive with the goal to characterize existing interaction scenarios, and can be used as a starting point for such endeavors.
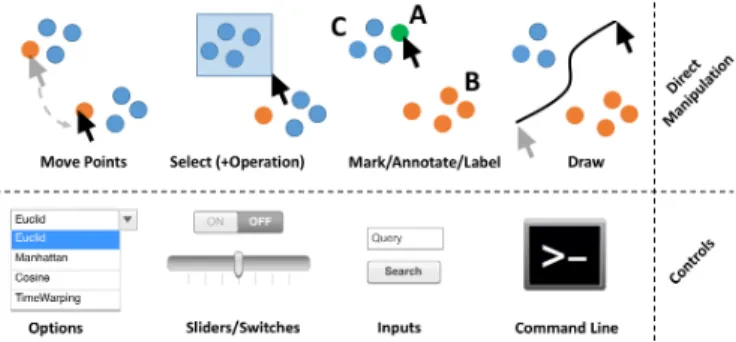
Fig. 5: Different interaction paradigms: TypicalDirect Manipulation in-teractions are shown in the upper half. On the bottom, control elements are shown. DR-Interfaces are usually composed of both.
5 FURTHERINSIGHTS
In this section, we analyze the interaction scenarios in different contexts, such as the interaction paradigm, the combined DR algorithms or other machine learning methods, as well as a temporal perspective. 5.1 Interaction Paradigm & Usability
Each interaction scenario can be realized in multiple ways. Therefore, our analysis also encoded interaction paradigms, including Direct Manipulation of visual elements, Controls (sliders, buttons, etc.), Command Line Interface (CLI),Other(such as gestures or speech input), orNA(if interaction was not described in the paper). The results (see Table 1-right side columns) reveal balanced usage ofDirect Manipulation(36) and Controls (33). However, novel interaction paradigms (Other) only appeared once (multi-touch in [59]) and another set of papers omits details of how interaction is performed (NA, 12). It is also worth mentioning that the amount of provided information about the realization and implementation, as well as discussions about usability of interactions strongly varies between the analyzed papers.
Our results show that analysts interact with DR either directly in the visualization, or using control elements. During our study we noticed, especially inDirect Manipulation, similar actions may have different meanings or implementations (see upper half of Figure 5 as an example). An analyst can move points, select data records (followed by an operation such as deletion), mark (label, or annotate) points, or draw borders in a plot. However, the meaning of an action may vary. Data movement can be “translated” toS2 Annotation & Labelingif a point is moved outside a cluster, or toS3 Data Manipulationif the data value is changed. Alternatively, the movement can be “translated” to S4 Feature Selection & Emphasisby deriving (dis)similarities from user defined distances between data points, orS6 Defining Constraints if a data point being moved is interpreted as an anchor point. In such cases visualization has to act as a “mediator” between human and machine and translate the interactions to appropriate DR pipeline components. In contrast, control elements (Figure 5-bottom) are usually directly coupled to specific DR pipeline components. The UI provides, for example, sliders to directly control dimension loading or DR parameters, drop-down menus to select metrics, or buttons to trigger specific operations. There are also cases where natural language text inputs are accepted. On the other hand,Command Line Interfaces offer a powerful, well-specified language for programmers, but they are not always convenient or even accessible to analysts.
The final implementation determines the “complexity” of performing an interaction scenario, which depends on user and task characteristics though. DR experts, for instance, might require a large set of directly steerable parameters, and accept a more complex interface. Other users, however, might require less flexibility, but simple ways to provide feedback based on their domain knowledge.
Table 2: Identified DR techniques shown with interaction scenarios.
Table 3: Temporal statistics of interaction and DR Techniques.
5.2 DR & Machine Learning Algorithms
The interaction scenarios appeared with several different DR algo-rithms. Each algorithm was assigned to a higher-level category of Distance Based(DB),Linear Projection(LP),Graph/Force-Directed (FD),Neural Network(NN),General, orOther(one approach did not match any others – “data driven feature selection”). Table 2 lists these DR algorithms as columns and interaction scenarios as rows. We see thatDistance Basedmethods (mainly MDS) were used alone most fre-quently (17), followed byLinear Projections(mainly PCA) alone (12) andGraph/Force-Directedmethods alone (10). Generalapproaches appear in 5 papers, whereasNeural Networkswere used 3 times (all self organizing maps). The other columns show examples where var-ious DR algorithms are used in combination. Note that only one of the mixed approaches (other thanGeneralapproaches) lets the analyst switch between DR algorithms. Interestingly,S4 Feature Selection & Emphasiswas used in all of these DR algorithm combinations. We can further derive from Table 1 thatClusteringandClassificationappeared in 31 papers.Clusteringwas used 28 andClassification12 times, while in 9 papers both of them are used in combination.
5.3 Temporal Perspective
We did not find any relevant papers on interactive DR in 2005. As shown in Table 3, in the corpus we studied, published work on visual interactive DR first appeared in 2006, with one paper that reported work inS1 Data Selection & Emphasis. This was followed by 5 related papers published in 2007, where a wider range of interaction techniques such asS4 Feature Selection & Emphasis,S2 Annotation & Labeling, andS5 DR Parameter Tuningwere included. These four interaction scenarios appear to be more “established” than the others, as work was continuously reported in these areas in the following years, whereas the development of other interaction techniques have breaks in between. For exampleS7 DR Type Selectionfirst appeared in 2007, but then there is a gap until 2012, after which it appears consistently. We admit these trends may not be fully representative due to the limited number of papers and scenarios in our study. One obvious pattern is the number of papers published by year. Years 2009 (9) and 2011 (10) are peaks. Of course, a larger number of papers does not necessarily describe a richer set of interaction scenarios (as shown in the “AVG Interaction/Paper” row where large paper counts do not strongly correspond to large average interaction counts).
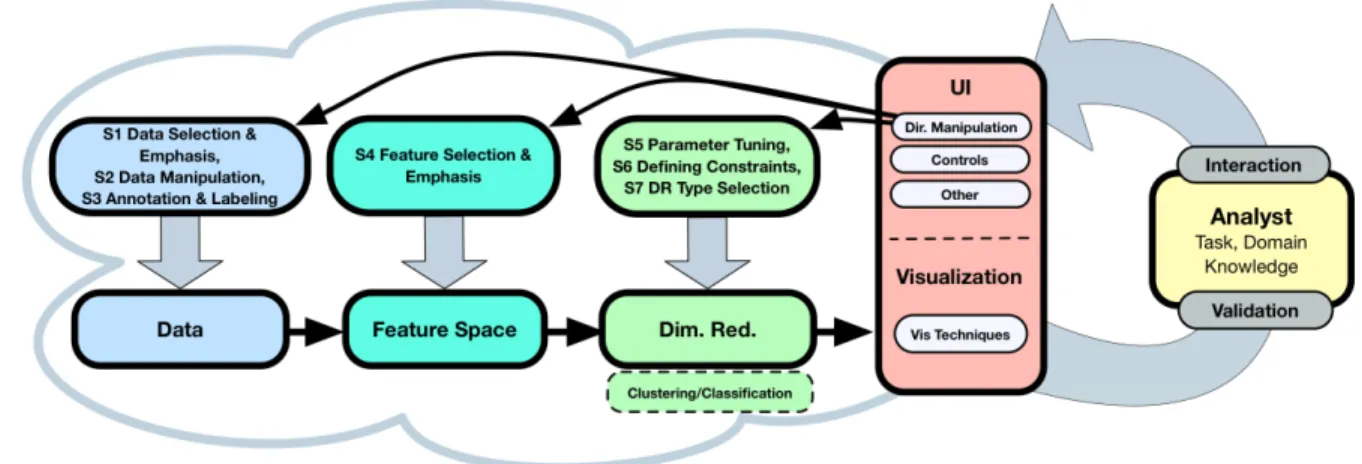
Fig. 6: Proposed “human in the loop” process model for interactive DR. The analyst can iteratively refine the analysis by interacting with the DR pipeline. The visualization interface serves as a “lens” that interactively mediates between the DR pipeline and the analyst, presenting DR results or updates and accepting feedback.
6 THEINTERACTIVEDR PROCESS
With the goal of making our study more broadly applicable, we sum-marize our findings in a general process model for interactive DR in VA. This model is shown in Figure 6. It depicts an expanded version of the basic model in Figure 1 and is a specialized model of our gen-eral pipeline model for visual interactive machine learning [47]. Note that the general model is a superset of the model shown in Figure 6 and was needed to arrive at a more specialized version for interactive DR, which contains specific steps, knowledge, and details tailored to interactive DR, and is therefore much more actionable. At the top, we add the seven scenarios of interacting with DR techniques, and arrange them along the analysis pipeline. S1-S3operate on the data, such as by changing data values or annotating labels (blue);S4operates on the feature space, such as by changing distance functions or the projection matrix (cyan); andS5-S7directly affect the DR algorithms (or additional ML models) (green). At the bottom, the results of the DR process are propagated back to the analyst (yellow).
The core of our process model is theinteractive visual interface
(red), which connects these two streams and serves as a lens for the human analyst on the algorithmic building blocks. While our work focused primarily on characterizing the forms of interaction shown by the top arrows, it is also interesting to consider how DR results can be visually presented to the user. We found dimensionally-reduced data is typically presented in scatterplots or node-link diagrams, confirming previous empirical findings [50]. Yet, our model also draws attention to the fact that other aspects of the process model can be visually repre-sented. For instance, the dimensions (or eigenvector) can be mapped to a parallel coordinate plot [30]. Furthermore, the quality of the DR pipeline can potentially be visualized, either separately, or embedded in the low dimensional representation. Some DR types calculate or iden-tify errors, and in combination with other machine learning methods, additional quality information might be obtained (e.g., the precision of a classifier [42]). Furthermore, different DR pipeline variants (e.g., pre-defined DR configurations or automatically built recommendations) can be visualized [27]. These different perspectives on the DR pipeline support the analyst’s interpretation and validation process.
In many VA tools, the analyst has not only the ability to visually inspect and validate the data, but also the ability to provide interactive feedback to control the analysis through the interface. As discussed previously, this feedback is usually in the form of controls and direct ma-nipulation interactions, such as setting positions, selecting, or grouping data items; other interaction paradigms such as command line scripts, gestures and speech input are also possible. The VA system maps user inputs to the specified interaction scenario(s), providing an instance of a typical continuous and iterative process, as it is usually targeted in VA [34, 47]. Note that the ability of the analyst to provide useful feedback depends on the interpretability of visual observations but also
on the accessibility (implementation) of the interaction. These aspects further depend on both, the technical competence (DR expertise) and domain knowledge of the analyst, as well as the analysis task (e.g., analyzing data records vs. dimensions [50]). Especially novice analysts with less mathematical skills face problems of interpreting different DR concepts (e.g., linear vs. non-linear models) in a 2D-representation where the actual meaning of the axis is lost.
We now demonstrate how the proposed process model can be used for comparative, as well as generative purposes [2]. We first use it to describe and compare four existing examples. We then use it to identify and reason about open research opportunities.
6.1 Descriptive Use of the Process Model – Examples Figure 7b instantiates the DR process model on four examples. Their representation in the proposed model provides a consistent way to understand these systems and compare their capabilities for interaction.
iPCA (S1, S3, S4) The iPCA system [30] (Figure 7a-1) addresses typical data and feature space interactions. Several aspects of PCA are visualized in linked views, including projection, data, eigenvector, and correlation views. Each view supports a wide range of interactions including navigation, selection, and linking & brushing, however, the authors focused on three interactions that require re-computation of PCA. First, forS1 Data Selection & Emphasisan analyst can remove data items (e.g., outliers) and observe the resulting changes in data- and eigen-space. Second, the analyst can modify data values in some views or spaces (S3 Data Manipulation). Finally, iPCA offers sliders for each dimension forS4 Feature Selection & Emphasis, enabling the analyst to modify each dimension’s contribution to the final PCA calculation. This lets the analyst test how the DR is affected by removing or “dimming” the importance of certain dimensions.
Interactive Cluster Separation (S4, S6, other ML) Molchanov and Linsen [43] present another way to infer feature weights from interactions (Figure 7a-2). They invert the process of modifying the projection matrix in a star coordinates widget by allowing the analyst to specify the desired configuration directly in the projection view (by rearranging control points). They show an example whereS4 Feature Selection & Emphasisis inferred from direct manipulation of data points. In addition, the control points serve asS6 Defined Constraints for the projection. To achieve an appropriate DR output, the projection matrix is recalculated “based on an LS solution of an over determined system of linear equations”. The control points can be selected by the analyst, however, the authors recommend using cluster medians or centroids for better cluster separation. This implies that the labels must be contained in the data or determined by a classifier beforehand.
StarSPIRE (S1, S2, S4, S6) Bradel et al. [6] extends the Force-SPIRE system proposed by Endert et al. [19]. Their extension offers a richer set of interaction scenarios. A modified force-directed layout
(a) Images for each example.
(b) Interactive DR process model instances for each example.
Fig. 7: Analyzed examples for DR interaction: 1.) iPCA, 2.) Interactive cluster separation, 3.) StarSPIRE, and 4.) Persistent Homology. algorithm visualizes text documents under a computed similarity metric
(Figure 7a-3). They extend ForceSPIRE with an additional model for relevance-based document retrieval that performsS1 Data Selection & Emphasisinferred from user interactions. The analyst can alsoS2 Annotatetext documents with further information (terms) that update the similarity calculation and cause a change to the document layout.S4 Feature Selection & Emphasisis inferred from user interaction by ad-justing the weightings of document terms. This is done in conjunction with annotation, but also by re-sizing elements, searching, highlighting and overlapping documents. In addition it is possible to rearrange and pin document nodes in the spatialization. The pinned document serves as aS6 Defined Constraintfor the force-directed layout.
Persistent Homology (S5, S7) Rieck and Leitte [46] describe an approach to comparing DR parameter settings across various DR types, such as PCA, t-SNE, HLLE and Isomap. Quality measures are computed to validate and rank the DR setup configurations. The proposed approach visualizes various DR embeddings together with additional quality information (Figure 7a-4). Their study does not explain in detail how an analyst would create the different combinations ofS5 Parameter SettingsandS7 DR Type Selections (we encoded this work asNA). However, several examples illustrate different DR algorithms and parameterizations created by the authors (we assume usingCLI).
Comparison Figure 7b shows interactions supported by the
above-mentioned systems. For instance, while iPCA offers the ability toS3 manipulate data items, StarSPIRE allows the analyst toS2 annotatedocuments with additional terms. iPCA, Cluster Separation, and StarSPIRE allowS4 Feature Selection & Emphasis, however, in different ways. iPCA offers slider controls directly coupled to dimension loading. Cluster Separation and StarSPIRE inferS4 Feature Selection & Emphasisfrom direct manipulation, through optimization and term weighting. Cluster Separation and StarSPIRE allow the analyst toS6 Define Constraintsfor the DR process, by positioning and pinning data items. The Persistent Homology approach focuses on the validation and comparison of different DR setups by choosing among severalS7 DR Type SelectionsandS5 Parameter Settings.
The examples and their comparison illustrate the applicability of the proposed interactive DR process model. It supports evaluating systems with respect to the identified interaction scenarios and their implementations, and can be used to derive further interaction scenarios and implementations not present in current VA systems. We next detail 5 opportunities for research in visual interactive DR systems.
6.2 Generative Use of the Process Model – Opportunities We can apply our study and process model to better understand and reason about research opportunities. We recommend these directions:
Semantic Interaction Design One challenge in the design of
interactive DR systems is the semantic translation of front-end interac-tions. Section 5.1 illustrates that the same front-end interaction can be mapped to several different back-end computations. Ideally, intuitive interactions would direct back-end computation and correctly express the intention of the analyst. For example in StarSPIRE, by moving points closer to each other in the visualization the analyst can have the similarity measures and the layout updated accordingly. While many systems provide good examples of semantic interaction design, the translation only applies to a subset of interaction scenarios (e.g., feature weighting, similarity computation). Consistently mapping user inputs to more complex actions covering the entire pipeline is an open challenge. Especially in DR, interaction designers have to consider that DR concepts and algorithms are often hard to understand and interpret. Therefore, interaction needs to be accessible and interpretable for end users, enabling them to work with distances and neighborhoods, clus-ters and class memberships, or importance of dimensions. Scalability of computation will play a crucial role in such interactive systems, as delaying responses hinders usability [10].
Guidance on DR Type Selection Our study revealed thatS7 DR Type Selectionhas rarely been implemented. Furthermore, semantic interactions derived from direct manipulation interactions are mostly limited to DR pipeline adaptions of the feature space or DR parameters and constraints. We envision future systems that can also infer an appropriate DR algorithm from user inputs. Such VA systems would probably need to implement, calculate and compare various DR types, to identify the “best” results on the fly. Work proposed by Rieck and Leitte [46] shows a promising step in this direction. However, realization and implementation of direct manipulation interactions and translation to DR type selections is still missing. Such techniques, that balance user flexibility with system automation, have great potential for guiding users through complex data analyses, so this is an important area for further investigation. On the algorithmic side, the challenge is to formulate specific DR algorithms as parametric instances that allow smooth transitions between different DR types. For example, continuous model spaces [37, 55] enable analysts to track and interpret model switching and avoid abrupt and confusing transitions.
Evaluating DR Interactions As pointed out in Section 4 we are not aware of studies evaluating the effectiveness of DR interactions in a structured and general setup. It will be a challenge to design and
conduct a fair comparative assessment of different interaction scenar-ios, as they depend on many factors, such as implementation, user experience or tasks. However, it would be useful to gather insights about effectiveness of the respective interaction scenarios under certain conditions. This would guide researchers and developers in designing interactive DR systems for their specific domains, tasks and data. Horn-bæk provides a comprehensive overview of usability measures from HCI [25] that could be applied to a comparative DR setup.
Fully Integrated Process As discussed in Section 4 and illus-trated in Figure 7b, existing systems implement only a small subset of possible interactions. While many previous systems have proven useful for specific tasks and problems, more powerful, general-purpose interactive DR tools are needed. An ideal system would provide flexible access to a range of DR algorithms, distance functions, optimization algorithms or quality metrics, and offer many of the interaction types we identified. It will be a challenge to conceptually integrate and steer a wide range of algorithm specific parameters or different combinations of computations. At the same time, the burden of choosing suitable data, features, parameters and models could be mitigated by tightly integrating the DR pipeline with interactive visualization.
Analytic Provenance Given the complex nature of many analysis tasks, the analyst often has to go through many steps and even false starts before reaching sound conclusions. Although analytic provenance has been introduced as a research topic in VA, not much work has been reported on recording interactions to support exploratory data analysis for DR. A major task will be to compare and assess different DR results in a sequence of interactions. For example, when switching between different states, the resulting changes have to be observable and measurable to automatically identify impactful actions within an analysis session. Lehmann and Theisel provide a promising approach to measure the (dis)similarity of projections [38]. However, more research considering a larger set of DR types and interactions is needed. 7 LIMITATIONS
Our work comes with certain limitations that result from the approach we adopted. To keep the study focused and manageable, we had to limit our literature analysis to a representative set of examples. After many discussions, we decided to focus on the visualization literature. Our goal was to identify papers that include DR, interaction and visu-alization. We find these mainly in the visualization community. We primarily aimed at actionable and extensible results, and with that at transparency and reproducibility by thoroughly describing our method. Nevertheless, we are confident that we analyzed a representative sub-set of the literature and that our derived model is stable regarding the interaction scenarios. It would be interesting to evaluate the stabil-ity of our results by performing an expanded “cross validation” study that also includes/adds papers from machine learning (e.g., KDD) and human-computer interaction (e.g., CHI). Note that we initially started our analysis with landmark publications from all domains and had to limit the set of papers to keep the work manageable.
In our analysis of the literature, we identified several contributions that offer useful interactions to explore and validate DR results, without directly feeding back to a DR calculation. We had long discussions about including these interactions as another scenario, but finally de-cided to exclude these papers to keep the work focused. An example is the system proposed by Stahnke et al. [53] that provides interactions to interpret and interrogate DR results. Their system allows an analyst to investigate approximation errors, examine positions of data points, and “overlay” the influence of specific data dimensions. However, these
interactions do not feed back to a subsequent DR calculation. Similarly, other facets may be involved in interactive DR in specific, and interactive machine learning in general. An important facet is DR quality measures. A framework by Bertini et al. [5] describes an enriched VA pipeline with quality-metric-driven automation. Quality is measured at each stage of the pipeline, with the analyst steering the entire process. Quality measures can augment user interaction at these stages with automatic configurations or recommendations. However, quality measures do not interact with the DR pipeline, and can be seen
as an add-on to our proposed scenarios. Considering quality measures was a main concern when we began this study, but as the work matured we decided to focus exclusively on interaction scenarios with DR. 8 CONCLUSION ANDFUTUREWORK
Giving humans more interactive control over the DR process is a great opportunity for improving exploratory data analysis. It allows the analyst to explore data, feature, parameter and model spaces, taking advantage of their understanding of the data, application domain, and experience in the analysis task at hand.
In this study, we systematically analyzed the visualization literature with the goal of identifying common DR operations amendable to interactive control. We summarized our findings in seven guiding scenarios, which we contextualize in a conceptual process model for visual interactive DR. Our analysis revealed several ways that DR can be enriched by user interaction, how these strategies are supported by current VA systems, and points to future research directions in interactive DR. We hope that our contributions help other researchers investigating, designing and evaluating interactive DR systems.
In future work, we plan to develop a system capable of inferring and adapting its settings in a larger design space than current systems for visual interactive DR. We plan to extend our analysis to papers from related domains, such as machine learning and human-computer inter-action. Beyond this, we would like to perform a literature analysis and process modeling study focused on interactive clustering, classification, and regression analysis in VA.
ACKNOWLEDGMENTS
This paper is a result of Dagstuhl Seminar 15101, “Bridging Infor-mation Visualization with Machine Learning”. The authors thank all participants for inspiring and fruitful discussions. This work was par-tially supported by the EU project VALCRI (FP7-SEC-2013-608142). REFERENCES
[1] E. Alpaydin.Introduction to Machine Learning, 3rd Edition. MIT Press, 2014.
[2] M. Beaudouin-Lafon. Designing interaction, not interfaces. InConf. on Advanced Visual Interfaces (AVI), pages 15–22. ACM, 2004.
[3] Y. Bengio, A. C. Courville, and P. Vincent. Representation learning: A review and new perspectives. IEEE Trans. Pattern Anal. Mach. Intell., 35(8):1798–1828, 2013.
[4] E. Bertini and D. Lalanne. Surveying the complementary role of automatic data analysis and visualization in knowledge discovery. InProceedings of the ACM SIGKDD Workshop on Visual Analytics and Knowledge Discov-ery: Integrating Automated Analysis with Interactive Exploration, pages 12–20, 2009.
[5] E. Bertini, A. Tatu, and D. Keim. Quality metrics in high-dimensional data visualization: An overview and systematization. IEEE Trans. on Visualization and Computer Graphics, 17(12):2203–2212, Dec 2011. [6] L. Bradel, C. North, L. House, and S. Leman. Multi-model semantic
interaction for text analytics.IEEE Conf. on Visual Analytics in Science and Technology (VAST), pages 163–172, 2014.
[7] M. Brehmer and T. Munzner. A multi-level typology of abstract visu-alization tasks. IEEE Trans. on Visualization and Computer Graphics, 19(12):2376–2385, 2013.
[8] E. T. Brown, J. Liu, C. E. Brodley, and R. Chang. Dis-function: Learning distance functions interactively.IEEE Conf. on Visual Analytics in Science and Technology (VAST), pages 83–92, 2012.
[9] A. Buja, D. Cook, and D. F. Swayne. Interactive high-dimensional data visualization.Journal of Computational and Graphical Statistics, 5:78–99, 1996.
[10] S. K. Card, G. G. Robertson, and J. D. Mackinlay. The information visualizer, an information workspace.ACM SIGCHI Conf. Human Factors in Computing Systems (CHI), page 181186, 1991.
[11] K. Charmaz.Constructing grounded theory. Sage, 2014.
[12] J. Choo, S. Bohn, and H. Park. Two-stage framework for visualization of clustered high dimensional data. IEEE Conf. on Visual Analytics in Science and Technology (VAST), pages 67–74, 2009.
[13] J. Choo, H. Lee, J. Kihm, and H. Park. iVisClassifier: An interactive visual analytics system for classification based on supervised dimension
reduction. IEEE Conf. on Visual Analytics in Science and Technology (VAST), pages 27–34, 2010.
[14] R. J. Crouser and R. Chang. An affordance-based framework for hu-man computation and huhu-man-computer collaboration. IEEE Trans. on Visualization and Computer Graphics, 18(12):2859–2868, 2012. [15] D. Donoho. High-Dimensional Data Analysis: The Curse and Blessings
of Dimensionality. Aide-m´emoire for a lecture for the American Math. Society “Math. Challenges of the 21st Century”, 2000.
[16] P. Drieger. Visual Text Analytics using Semantic Networks and Interactive 3D Visualization. In K. Matkovic and G. Santucci, editors,EuroVA 2012: International Workshop on Visual Analytics. The Eurographics Association, 2012.
[17] T. Dwyer, Y. Koren, and K. Marriott. Ipsep-cola: An incremental proce-dure for separation constraint layout of graphs.IEEE Trans. on Visualiza-tion and Computer Graphics, 12(5):821–828, 2006.
[18] A. Endert, R. Chang, C. North, and M. X. Zhou. Semantic interaction: Coupling cognition and computation through usable interactive analytics. IEEE Computer Graphics and Applications, 35(4):94–99, 2015. [19] A. Endert, P. Fiaux, and C. North. Semantic interaction for visual text
analytics. ACM SIGCHI Conf. Human Factors in Computing Systems (CHI), pages 473–482, 2012.
[20] A. Endert, C. Han, D. Maiti, L. House, S. Leman, and C. North. Observation-level interaction with statistical models for visual analyt-ics.IEEE Conf. on Visual Analytics in Science and Technology (VAST), pages 121–130, 2011.
[21] A. Endert, M. S. Hossain, N. Ramakrishnan, C. North, P. Fiaux, and C. Andrews. The human is the loop: new directions for visual analytics.J. Intell. Inf. Syst., 43(3):411–435, 2014.
[22] S. Garg, I. V. Ramakrishnan, and K. Mueller. A visual analytics ap-proach to model learning.IEEE Conf. on Visual Analytics in Science and Technology (VAST), pages 67–74, 2010.
[23] C. Heine and G. Scheuermann. Manual clustering refinement using inter-action with blobs.Computer Graphics Forum, pages 59–66, 2007. [24] P. E. Hoffman and G. G. Grinstein. Information visualization in data
mining and knowledge discovery. chapter A Survey of Visualizations for High-dimensional Data Mining, pages 47–82. Morgan Kaufmann, San Francisco, CA, USA, 2002.
[25] K. Hornbæk. Current practice in measuring usability: Challenges to usability studies and research. International Journal of Man-Machine Studies, 64(2):79–102, 2006.
[26] A. Hyv¨arinen, J. Karhunen, and E. Oja.Independent Component Analysis. Wiley, 2001.
[27] S. Ingram, T. Munzner, V. Irvine, M. Tory, S. Bergner, and T. M¨oller. Dimstiller: Workflows for dimensional analysis and reduction.IEEE Conf. on Visual Analytics in Science and Technology (VAST), pages 3–10, 2010. [28] T. Isenberg, P. Isenberg, J. Chen, M. Sedlmair, and T. M¨oller. A system-atic review on the practice of evaluating visualization. IEEE Trans. on Visualization and Computer Graphics, 19(12):2818–2827, 2013. [29] D. J¨ackle, F. Fischer, T. Schreck, and D. A. Keim. Temporal MDS plots for
analysis of multivariate data.IEEE Trans. on Visualization and Computer Graphics, 22(1):141–150, 2016.
[30] D. H. Jeong, C. Ziemkiewicz, B. D. Fisher, W. Ribarsky, and R. Chang. iPCA: An interactive system for pca-based visual analytics. Computer Graphics Forum, 28(3):767–774, 2009.
[31] S. Johansson and J. Johansson. Interactive dimensionality reduction through user-defined combinations of quality metrics. IEEE Trans. on Visualization and Computer Graphics, 15(6):993–1000, 2009.
[32] P. Joia, F. Petronetto, and L. G. Nonato. Uncovering representative groups in multidimensional projections.Computer Graphics Forum, 34(3):281– 290, 2015.
[33] D. A. Keim. Information visualization and visual data mining.IEEE Trans. on Visualization and Computer Graphics, 8(1):1–8, 2002.
[34] D. A. Keim, J. Kohlhammer, G. P. Ellis, and F. Mansmann.Mastering the Information Age - Solving Problems with Visual Analytics. Eurographics Association, 2010.
[35] H. Lam, E. Bertini, P. Isenberg, C. Plaisant, and S. Carpendale. Empirical studies in information visualization: Seven scenarios. IEEE Trans. on Visualization and Computer Graphics, 18(9):1520–1536, 2012. [36] J. Lee and M. Verleysen.Nonlinear dimensionality reduction. Springer,
2007.
[37] J. A. Lee, E. Renard, G. Bernard, P. Dupont, and M. Verleysen. Type 1 and 2 mixtures of Kullback-Leibler divergences as cost functions in di-mensionality reduction based on similarity preservation.Neurocomputing,
112:92–108, 2013.
[38] D. J. Lehmann and H. Theisel. Optimal sets of projections of high-dimensional data.IEEE Trans. on Visualization and Computer Graphics, 22(1):609–618, 2016.
[39] S. Liu, D. Maljovec, B. Wang, P.-T. Bremer, and V. Pascucci. Visualiz-ing High-Dimensional Data: Advances in the Past Decade. Computer Graphics Forum, 2015.
[40] S. Liu, B. Wang, P. Bremer, and V. Pascucci. Distortion-guided structure-driven interactive exploration of high-dimensional data.Computer Graph-ics Forum, 33(3):101–110, 2014.
[41] S. Liu, B. Wang, J. J. Thiagarajan, P. Bremer, and V. Pascucci. Visual ex-ploration of high-dimensional data through subspace analysis and dynamic projections.Computer Graphics Forum, 34(3):271–280, 2015. [42] G. M. H. Mamani, F. M. Fatore, L. G. Nonato, and F. V. Paulovich.
User-driven feature space transformation. Computer Graphics Forum, 32(3):291–299, 2013.
[43] V. Molchanov and L. Linsen. Interactive Design of Multidimensional Data Projection Layout. In N. Elmqvist, M. Hlawitschka, and J. Kennedy, editors,EuroVis - Short Papers. The Eurographics Association, 2014. [44] J. E. Nam and K. Mueller. Tripadvisorn-d: A tourism-inspired
high-dimensional space exploration framework with overview and detail.IEEE Trans. on Visualization and Computer Graphics, 19(2):291–305, 2013. [45] A. Oulasvirta and K. Hornbæk. Hci research as problem-solving. InACM
SIGCHI Conf. Human Factors in Computing Systems (CHI).
[46] B. Rieck and H. Leitte. Persistent homology for the evaluation of dimen-sionality reduction schemes.Computer Graphics Forum, 34(3):431–440, 2015.
[47] D. Sacha, M. Sedlmair, L. Zhang, J. A. Lee, D. Weiskopf, S. C. North, and D. A. Keim. Human-Centered Machine Learning Through Interac-tive Visualization: Review and Open Challenges. Proceedings of the 24th European Symposium on Artificial Neural Networks, Computational Intelligence and Machine Learning, 2016.
[48] D. Sacha, A. Stoffel, F. Stoffel, B. C. Kwon, G. P. Ellis, and D. A. Keim. Knowledge generation model for visual analytics.IEEE Trans. on Visual-ization and Computer Graphics, 20(12):1604–1613, 2014.
[49] T. Schreck, J. Bernard, T. Tekusova, and J. Kohlhammer. Visual cluster analysis of trajectory data with interactive kohonen maps.IEEE Conf. on Visual Analytics in Science and Technology (VAST), pages 3–10, 2008. [50] M. Sedlmair, M. Brehmer, S. Ingram, and T. Munzner. Dimensionality
reduction in the wild: Gaps and guidance. Technical Report TR-2012-03, Dept. of Computer Science, University of British Columbia, 2012. [51] M. Sedlmair, C. Heinzl, S. Bruckner, H. Piringer, and T. Moller. Visual
parameter space analysis: A conceptual framework. IEEE Trans. on Visualization and Computer Graphics, 20(12):2161–2170, 2014. [52] M. Sedlmair, T. Munzner, and M. Tory. Empirical guidance on scatterplot
and dimension reduction technique choices.IEEE Trans. on Visualization and Computer Graphics, 19(12):2634–2643, 2013.
[53] J. Stahnke, M. D¨ork, B. M¨uller, and A. Thom. Probing projections: Inter-action techniques for interpreting arrangements and errors of dimension-ality reductions.IEEE Trans. on Visualization and Computer Graphics, 22(1):629–638, 2016.
[54] L. van der Maaten, E. Postma, and H. van den Herik. Dimensionality reduction: A comparative review. Technical report, Tilburg Centre for Creative Computing, Tilburg University, 2009.
[55] J. Venna, J. Peltonen, K. Nybo, H. Aidos, and S. Kaski. Information retrieval perspective to nonlinear dimensionality reduction for data visual-ization.Journal of Machine Learning Research, 11:451–490, 2010. [56] T. von Landesberger, S. Fiebig, S. Bremm, A. Kuijper, and D. W. Fellner.
Interaction taxonomy for tracking of user actions in visual analytics ap-plications. InHandbook of Human Centric Visualization, pages 653–670. Springer, New York, 2014.
[57] A. Wism¨uller, M. Verleysen, M. Aupetit, and J. A. Lee. Recent advances in nonlinear dimensionality reduction, manifold and topological learn-ing. InESANN 2010, 18th European Symposium on Artificial Neural Networks,Bruges, Belgium, April 28-30, 2010, Proceedings, 2010. [58] J. S. Yi, Y.-a. Kang, J. T. Stasko, and J. A. Jacko. Toward a deeper
understanding of the role of interaction in information visualization.IEEE Trans. on Visualization and Computer Graphics, 13(6):1224–1231, 2007. [59] B. Yu, R. Liu, and X. Yuan. MLMD: Multi-Layered Visualization for Multi-Dimensional Data. In M. Hlawitschka and T. Weinkauf, editors, EuroVis - Short Papers. The Eurographics Association, 2013.