T
Improving students learning process by
analyzing patterns produced with data mining
methods
Lule Ahmedi, Eliot Bytyçi, Blerim Rexha, and Valon Raça
Abstract— Employing data mining algorithms on previous student’s records may give important results in defining new ways of learning and during the process of development of a new curriculum for educational institutions. Creating group profiles by analyzing certain attributes of the students helps in defining more specifically the needs of the students. Achieving this requires manipulation of data in a structured database, and most important a complete data set, having that incomplete data sets may produce unreliable outputs. This paper presents the results of different data mining algorithms applied on previous student’s records to produce predicted success results, and the comparison with the real data in database. Results show that, even if there is lack of attributes, one may still apply certain data mining algorithms over school data to gain knowledge on the mainstream flow. Besides prediction, one can cluster data in order to get main characteristics on the student’s performance. The experiment presented in this paper will emphasize that dividing data in fewer classes will result in higher cluster sum of squared errors, which in fact show that there exist big difference between data.
Keywords—Educational Data Mining, Cluster Analysis, Classification, Student Success.
I. INTRODUCTION
ECHNOLOGY is used more than ever in education around the world. Kosovo is trying to catch up by integrating new technology in education. Primary and secondary education in Kosovo is organized in public and private institutions and as result of the ongoing reform, now the system in use is 5+4+3 years [1]. Even though, there are a big number of students passing through these institutions, student data in schools is saved in hand written diaries and not in electronic format and the only statistic derived from the diaries is the overall student success in a class. There are only few schools which have started using electronic records for storing student and teacher data. But, there is a tendency to change this situation and make all data in primary and secondary schools, both public and private, available in electronic form. That would greatly help in gathering
Lule Ahmedi is associate professor at University of Prishtina, Faculty of Electrical and Computer Engineering.
Eliot Bytyçi is teaching assistant at University of Prishtina, Faculty of Mathematical and Natural Sciences.
Blerim Rexha is associate professor at University of Prishtina, Faculty of Electrical and Computer Engineering.
Valon Raça is teaching assistant at University of Prishtina, Faculty of Electrical and Computer Engineering
information in a centralized database, which would result in easy statistical review and also in prediction of student success, among other. When such a database becomes available, one might use Educational Data Mining algorithms and tools, to predict and also support teachers in their everyday work. Besides, that database would help us to better understand the students’ learning process and their involvement in it, as well as help us find the way to improve the quality of teaching and learning in general. Some of the higher education institutions, according to [2] have started widely using Learning Management Systems, which also implies need for student success assessment.
Many research papers are produced aiming to predict students’ performance or other interesting facts regarding relation student-school. In [3] students are classified according to the features gathered from educational system in the web. Classification algorithms used in the research resulted in highest performance and best accuracy. In [4] regression algorithms for predicting student grades are used and the M5rules algorithm is considered as most appropriate for that research. Further in [5], four distinct data mining models (decision tree, random forest, neural networks and support vector machines) are used. The research assessed that in order to have better and more accurate results, one need to have more information regarding student grades but also background information (school related and personal ones – family situation) on the student.
Also there are many research papers related to clustering student data. In [6] results of the students were analyzed using clustering algorithms by arranging scores according to the level of performance. Conclusion of the research is that clustering algorithms serve as a good benchmark to monitor the progression of students’ performance in higher institutions [6]. In [7] mining student data is proposed in order to discover patterns reflecting their behavior.
II.DATA MINING OVER SCHOOL DATA
Before describing the process itself, one should mention that the most time consuming part of Data Mining is dealing with data [8]: finding data as well as data preprocessing. Data used in this research was found after days of meeting with different institutions and even when that resulted in success, still one can argue that data used are not the of the highest quality data or do not have enough attributes describing them (especially attributes related to their family background).
According to [9], quality of data is substantial but not always can one find qualitative data. Reason for that can be the lack of suitable databases, loss of data while merging databases etc. Lack of suitable databases is the case that follows our research, because school had only one database with all students’ data: name, date of birth, place of birth, class and success per subject integrated together.
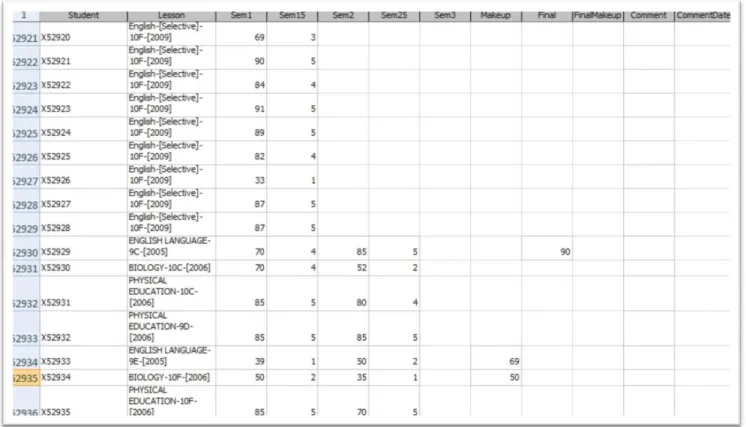
Student database, intended to be used in the research, had cardinality of 52936, but every student success in a subject was written as a single record. Besides that, student had five grades per subject during a school year (two for the semester and one final grade). Due to this all subjects related to a certain student had to be gathered, which resulted in smaller number of records. A part of the raw database is presented in table 1.
Table 1. Unprocessed database
Preprocessing of data is done in order to have more complete data (no attributes missing), to eliminate noise data and to be more consistent [10]. To achieve that, one most first “clean” its data. Method used was ignoring rows that have no data, in order not to add data and lose their originality. This was seen as the best solution for the specific database. Some other possible methods, that were not used, would be: a) adding data according to a specified “mean value” that would be taken – not used by us due to fact that one cannot be familiar with reason why data is missing – unless had worked with data during its preparation, and if used, result could be taken as an assumption, and b) putting a constant instead of missing data – not used by us due to fact that constant can be taken as a common thing between students who possess that constant. In some cases, missing data do not impose a mistake; just simply there are no data: e.g. data for the next semester are missing due to fact that when the data were collected, summer semester hasn’t started yet.
Another problem encountered was different spelling of text containing fields (e.g. city names, subjects, etc.), which was solved using the algorithm proposed in [11].
Data that contain noise can be removed by using few principles: binning – values close to each other take same value as their mean value; regression and/or clustering. Data used in the research had a specific domain (success measured by grade 1 to 5 or by percentage 0 to 100) so there were no noises present. Besides that, the normalization was not deemed
necessary as the difference between the attributes was not big. If one would encounter a grade greater than 5, then it would come to attention immediately that it is an inconsistency and that would mean removal of the data. Maybe one of the most important tasks in preprocessing of data, is data integration, that because of the possibility of losing specific data.
According to [12], systems developed today, use intercession architecture to achieve their goal: gathering information from different sources. In [12], LDAP and ontologies are used to integrate XML data. This research was fortunate to already have data integrated in one database. In the end, even if have a well formed and structured database with complete data, it is highly recommended to use a portion
of that data for research purposes. In the case of this research, specific class of attributes was used according to the values that they have. After the preprocessing, the database has 201 attributes and the only missing data, were data from the next semester.
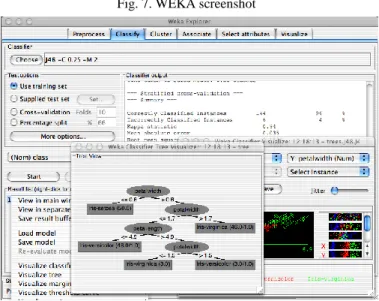
Tool used in the process – WEKA [13], was chosen due to few of its attributes (graphic interface, JAVA implementation, support of a big number of Data Mining algorithms) but also due to fact that it is free under GNU GPL license. WEKA screenshot is presented in the figure 7.
Fig. 7. WEKA screenshot
III. USE OF DATA MINING PREDICTION ALGORITHMS
In the research, three data mining algorithms were used: Naïve Bayes, C4.5 algorithm and k-Means algorithm. First two algorithms mentioned above are classification algorithms and the reasons why these algorithms were chosen to be used are: our database is a mixture of numeric and nonnumeric data; they can process more data and have minimum error rate compared to other algorithms [8]. Third algorithm used is clustering algorithm, chosen due to the fact that it is widely used and has shown very good results.
It should be noted that in Kosovo, all schools – elementary and secondary, have a kind of system of saving student data, even though most of them, do not have that system implemented electronically. Systems used have shortage or lack on saving the general information about the student: family background, schooling background, seminary work, homework and so on. And these shortages can be a crucial factor in determining the final performance of the students. According to [18], quality of data is crucial even though one cannot always obtain qualitative data. In [18], an approach to identify data with poor quality is pursued, and that based on the techniques of clustering and classification. That technique has found some very interesting problems related to data quality, such as wrong values given for a specific variable.
Our research aims to serve as a trustworthiness test, even though he database used is not the most completed one but is has very good and important attributes like the performance of the students during the last years. This performance is presented with total of 201 attributes. Even though according to a study for the correlation between attributes [19] it was shown that there is no relation between them, we tend to find the attributes that are most important ones according algorithms used.
Before applying a b o v e m e n t i o n e d algorithms, one most find the most important attributes of the database. For that an algorithm that is part of WEKA tool [13] was used. The algorithm is called CFS attribute subset evaluator, which will evaluate the value of a group of the attributes while taking into consideration their prediction ability [14].
Fig. 1. Attribute selection according to their importance In Fig. 1 attributes found and arranged starting from first found, since it was used search method called Best First are presented. Therefore, resulted data can be considered as equally important and one of the attributes for the research can be chosen.
The attribute chosen to use in the research is attribute number 77: Eng 2 10n – where extensions have following meaning: Eng stands for English language, 2 describes that data is part of second semester, 10 is for class level (from 1 to
12) and n is for final grade (since in the database there exist columns for separated grades for the first and second semester).
The chosen attribute is evaluated with two above mentioned algorithms: Naïve Bayes and C4.5, and that in different ways: by using cross validation 2 and 10 (same data are divided for training and testing) and also training set.
Naïve Bayes was chosen to be used in the research due to its characteristics: very fast and trustful but also due to the fact that it works very good also with a small number of data [8].
Classification is done in several ways: according to 5 grades used by Kosovo school system, according to two groups (high level grades and low level grades) and also according to pass or fail evaluation. As mentioned before, in our case we will use results of the students for the English language, tenth year and final grade.
Results will be compared with real data, gained by separating database according grades (1 to 5), shown in Table 2, and according to groups (group 0 – holding student with grades 1 and 2; group 1 holding student with grades 3 and 4 and group 2 holding student with grades 5), shown in Table 3 and called Group012.
In table 2, were students were separated by grades 1 to 5, we see that the higher percentage of the students have good grades or almost half of them have the best grade in English language. This can be accredited to young generation of people in Kosovo and their relation with English language, mainly through TV and internet but in rare cases also through direct communication (high international presence in Kosovo).
Table 3, provides another division of the students according to their grades but in this case not specific grades but grade groups: if student has 2 of the lower grades available then it will be put on the grade 0 column, otherwise if it has the best grade it will be put on grade 2 column and with middle grades filling out grade 1 column. This division is Similar with the division of pass and fail. Again we see that biggest number of students have the biggest grade (same as the previous division).
Group012
Nr. of student
Percentage
0
19
7%
1
123
45%
2
131
48%
Tables 2 and 3, are not just an overview of the student but also of the school success.
Table 2. Dividing students by grades 1 to 5
Grade
Nr. of student
Percentage
1
2
0.73 %
2
17
6.23 %
3
36
13.18 %
4
87
31.87 %
5
131
47.99 %
Table 3. Dividing students by Group012
Now data that we have gained from above mentioned divisions, will be compare to the data gained from the usage of the algorithms mentioned above: Naïve Bayes and C4.5 algorithms.
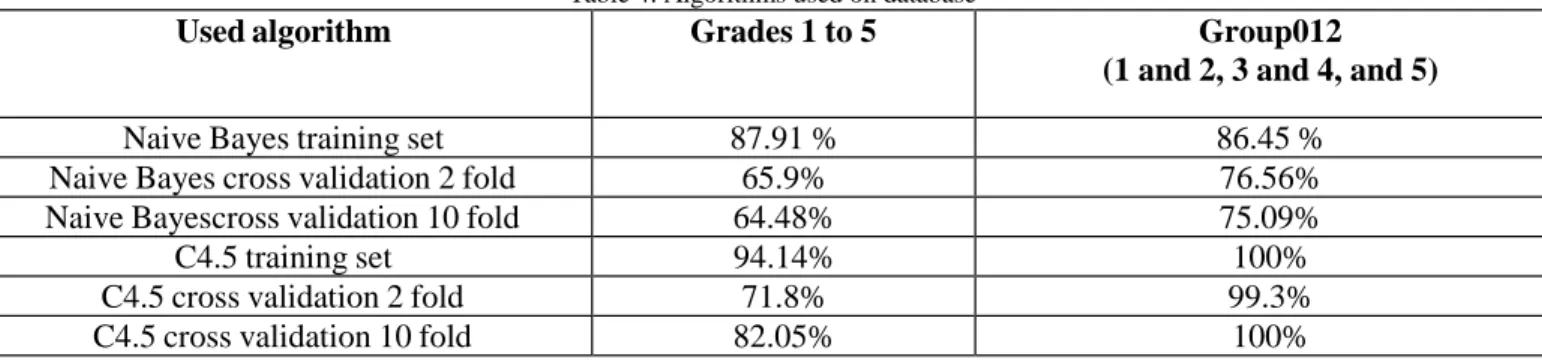
After using Naïve Bayes and C4.5 algorithms, data gained and presented in Table 4. Table 4 shows that when using Naïve Bayes algorithm, a higher percentage of accuracy was found while using 2 fold cross validation than 10 fold cross validation, and it is the contrary when using C4.5 algorithm. The C4.5 algorithm using cross validation 10 fold, resulted more successful, with 100 % accuracy. Maybe this result is dedicated to algorithm C4.5 because it has the best results in cases when attributes are not related one to another [15]. When using Naïve Bayes for grades 1 to 5, we have encountered following:
- Using training set: 87.91% of the data were classified
accurately, with most of mistakes happening in the classes 4 and 5 (15 with 13 wrong classifications).
- Using cross validation: 2 fold validation has an accuracy of 65.9% and 10 fold validation has an accuracy of 64.48%, this due to the fact that we do not posses very qualitative data. When using C4.5 algorithm for grades 1 to 5, we have encountered following:
- Using training set: accuracy 94.14%
- Using cross validation: 2 fold accuracy 71.8% and 10 fold accuracy 82.05%.
On the other hand, when using Naïve Bayes for Group division (Group012), we have encountered following:
- Using training set: 86.45% of the data were classified
accurately.
- Using cross validation: 2 fold validation has an accuracy of 76.56% and 10 fold validation has an accuracy of 75.09%. When using C4.5 algorithm for Group division (Group012), we have encountered following:
- Using training set: accuracy 100%.
- Using cross validation: 2 fold accuracy 99.3% and 10 fold accuracy 100%.
The results have shown that even though there is considered not such a good correlation between attributes, still one can use data mining algorithms to classify and predict student success. Table 4 shows that dividing students in three groups will get better results and it suggests that dividing students only in two groups (pass or fail) should result in even a better approximation to real results. Better results would be possible, if the database itself was more complete, which will be future domain – securing a more complete student database to mine and also dividing students according to pass or fail prediction.
Table 4. Algorithms used on database
Used algorithm
Grades 1 to 5
Group012
(1 and 2, 3 and 4, and 5)
Naive Bayes training set
87.91 %
86.45 %
Naive Bayes cross validation 2 fold
65.9%
76.56%
Naive Bayescross validation 10 fold
64.48%
75.09%
C4.5 training set
94.14%
100%
C4.5 cross validation 2 fold
71.8%
99.3%
C4.5 cross validation 10 fold
82.05%
100%
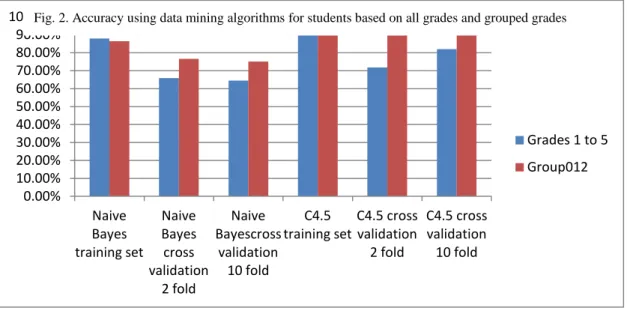
Fig 2 visualizes the accuracy of the algorithms used in the student database, both when all grades are separately considered (grades 1 to 5) as well as when grades’ grouping
Fig. 8. Eng 2 10n C4.5 Training set
(i.e. Group012) are used.
In the figure 8 and 9, we have presented one of the most accurate predictions, performed with C4.5 algorithm using training set and that on both cases – divided by grades 1 to 5 and divided by three groups (Group012).
Fig. 9 . Grup012 J48 training set
Besides classification, clustering was used to find characteristics on students. Clustering is a process of discovering groups of objects such that the objects of the same group are similar, and the objects belonging to different groups are not [16]. Cluster algorithms used is k-Means. According to [17], k-Means has a high accuracy in local cluster, while inter cluster relationship are not concentrated. K-Means algorithm is tested for data division in groups of 2, 3 and 5 as used in the classification part. The division in two classes, as seen in figure 3, has resulted in 45% of data belonging to class 0, which holds students with weaker success, compared to 55% of data belonging to class1, which holds students with greater success. In this and all other cases, where clustering algorithms were used, missing data are replaced with the average. Interesting about the two class division is that the sum of squared errors is quite high compared with the rest of the divisions. This sum represents the distance from the centroid or the mean element of the class.
0.00% 10.00% 20.00% 30.00% 40.00% 50.00% 60.00% 70.00% 80.00% 90.00% 100.00% Naive Bayes training set Naive Bayes cross validation 2 fold Naive Bayescross validation 10 fold C4.5 training set C4.5 cross validation 2 fold C4.5 cross validation 10 fold Grades 1 to 5 Group012
Fig. 2. Accuracy using data mining algorithms for students based on all grades and grouped grades
Fig 3a. Division of the data in two classes
Figure 3a, represents the division of the students in two classes, while figure 3b visualizes that division.
Division of the students in three classes gives better results with far smaller sum of squared errors. Class 1 in this case, holds students with best grades, followed by class 2 and class 0. Figure 4, shows that around 50% of the students have very good performance.
Fig 4. Division of the data in three classes
The last division is the one in five classes, which results as a most reliable, that due to fact that there are five grades that student can get. To strengthen even more the fact, the sum of squared errors is far smaller than in the two previous divisions, but still relatively high. Figure 5, shows the division in five classes
Fig. 5 Division of the data in five classes
Besides the percentage of the division, one can see also the visual representation of the division of the students, which is shown in figure 6, where clusters are presented in vertical plane and students (differentiated by colors) in horizontal plane.
Fig 3b. Visual presentation Cluster 1
Cluster 0
Cluster 4
Cluster 3
Cluster 2
Cluster 1
Cluster 0
Fig.6 Visual representation of the division of the students in five classes Due to sum of squared errors, one can verify that data used
have relatively great non-compliance, which can be as a result of relatively weak connections between attributes or data are not well organized or data are not complete – missing attributes, which can be taken as a main reason why the big sum of squared errors.
IV.CONCLUSION
Data mining over school data is generally a very complicated and time consuming process but the most time consuming part of it is finding data. Even in case that the data are found and made available, there is still no guarantee that those sound and complete. It should be noted that the most time consuming part of the data mining process, besides finding the data in some special cases, data preparation and completion. However, even with not as complete data as expected, one may still get an overview of general data flow and their tendencies. In our research, the C4.5 algorithm has shown to perform best for predicting students’ success, but that doesn’t mean that it would remain the same if data were more complete and the database would provide more attributes. As a future work, one needs to find a more complete database
(maybe filled with data gathered from eventual
questionnaires) and then by using the same or different data mining algorithms as used in this paper, try to compare results of a complete and less complete database. Another way to explore the future gathered data from schools is to have them electronically available and then analyzing those data.
REFERENCES
[1] Primary and secondary school data in Kosovo, http://www.rks-
gov.net/sq-AL/Qytetaret/Edukimi/Pages/ArsimiFillorDheMesem.aspx,
retrieved on May 30th 2012.
[2] Lejla Abazi-Bexheti, Arbana Kadriu, Lule Ahmedi. Measurement and Assessment of Learning Management System Usage. 6th WSEAS/IASME International conference on Educational Technologies (EDUTE ’10), May 2010, Tunisia, pp 183.
[3] Behrouz Minaei-Bidgoli, William F. Punch. Using Genetic Algorithms for Data Mining
Optimization in an Educational Web-based System. Genetic and
Evolutionary Computation Conference, July 2003 Chicago. Springer-
Verlag 2252-2263.
[4] S.B. Kotsiantis, P.E. Pintelas. Predicting Students Marks in Hellenic [5] P. Cortez and A. Silva. Using Data Mining to Predict Secondary School
Student
Performance. Proceedings of 5th FUture BUsiness 64 TEChnology
Conference (FUBUTEC 2008) pp. 5-12. Porto, Portugal, April, 2008.
[6] Oyelade O.J., Oladipupo O.O., Obagbuwa I.,C. Application of k-Means clustering algorithm for prediction of Students’ Academic Performance.
IJCSIS Vol. 7, Nr.1, 2010
[7] Talavera, L., & Gaudioso, E. (2004). Mining student data to characterize similar behavior groups in unstructured collaboration spaces. In Workshop on artificial intelligence in CSCL. 16th European conference
on artificial intelligence (pp. 17–23).
[8] Jiawei Han and Micheline Kamber. Data Mining: Concepts and Techniques, 2nd ed. The Morgan Kaufmann Series in Data Management
Systems. Kaufmann Publishers. March 2006
[9] Eshref Januzaj, Visar Januzaj. An Application of Data Mining to Identify Data Quality Problems. Proc. 3nd International Conference on Advanced Engineering Computing and Applications in Sciences (ADVCOMP
2009). October 11-16, 2009 - Sliema, Malta, IEEE Computer Society,
October 2009.
[10] Dorian Pyle. Data preparation for data mining. Morgan Kaufmann
Publishers Inc. San Francisco, 1999.
[11] Blerim Rexha, Valon Raça, Agni Dika. Enhancement of String Matching Queries on Albanian Names for Kosovo Civil Registry. International Conference on Applied, Numerical and Computational Mathematics (ICANCM ’11), September 2011, Spain, pp 206.
[12] Lule Ahmedi, Georg Lausen. Ontology-based querying of linked XML documents. Semantic Web Workshop at the 11th. WWW Conference,
Honolulu, Hawaii, USA, May 2002.
[13] Mark Hall, Eibe Frank, Geoffrey Holmes, Bernhard Pfahringer, Peter Reutemann, Ian H. Witten (2009); The WEKA Data Mining Software:
An Update; SIGKDD Explorations, Volume 11, Issue 1..
[14] Mark A. Hall. Correlation-based feature selection for machine learning.
Ph.D. thesis, Department of Computer Science, University of Waikato.
Hamilton, New Zealand. 1999
[15] J. R. Quinlan. Improved use of continuous attributes in c4.5. Journal of
Artificial Intelligence Research, 1996
[16] Csaba Legany, Sandor Juhasz, Attila Babos. Cluster validity measurement techniques. AIKED ’06 Proceedings of the 5WSEAS
International Conference on Artificial Intelligence, Knowledge engineering and Data Bases, pp 388-393
[17] M.Vijayakumar, S.Prakash, R.M.S.Parvathi. Inter Cluster Distance Management Model with Optimal Centroid Estimation for K-Means Clustering Algorithm.WSEAS Transactions on Communications, Volume 10 Issue 6, June 2011, pp 182-191
[18] Januzaj Eshref, Januzaj Visar: "An Application of Data Mining to Identify Data Quality Problems", in: Proc. 3nd International Conference on Advanced Engineering Computing and Applications in Sciences (ADVCOMP 2009), October 11-16, 2009 - Sliema, Malta, IEEE Computer Society, October 2009.
[19] L.S. Affendey, I.H.M. Paris, N. Mustapha, Md. Nasir Sulaiman, Z. Muda – Ranking of influencing factors in predicting students’ academic
performance, Information Technology Journal 9 (4):832-837, 2010