Predictive Models for Student Success
5/21/2012Joe DeHart
Des Moines Area Community College
1
Purpose
Des Moines Area Community College (DMACC) is currently implementing various changes to improve student success and completion. These changes are aimed at improving student progress through course retention, term-to-term persistence, and ultimately award completion. DMACC also realizes that improving student performance will increase enrollment without bringing new students into the college by reducing the number leaving the institution prematurely.
A primary key to student success is the ability to place them into courses that are appropriate for both their cognitive and affective development. Traditionally DMACC has relied on ACT and Compass placement exams and corresponding minimum placement or “cut” scores. Beginning in 2008 DMACC began pursuing the use of predictive modeling to leverage placement test scores by supplementing these with additional student data. As first-time college students go through the application, admission and registration processes, DMACC gathers additional information about each student and should be able to use this data to improve the predictive ability of placement test scores. DMACC has even more data on returning students including past academic performance.
This paper describes three predictive models for student success; a) first-time, first-term student success in a college level English course defined as receiving a C or better, b) time, first-term student success in a college level math course defined as receiving a C or better, and c) new and returning student likelihood of being placed on academic warning defined as earning a term GPA below 2.0 or not completing at least 67% of the credits attempted in a term. The models will be referred to as the English placement, math placement, and academic warning models respectively. These models were designed to predict outcomes of a given term with only data available to the college at the time students register for the term. Models were created using SAS Enterprise Miner with student data from fall 2006 through summer 2011. Fall 2011 data was scored against the models created to determine accuracy and will be shared as part of this paper.
Methodology Variable Selection
Predictive models have 3 primary types of variables; ID, Input, and Target. ID variables are not used to create the model but contain information identifying each record. Often these variables are a student’s school ID number or term they are attending. Input variables are used by the model independently and in combination with each other to determine their effect on the target variable. The target variable is a dichotomous variable (0 or 1), that indicates student success as defined in each model. The number of each type of variable and the number of student records used to create each model is shown in Table 1.
2
Table 1
Number of variables and records by model
Model # ID # Input #Target #Rejected # Records
English Placement 3 36 1 10 4,586
Math Placement 3 36 1 10 3,582
Academic Warning 3 45 1 1 94,042
Predictive modeling software is designed to handle as many variables for as many students as possible. Though the software used statistical significance throughout as it creates models, statistical significance is not an end in itself. Modeling software is designed to manipulate data to achieve the best predictive results possible. Input variables were chosen because they are known to the institution at the time of registration. Some variables such as test scores and registration dates have been analyzed previously by DMACC; however, many variables have not. The software also uses the interaction of variables to determine their effect on the target variable. Table 2 shows each variable, its role in each model, and a brief description of the variable. Table 2 Model variables # Variable ENG Role MAT Role ACAD WARN Role Description 1 SFRSTCR_PIDM ID ID ID Banner pidm 2 SFRSTCR_TERM_CODE ID. ID. ID. Current term code
3 id ID. ID. ID. Banner Student ID
4 trm_camp_numb Input Input Input Number of campuses enrolled in the current term
5 prev_ca_cred Rejected Rejected Input Number of career advantage credits prior to current term
6 trans_cred Input Input Input Number of transfer credits prior to current term
7 prev_dmacc_cred_earned Rejected Rejected Input Number of DMACC credits earned prior to current term
8 prev_dmacc_cred_pct_earned Rejected Rejected Input Percent of credits earned from those attempted prior to current term 9 prior_gpa Rejected Rejected Input Overall GPA prior to current term 10 app_campus Input Input Input Campus applied to for most recent
application prior to current term 11 app_coll Input Input Input College applied to for most recent
application prior to current term (SH, IT, etc.)
12 app_program Rejected Rejected Rejected Program applied to for most recent application prior to current term 13 app_prog_type Input Input Input Whether most recent application for
liberal arts or a CTE program 14 app_degc Input Input Input Award type sought on most recent
3
application
15 app_intent_transfer Input Input Input Flag whether their intent was to transfer or not
16 app_intent_unknown Input Input Input Flag whether their intent was unknown or not
17 apps_numb Input Input Input Total number of applications in Banner
18 trm_reg_start Input Input Input Number of days between first registration and start of term for the current term
19 trm_pct_online Input Input Input Percent of current term credits taken online
20 trm_cred_tot Input Input Input Number of credits enrolled in the current term
21 trm_online_only_flag Input Input Input Flag indicating all credits for current term taken online
22 trm_adj_only_flag Input Input Input Flag indicating all credits for current term taken with adjunct instructors 23 trm_pct_adj Input Input Input Percent of current term credits taken
with adjunct instructors
24 trm_eng_fac Input Input Input Indicates whether the student has an adjunct or regular college-level English instructor, or did not take college-level English in the current term
25 trm_eng_delv Input Input Input Indicates whether the student took college-level English online or via another method, or did not take college-level English in the current term
26 trm_mat_fac Input Input Input Indicates whether the student has an adjunct or regular college-level math instructor, or did not take college-level math in the current term
27 trm_mat_delv Input Input Input Indicates whether the student took college-level math online or via another method, or did not take college-level math in the current term 28 prev_cred_pseo Rejected Rejected Input Number of PSEO credits taken prior to
or during the current term 29 prev_cred_cross Rejected Rejected Input Number of Cross-Enrolled credits
taken prior to or during the current term
30 prev_bad_cred_mat Rejected Rejected Input Number of unsuccessful math credits taken prior to current term
31 prev_bad_cred_eng Rejected Rejected Input Number of unsuccessful English credits taken prior to current term 32 ACTM Input Input Input First ACT math score or converted
Compass math score
33 ACTE Input Input Input First ACT English score or converted Compass English score
34 ACTR Input Input Input First ACT reading score or converted Compass reading score
35 sex Input Input Input Sex of student
36 minstat Input Input Input Indicator whether student is white, race unknown, or minority
4
37 age Input Input Input age of the student at the start of the current term
38 age_grp Input Input Input Indicator of whether the student was 22 years old or younger or older than 22 years old at start of current term 39 hs_grad Input Input Input Indicator of whether the student
graduated high school or earned a GED
40 hs_ged Input Input Input Did the student earn his or her GED (y/n)
41 hs_transcript Input Input Input Does DMACC have a hs transcript on file (y/n)
42 fina_aid_app Input Input Input Has the student applied for financial aid (y/n)
43 firstgen Input Input Input Has the student self-identified as first generation college (y/n)
44 income Input Input Input 2000 Census zip code median household income
45 pct_hs Input Input Input 2000 Census zip code percent hs graduates
46 pct_aa Input Input Input 2000 Census zip code percent aa graduates
47 pct_ba Input Input Input 2000 Census zip code percent ba gradautes
48 newret Rejected Rejected Input Flag for whether student is new or returning
49 trm_type Input Input Input Indicator whether term is fall, spring or summer
50 target_eng Target Rejected Rejected Was college-level English grade at or above a 2.0 (C) (1/0)
51 target_mat Rejected Target Rejected Was college-level math grade at or above a 2.0 (C) (1/0)
52 target_gpa_comp Rejected Rejected Target Was either the term gpa <2 or the percent of attempted credits earned less than 67%
All variables come from DMACC’s Banner Student Information System with the exception of the income and educational attainment variables (#44-47) that come from the 2000 census. These variables will be updated with 2010 data as soon as they become available. Datasets used to create models are balanced for the target variables with the same number of successful and unsuccessful students. For example, if the actual percentages of successful to non-successful students are 70% and 30% respectively, the datasets used to create models are artificially adjusted to 50% and 50%. This allows for better pattern identification within the data.
However, the models are adjusted for the actual percentages for model evaluation, comparison and scoring of new data.
5
Models
The models developed for this project follow the same seven steps within the SAS Enterprise Miner software and are described in Table 3.
Table 3
Model creation process Step Description
1 The initial dataset is randomly split into two datasets, training and validation. Models are created on the train dataset and then validated using the validation dataset.
2 Logarithms of some data are calculated when the data has a large range of values. This retains relative differences, but reduces the range by placing variables in a scale from 0 to 1
3 Missing data may be imputed using the mean for each imputed variable. An additional input variable is created in the dataset indicating whether or not this variable was imputed.
4 Various models including Decision Trees, Logistic Stepwise Regression, and Neural Networks are created. Models created may vary depending on the characteristics of the original dataset
5 Models are evaluated according to misclassification rates yielding the most predictive model
6 If needed, the winning model is described using a decision tree to help identify contributing variables
7 New data not included in the original data sets is scored using the winning model In all models, placement test data for English, reading and math are either native ACT scores provided by ACT, or corresponding Compass scores converted to ACT scores using a
concordance provided by ACT.
The procedure that provided the lowest misclassification rates for all models created was the neural network procedure. This is not uncommon due to the power of the neural network procedure and the fact that the same variables are being used to create each model. Due to the complexity of the neural network procedure and the use of hidden or contrived variables, contributing variables cannot be examined directly in a neural network. However,
approximations of the final models can be examined using a decision tree procedure which allows for at least 81% of contributing factors to be examined. This will be discussed later for each model.
Figures 1-5 are outputs provided by the SAS Enterprise Miner software and do not indicate how well each model performs in predicting outcomes for new students, but rather only describes the
6
best model created using only the original variables. Boxes within these figures show counts and percentages based on the decision the model made for each student and do not represent actual student percentages. Darker boxes indicate better differentiation from a 50/50 split. Each diagram begins with the most relevant variable and branches according to naturally occurring breaks determined by each model. Model accuracy and actual student percentage will be examined later in this paper.
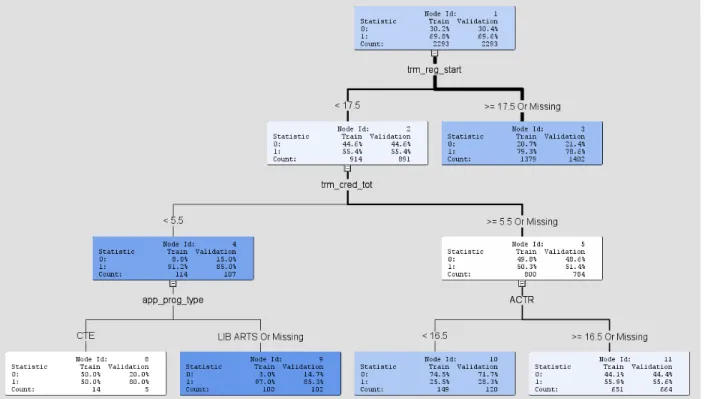
English Placement Model
Two English placement models were created. The first model uses all input variables shown in Table 2 and the second only uses placement test data (ACT or converted Compass). Both models were created using only first-time DMACC students taking a college-level English class their first term that reduced both the number of variables useful in the analysis and the number of student records available to each model.
Figures 1 and 2 show description trees approximating the models created by the neural network. Figure 1 is for English placement using all input variables, and Figure 2 uses only placement test data. Figure 1 represents 81% of the contributing variable in the final neural network and Figure 2 represents 97%.
Figure 1- English placement model using all variables
In Figure 1, 81% of the final model can be described as a combination of number of days prior to the start of a term that a student registers, the number of credits they register for in their first term, whether they are a CTE or Liberal Arts students, and ACT reading placement exam score.
7
Though they are not the final variables used in the model, they are a good approximation of what the final neural network found useful.
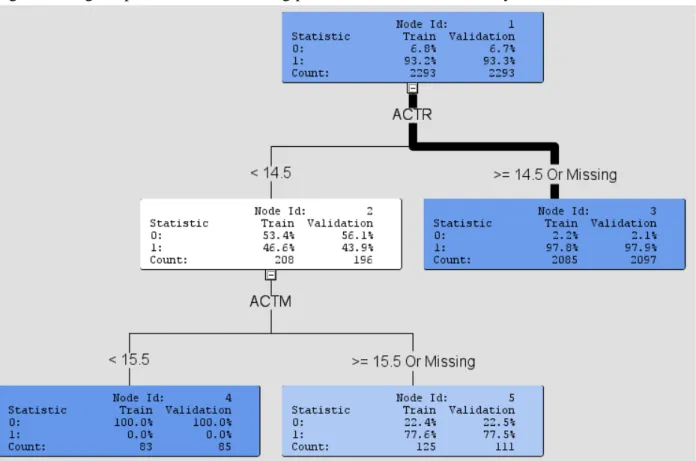
Figure 2- English placement model using placement test score data only
In Figure 2, 97% of the final model can be described as a combination of ACT reading score and ACT math score. ACT English exam score is not a major contributor to the best English
placement model. Also, branch scores in both exams are significantly lower than our current “cut scores”.
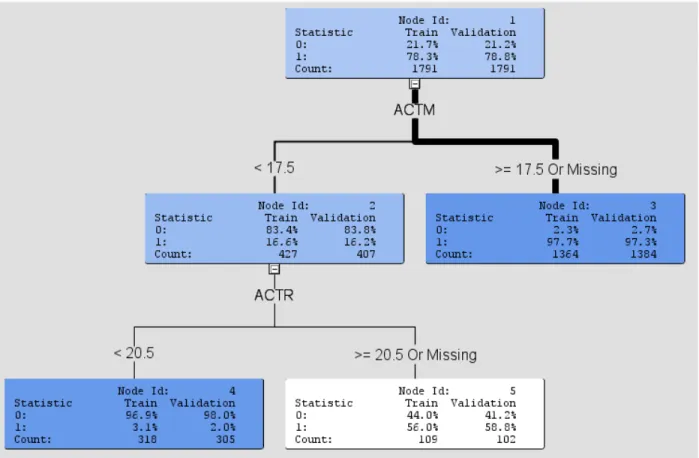
Math Placement Models
Similar to the English placement models, two math placement models were created; one with all input variables shown in table 2, and the other only using placement test data. These models were created with only first-time DMACC students taking a college-level math course in their first term.
Figures 3 and 4 show description trees approximating the models created by the neural network. Figure 3 is for math placement using all input variables, and Figure 4 if for math placement using only placement test data. Figure 3 represents 87% of the contributing variable in the final neural network and Figure 4 represented 96%.
8
Figure 3- Math placement model using all variables
In Figure 3, 87% of the final model can be described as a combination of ACT Math placement exam score, degree sought, presence of a financial aid application, and the percent of high school graduates in their home zip code. Interesting in this model is that the ACT Math placement exam branch score is similar to our “cut score”.
9
Figure 4- Math placement model using placement test score data only
In Figure 4, 96% of the final model can be described as a combination of ACT math score and ACT reading score. In both the English and math placement models, reading placement score has been a significant contributor to each model and English placement score has not
significantly contributed to either model. Academic Warning Model
Only a single model was created to predict whether a student would be put on academic warning at the end of a semester. This model used significantly more student records as it is not limited to first-time students taking a particular course, and scores each student for each semester. This semester also used more input variables as shown in Table 2 since it can use historical
performance and other data for each student. Figure 5 represents 88% of the variables contributing to the final neural network model.
10
Figure 5- Academic warning model
In Figure 5, 88% of the final model can be described as a combination prior GPA, percent of completion of attempted coursework, presence of a financial aid application, and ACT English placement exam score. This model is self-evident in that the two variables making the most significant contribution to the final model are the same variables the model is trying to predict. Though ACT English placement exam score was not a significant contributor to any of the placement models, it is a significant contributor to a subset of students in the academic warning model.
11
Model Accuracy
The English and math placement and academic warning models described previously have the strongest predictive ability given the data available. This section will illustrate how well each model accurately predicted student success prior to the start of the fall 2011 term. Fall 2011 data was scored according to the best models described above to determine their accuracy. In fall 2011, there were 16,588 students scored by each model. Though all students were scored with the English and math placement models, results are given only for those that actually took a college-level English or math course. Career advantage students were excluded from model creation and are excluded from those students being scored. All variables used from fall 2011 are available prior to the start of the term. Only the end-of-term target variable was appended to evaluate each model.
English and math placement test model accuracy is compared to the accuracy of using only the appropriate placement test score. Chart 1 shows student performance based on ACT English placement exam score corresponding to DMACC’s current placement practices with Charts 2 and 3 showing accuracy of the two English placement models described earlier. Similarly, Chart 4 shows student performance based in ACT math placement exam score with Charts 5 and 6 showing accuracy of the previously described math placement models. Each chart shows a red line embedded on a secondary axis showing the number of students for each test or model score. The last column in each chart is the mean success rate for the students included in the evaluation of each model.
Two factors are used primarily to evaluate each model. To have good predictive ability, the model must clearly differentiate students based on score so that higher scores result in higher levels of success. Also, models must spread out the distribution of students as much as possible so that students are distributed across the range of scores as much as possible.
12
English Placement Exam and Model Accuracy
Chart 1- College-level English course success by ACT English exam score for fall 2011
Chart 1 shows little differentiation in student success in college-level English by ACT English placement score currently used in placement for new students in fall 2011. Students scoring from between 16 and 30 have success rates hovering at or around the mean. It does appear that exceptionally high or low exam scores do result in differentiated performance but with very few students at these extremes. Most students are grouped between the scores of 18 and 24.
Chart 2- College-level English course success by all-tests model score for fall 2011
Chart 2 represents the model using all placement test scores. It shows some predictive ability based on model score, but still concentrates students around a central mean.
0 20 40 60 80 100 120 0 10 20 30 40 50 60 70 80 90 100 0 2 4 6 8 10 12 14 16 18 20 22 24 26 28 30 34 Me an N % S uc ces sf ul Test Score 0 50 100 150 200 250 0 10 20 30 40 50 60 70 80 90 100 10 30 40 50 60 70 80 90 Mean N % S uc ces sf ul Model Score
13
Chart 3- College-level English course success by all-variables model score for fall 2011
The model using all available variables including test scores had higher predictive ability than the ACT English exam or the model created using all placement exam scores. Students with a model scores at or below 30 are about 30% successful while those with scores between 80 and 90 were about 80% successful. The distribution of students is also spread out across more scores.
Math Placement Exam and Model Accuracy
Chart 4- College-level math course success by ACT math exam score for fall 2011
Chart 4 shows subtle differentiation in student success in college-level math by ACT math placement score. Students scoring from between 20 and 30 have success rates above the mean.
0 20 40 60 80 100 120 140 0 10 20 30 40 50 60 70 80 90 100 10 20 30 40 50 60 70 80 90 100 Mean N % S uc ces sf ul Model Score 0 10 20 30 40 50 60 0 20 40 60 80 100 120 14 16 18 20 22 24 26 28 30 32 Mean N % S uc ces sf ul Test Score
14
However, the majority of students scored between 16 and 24. ACT math exam shows better differentiation than the ACT English exam.
Chart 5- College-level math course success by all-tests model score for fall 2011
Chart 5 shows that the all-tests model does a much better job of differentiating student success based on model score. It also does a much better job of distributing students across scores than ACT math exam alone. This model shows a smaller range of scores with no one scoring at the lowest and highest ends of the model.
Chart 6- College-level math course success by all-variables model score for fall 2011
Chart 6 shows modest improvement in both differentiation of student success by score and distribution of students along the score range over Chart 5. Students with model scores of 20 to
0 20 40 60 80 100 120 0 10 20 30 40 50 60 70 80 30 40 50 60 70 80 Mean N % S uc ces sf ul Model Score 0 10 20 30 40 50 60 70 80 90 0 10 20 30 40 50 60 70 80 90 100 20 30 40 50 60 70 80 90 Mean N % S uc ces sf ul Model Score
15
30 also tend to be about 20-30% successful. The model does a better job differentiating student success at the upper and lower ends showing less differentiation in the mid-range of 50-70. Academic Warning Model
Because the model for academic warning has both more student data to work with since it was created for all students new and returning and more variables brought into the model, it is better able to predict the likelihood of students being placed on academic warning for any given term. Chart 7 shows a strong delineation of student performance as model scores move from low to high. Only 20% of students are successful as measured by staying off academic warning with model scores around 10 while students scoring 90 are 85% successful.
Chart 7- Academic warning likelihood by model score for fall 2011
Conclusions
The following statements summarize the models described in this paper;
1. Predictive models created using placement exam score supplemented with additional student data are better able to predict student success defined as English or math placement, or avoiding academic warning.
2. The ability to predict student likelihood of meeting the requirements to be placed on academic warning for each term is the strongest model due to the larger pool of students included in the model and the increased number of variables available.
3. Individual model scores will be updated each term to allow a student’s model score to increase or decrease according to their performance.
4. Models are recreated each term using the most recent student data available to keep the models updated by responding to emerging student trends. Models effectiveness will also be monitored to make sure the models created continue to have sufficient predictive ability.
0 500 1000 1500 2000 2500 3000 3500 4000 4500 5000 0 10 20 30 40 50 60 70 80 90 0 10 20 30 40 50 60 70 80 90 MeaN N % S uc ces sf ul Model Score
16
5. New variables can be added at any time to the models as they become available.
Recommendations
The following recommendations are given to improve models and the modeling process, and to implement the usage of these models to improve student success:
1. Model scores should be imported into Banner similar to the process used to import ACT test scores. Model scores are created for each student by both their student ID number and the internal Banner PIDM number to facilitate this upload.
2. Training should be provided for advisors and counselors about what the scores mean and how they are to be used. The scores, at a minimum, can be used as an advising tool to help students make appropriate decisions regarding their education.
3. The addition of high school transcript information has the potential to greatly improve the accuracy of these models. Short of having high school course-level performance
information, high school GPA and class rank should be data entered into Banner for use in these models. An additional study is being conducted to test the correlation of high school performance variables with DMACC success with a random sample of 300 students. 4. The math placement models may be useful in discussions regarding implementation of the
ALEKS math assessment software in defining which students are ready for college-level work, need ALEKS directed remediation, need developmental coursework such as MAT 064, or may need a math boot camp experience.