flBSTRRCT
MING-Tfl HSIEH Preliminary Study of the Growth of Metallic Aerosols
under Reduced Pressure Environment. (Under the direction of Dr.
PARKER C. REIST and Dr. PHIL ft. LAWLESS)The growth behavior of metallic aerosols under normal and
reduced pressure environments was investigated. Particles grown at
both environments exhibit very irregular profiles. Particles' growth,
in general, can be categorized into three types in this study, they
are: cluster-cluster aggregation, particle-cluster aggregation, and
ballistic aggregation.A descriptor, called fractal dimension, is applied to quanti
fying the effect of reducing the pressure on the growth of particles.
According to the measurements of fractal dimension, at higher
pressure, 0.1 and l.O atm., clustei—cluster aggregation occurred at
the early stage of growth; while particle-cluster aggregation
ACKNOWLEDGMENTS
The author wishes to express his appreciation to his advisor, Dr. Parker C. Reist, for his
guidance and direction. Gratitude is also due
to Dr. Phil A. Lawless, Research Triangle
Institute, for his valuable advices.
Appreciation is likewise expressed to my dear
friends for their encouragement during writing
this report.
TABLE OF CONTENT
I. Introduction ... 1
1.1 Growth of Metallic Aerosols ... 2
1.2 Fractal Dimension ... 5
II. Experimental Apparatus ... 8
11.1 Introduction to the Exploding Wire Generator ... 8
11.2 Sampling Devices ... 10
11.3 Pumping and Pressure Measuring System ... 13
11.4 Other Equipments ... 13
II. 5 System Assembly... 14
II.6 Sampling Technique... 14
III. Analyses... 17
111.1 Scanning Electron Microscope ... 17
111.2 Fractal analysis ... 17
1. Perimeter Method... 17
2. Dilation Method... 18
IV- Results... 23
IV. 1 Selection of Metallic Wire... 23
IV. 2 Electron Micrographs Made by SEM... 24
IV.3 Fractal Analysis ... 25
VI. Summary... 51
VII. References... 53
VIII. Appendix... 60
LIST OF FIGURES
Figure Title Page
2.1 Basic Scheme of an Exploding Wire Generator 8
2.2 Side-View of the Main Chamber 11
2.3 In Situ Sampler, (a) Opened, (b) Closed 12 2.4 Assembly of Experimental Apparatus IS 3.1 Shape Representing an Image of a Particle for 19
Fractal Analysis
3.2 Tiling of Shape by (a) Unit Squares, (b) Squares 20 of Side 2, (c> Squares of Side 3
4.1 Electron Micrograph of Agglomerates, 1 atm. 26
Sample Taken at 37 sec. After Explosion. 20,000x
4.2 Electron Micrograph of Agglomerates, 1 atm. 26
Sample Taken at 26. 3 min. After Explosion. (a) 20, e00x, (b) 2,000x
4.3 Electron Micrograph of Agglomerates, 1 atm. 27 Sample Taken at 129.5 min. After Explosion.
(a) 20,000x, (b> 2,000x
4.4 Electron Micrograph of Agglomerates, 1 atm. 27 Sample Taken at 194.8 min. After Explosion. 20,000x
4.5 Electron Micrograph of Agglomerates, 0.1 atm. 28 Sample Taken at 30 sec. After Explosion.
4.6 Electron Micrograph of Agglomerates, 0.1 atm. 29 Sample Taken at 30 min. After Explosion.
(a) 20,000x, (b),<c) 4,000x
4.7 Electron Micrograph of Agglomerates, 0.1 atm. 30 Sample Taken at 60 min. After Explosion.
(a) 20,000X, (b) 4,000X, (c) 600x
4.8 Electron Micrograph of Agglomerates, 0. 1 atm. 31 Sample Taken at 120 min. After Explosion.
(a) 4,000x, (b) 800X
4.9 Electron Micrograph of Agglomerates, 0.1 atm. 31 Sample Taken at 180 min. After Explosion.
(a) 4,000X, (b) 800X
4.10 Electron Micrograph of Agglomerates, 0.01 atm. 32 Sample Taken at (a) 26 sec, 20,000x, (b) 29.8 min.,
12,000X, After Explosion.
4.11 Fractal Analysis for the Particle in Fig. 4. 1 33
4.12 Fractal Analysis for the Particle in Fig. 4.2(a) 34 4.13 Fractal Analysis for the Particle in Fig. 4.3(a) 35 4.14 Fractal Analysis for the Particle in Fig. 4.5(b) 36 4.15 Fractal Analysis for the Particle in Fig. 4.6(a) 37 4.16 Fractal Analysis for the Particle in Fig. 4.7(a) 38 4.17 Fractal Analysis for the Particle in Fig. 4.9(a) 39 4.18 Fractal Analysis for the Particle in Fig. 4.10(a) 40 4.19 Fractal Analysis for the Particle in Fig. 4.10(b) 41 4.20 Fractal Analysis for the Particle Taken at 66.7 min. 42
After Explosion at 0.01 atm.
5.1 Fractal Dimension Measured by Random Walk Method 45
LIST OF TABLES
Table Title Page
1.1 Fractal Dimensions Obtained from Two-Dimensional 7
Aggregation Models
4.1 Measurements of the Charge Levels on Different 23
Aerosols
5.1 Fractal Dimensions of Experimental Particles 47
I. Introduction
Aerosol growth is an area of study most interesting to aerosol technologists. For the past few decades much of research has been concentrated on particle coagulation due to Brownian motion.CI-9] However, almost all studies considered the atmospheric pressure parameter as a constant having a value of one atmosphere, so that
these studies were only applicable to the atmosphere near the surface of the earth. The pressure in the upper level of the atmosphere is
less than 1 atm, decreasing exponentially as the altitude increases. Thus in the upper reaches of the atmosphere the gas mean free path is r»o longer ttie same as used in the traditional growth model. In other words, to study aerosol growth in the upper atmosphere, it is necessary to take into account the parameter of gas mean free path,
i.e. gas pressure.
One of the major goals of this report is to investigate the growth behavior of metallic aerosols at several reduced pressure environments. To do this we have explored the use of a recently developed descriptor to characterize the shape of grown aerosols, called the fractal dimension of the particle.
Traditionally, the term most often used in characterizing aerosols is aerodynamic diameter. In many cases, however, aerodynamic
diameter is hard to describe the irregular aggregates very well and cannot tell much characteristics of the irregular aggregates. It is the fractal dimension that can describe certain rugged profiles.
-Fractal dimensions are numbers between the classical whole number dimensions of 1, 2, and 3. This term was first introduced by Mandelbrot in 1977.C103 He suggested that the concept of dimension can be extended from integer values of 1, 2, and 3 by the addition of a fractional value describing the space filling power of a boundary
or a surface. Thus a line of fractal dimension 1.4 would fill space
more efficiently than an extremely straight line, whose fractal dimension is l.O, even though both would be topologically of dimension 1. Similarly, a rugged surface with fractal dimension 2.4 would fill space more than a surface of fractal dimension 2.0 or 2.2.
I-1 Growth of Metallic Aerosols
Metallic aerosols investigated in this report were generated
by the Exploding Wire Generator (EUG), which will be described in Section II. The first step of growth is the nucleation of
aerosols from the vapor phase, the second step is the liquid metal coagulation, and the third step is the growth of solid
aerosol particles. The time needed for the first two steps to go
to completion is extremely short, so that observation is very difficult. Only the growth of solid aerosols could be "seen" via
filter sampling at different times (see electron micrographs).
According to the literature, [11-223 formation of aggregates can be characterized in two categories: particle-cluster growth model, and cluster-cluster growth model.
applied to the formation of aggregates in a vide variety of systems. This approach has been particularly successful in developing a better understanding of aggregation phenomena. In
the 1960s, the earliest model for computer simulation of floe formation in colloidal systems were carried out by VoldC23,24]
and Sutherland et al.[25,26] In these studies, particles were
added to growing clusters of particles via randomly oriented
trajectories, without including the effects of Brownian motion.
A reasonable model of cluster formation in the colloidal
systems should include the effects of long- and short-range interactions, particle size distribution and irregular shapes, hydrodynamic interactions, clustering of clusters, etc.[12] Recently, Witten and 5ander[20] have introduced a particle-cluster aggregation model where the effects of Brownian motion were included.
Witten and Sander start with a single-seed particle at the origin of a lattice. A second particle is added a long distance from the origin and undergoes a random walk on the lattice until it reaches a site adjacent to the seed and becomes part of the growing cluster. Then, a third particle is introduced at a random distant point and undergoes a random walk until it also becomes part of the growing cluster. The procedure is repeated until a cluster of sufficiently large size is formed.
using linear trajectories. In recent years, Paul Heakin has
explored a series of investigationst11-17] regarding the
diffusion-limited aggregation in two- and three-dimensional simulations, in which both linear and random walk (Brownian)
trajectories are considered and in which both particle-cluster growth model and cluster-cluster growth model are taken into
consideration.
In the original Witten-Sander model, all growth originates from a single immobile growth site and only one particle is allowed in the vicinity of the growing cluster at any time. These features are unrealistic for many real colloidal systems. [14] In Heakin's model, clusters of particles, as well as single particles, are allowed to diffuse; clusters of all sizes
stick together on contact.[14]
1.2 Fractal Dimension
Before discussing the fractal dimension, it is necessary to
know what "fractals" are. Fractals are mathematical entities
which have been developed to describe the geometrical simila¬ rities between irregular systems. This is a relatively new
branch of mathematics and is increasingly applied to the
problems dealing with irregular shapes.
According to Mandelbrot C£7], fractals can be categorized into two kinds: mathematical fractals and natural fractals, fin ideal fractal mathematical curve has two important properties.
First, it has an indeterminate boundary magnitude approaching to infinity. Secondly, it is mathematically self-similar at any two different scales of scrutiny; in other words, the boundary
looks the same whatever magnification is used in the examination of the structure of the curve, ft natural fractal is a curve whose structure appears indeterminate at a series of resolutions but may ultimately exhibit other significant geome¬
trical behavior when measured at a sufficiently high level of resolution. Methodology for measuring the fractal dimension will be discussed in Section III.
An approach to the description of rugged profiles using the concepts of fractal dimension to describe irregular profile of a fine particle has been widely developed by Brian H. Kaye and co-workers. C£8-33] The concept of the fractal dimension of a non-Euclidean boundary is introduced by Mandelbrot.C10] The origin
of "fractal" comes from the Latin adjective "fractus", meaning
"irregular" or "fragmented". In his book Mandelbrot describes the ruggedness of a line as its space filling ability and assigns a dimension between one and two to the structure of a line depending on its ability to fill space. 12.71 A simple
example is a straight line of traditional Euclidean geometry, which has a fractal dimension of 1; the trajectory of Brownian motion on a flat plane has a fractal dimension of £.
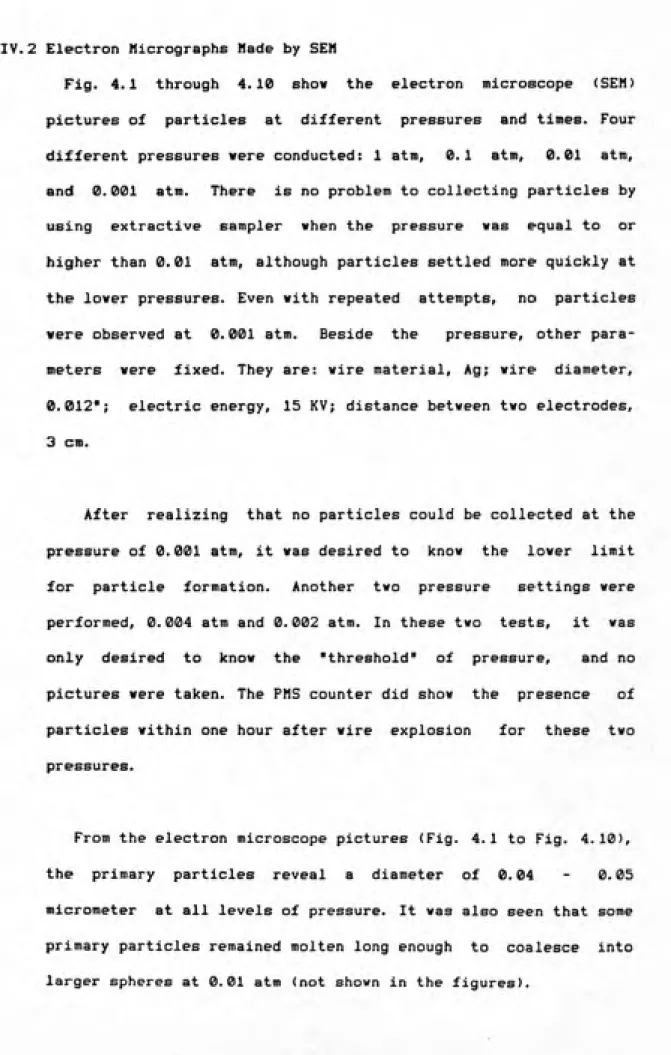
Those studies dealing with computer simulations of growth models, as discussed previously, also worked out the measurements of fractal dimension of corresponding growth model. Table 1.1 summarizes these characteristic values of fractal
Table 1.1 Fractal Dimensions Obtained from Two-Dimensional
Aggregation Models
SBBsrrs8ss==ss=ssrs==rss==ssss==s==r==s=s====ss==sssssss=ss:
Model D
Linear trajectory,
particle-cluster 1.95 ± 0.002 [121
Brovnian trajectory,
particle-cluster 5/3 [20]
Brownian trajectory,
particle-cluster 1.73 ± 0.06 [12,13] Linear trajectory,
cluster-cluster 1.50 ± 0.05 [15]
Brovnian trajectory,
II. Experimental Apparatus
II.1 Introduction to the Exploding Wire Generator
Metallic aerosols to be studied in this report are generated by the Exploding Wire Generator (EWG). The principle of aerosol generation is that the EWG supplies enough energy to vaporize a piece of wire mounted on tvo electrodes. After the wire is
vaporized, i.e. exploded, condensation proceeds right avay, and aerosols are condensed from the vapor phase. Figure 2.1 shovs
the basic scheme of an EWG.[34]
2 1
7
1
s
----
/ <
f / <
CHV
[ ""<
.
\ ^
. s, _
^^
T C; Low inductance capacitor
HV: High voltage pover supply
SI: Trigger switch
tf: Wire inside exploding chamber E
T: Timer for automatic dumping switch
S2: Dumping svitch
The physics of the exploding vire phenomena is veil investigated in the literature.[34-37] In general, the previous studies indicated that aerosols generated by the EWG have the
following characteristics:
1) The primary particles form chain-like structures of smooth
spherical particles, whose size distribution can be characte¬ rized by a log normal distribution.
2) The mean diameter of these primary particles are between 0.01 and 0.1 micrometers in size, depending on the parameters
used in their generation, such as electrical energy or diameter
of wire.
3) The aerosols are reproducible if they are generated under the same operating conditions.
The EWG used for this study is a Tobe Deutschmann Laboratories Model ESB-118 energy Storage System. It is a self-contained 9 kilojoule system consisting of three main assemblies: Capacitor Bank, Power and Relay Tank, and Control Console.
This system is designed around a 45 jxf, 20 KV capacitor and a
high voltage trigger unit. The capacitor may be charged up to 25 KV as desired. A push-button switch is used to remotely triggerthe capacitor to discharge the stored energy through a wire
mounted across two electrodes. A dumping switch can be used to discharge the capacitor without exploding the wire when the test
is to be aborted. Pushing the "Start Charge" button connects the
high voltage power supply to the capacitor and starts the
two-minute time delay automatic dump circuit which is provided for
safety purposes. This assures that no charge will accidentally
be left on the Capacitor Bank. The circuit is designed so that
it allows 15 seconds for the operator to trigger the capacitor
for explosion before the system automatically dumps the charges
on the capacitor. After wire explosion, the circuit will automa¬
tically dump the residual charge left on the capacitor through
a grounded wire. The distance between two electrodes is adjust¬
able; the mass of wire exploded may be altered by changing the
relative positions of electrodes, because sometimes it is
necessary to obtain higher mass concentration or number concen¬
tration of particles.
II.2 Sampling Devices
1. Laser Aerosol Spectrometer
This is an optical particle counter manufactured by Particle
Measuring System, Inc. It is used to monitor particle size dis¬
tribution and, roughly, number concentration. A size range of
0.09 to 3.0 micrometers is covered by this counter.
2. 47-mm Filter Holder
A 47-mm, 0.05 micrometer nuclepore filter is used to
collected particles for Scanning Electron Microscope (SEM)
analyses, and then image analyses on computer.
This Is a large stainless steel pipe tee, amounted on the top
of the Exploding Wire Generator, with a volume of 74.6 liters.
Fig.2.2 shows a side-view of this chamber.
No
Main Chamber
To Pressure Sensor
To Sampling Devices
Fig. 2.2 Side-View of the Main Chamber
4. Extractive Sampling Chamber
This is a small chamber, with a volume of 145 cc, located
near the center of the exploding chamber (main chamber).
Extractive sampling is used because of the difficulties of
collecting particles without disturbing the gas pressure in
exploding chamber. Particles captured in this chamber can be
quickly raised to atmospheric pressures and flushed through
several sampling devices described above.
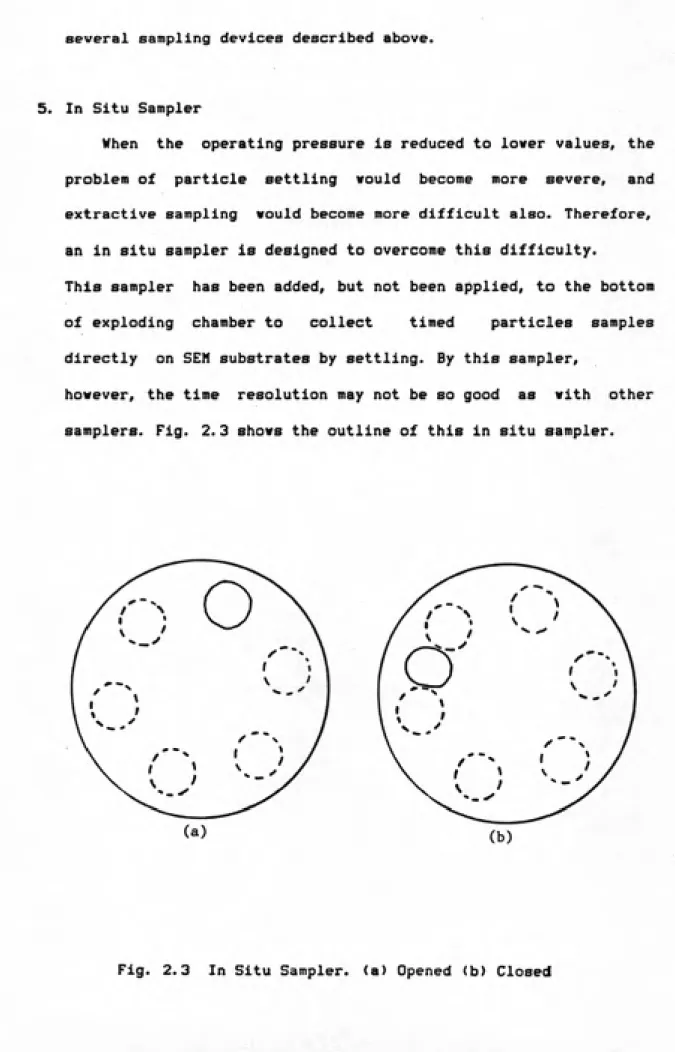
5. In Situ Sampler
When the operating pressure is reduced to lower values, the problem of particle settling would become more severe, and extractive sampling would become more difficult also. Therefore, an in situ sampler is designed to overcome this difficulty.
This sampler has been added, but not been applied, to the bottom of exploding chamber to collect timed particles samples directly on SEN substrates by settling. By this sampler,
however, the time resolution may not be so good as with other samplers. Fig. 2.3 shows the outline of this In situ sampler.
O
O
There are six positions, where SEM substrates are located,
on the sampler to collect settled particles, i.e. this sampler
is designed such that only six samples can be obtained in an
experiment. Essentially, this sampler consists of tvo round
plates; one of them has one hole on it, and the other one has
six. The one, having one hole, amounts atop the other one. When
sample is to be taken, turn the plate on the top so that the
hole on the top coincides one of six holes on the bottom plate;
otherwise, turn it to the "blind" area as illustrated in Fig.
2.3.
11.3 Pumping and Pressure Measuring System
The pumping and pressure measuring system are interfaced to
the exploding chamber through vacuum-tight flanges on the arms
of this chamber. A mechanical vacuum pump, direct drive vacuum
pump, manufactured by Precision Scientific Group, is applied to
provide reduced pressure. This pump can provide an ultimate low
pressure dovn to 0.1 ^m Hg absolute. System pressure is
monitored by the Barocel Electronic Manometer which can be
calibrated by a Hcleod gauge if necessary.11.4 Other Equipment
1. Faraday Cage Filter and Electrometer
This assembly was used in the early stage of experiment to
measure total charges on aerosols. In practice, a metallic
aerosol which would have a low residual electrostatic charge is
desired.
-2. Video Capture System -- PC-EYE, Computer Software
This system has been set up in order to analyze the fractal
dimensions of particles. It consists of a video camera, an image
analyzer board and a software package for the IBM-PC. A particle
image on an electron micrograph is digitized by this system and
then stored as a file to the floppy disk for further analyses.
This video capture system, called PC-EYE, is a commercial
product distributed by Chorus Data Systems, Inc.
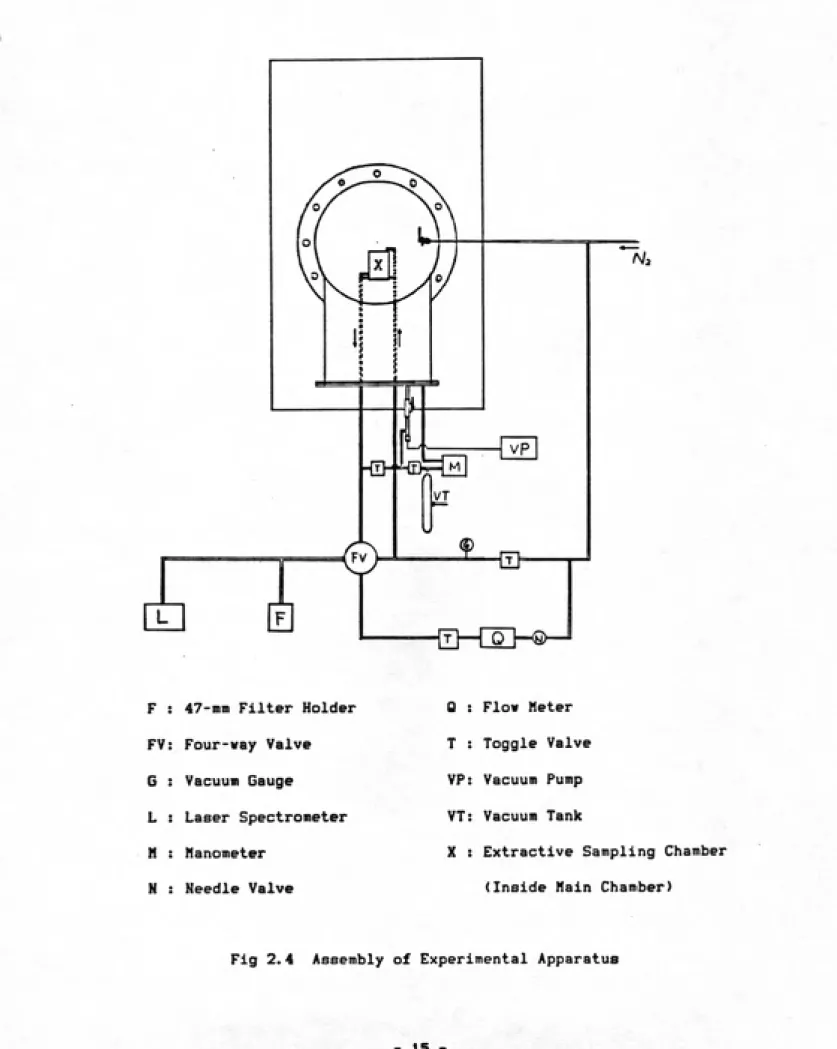
II. 5 System Assembly
Figure 2.4 shows the assembly of entire chamber and monitoring
system (top view).
II.6 Sampling Technique
It was readily known that aerosols generated from EWG were
oxidized in normal air. In this study oxidized metallic aerosols
are not desired, so that pure nitrogen is used as the gas medium
to prevent metallic aerosols from being oxidized. Before the
wire is exploded, it is required to "clean" the exploding
chamber such that no particles other than exploded aerosols
exist. This was done by evacuating the exploding chamber and
filling it with pure, filtered nitrogen at least three times,
and then adjusting the pressure to the desired value.
M
{?}—Tol-^S)—*'
F : 47-mm Filter Holder
FV: Four-way Valve
G : Vacuun Gauge
L : Laser Spectrometer H : Manometer
N : Needle Valve
Q : Flow Meter T : Toggle Valve VP: Vacuum Pump VT: Vacuum Tank
X : Extractive Sampling Chamber
(Inside Main Chamber)
Fig 2.4 Assembly of Experimental Apparatus
chamber's door is closed, the pressure is raised vith nitrogen
gas, and then nitrogen flushes the particles out to the sampling
devices, laser spectrometer, and nuclepore filter. The nitrogen
flushing rate is 10 cc/sec, of which 1 cc/sec is applied to
laser counter; the remaining 9 cc/sec of aerosol is collected
by the filter.
After all of the particles in the sampling chamber have been
flushed out (this can be monitored by the laser counter), the
sampling chamber is pumped out to the pressure of main chamber.
Then sampling chamber's door is opened to receive particles
III. Analyses
111.1 Scanning Electron Microscope
Every filter sample is examined by scanning electron
microscopy (SEM). On the SEM in use, the maximum magnification for a picture with good resolution is about £8,0i30x. On certain electron micrographs, the primary particles are hard to identify, but appears to be about 0.04 - 0.05 micrometer spheres. Even so, this is not a major limitation, because in this study the measurement of size distribution of primary
particles is not crucial.
For each filter sample, cut off about 1 square centimeter of
this sample. Stick it on a specimen stub with carbon substrate, and then examine it by the scanning electron micrometer.
111.2 Fractal Analysis
There are two ways applicable to fractal analysis: perimeter
method (or compass walk method), and dilation method (or covering squares method).
1. Perimeter (Compass Walk) Method
The basic concept of this method is to estimate the perimeter
of a profile by drawing a polygon around this profile. If P represents the estimated perimeter of the profile, i.e. exact perimeter of corresponding polygon, and S represents the length of each side of polygon; the plot of ln(P) versus ln(S) would be a straight line with a slope of m. The fractal dimension of this
-profile is then calculated by D = 1 - m
To measure it practically, take a drafting compass and open it to a stride length B. Starting at one end of Ferets diameter, swing the legs of the compass from the outside inwards to meet the profile, and then make repeated swings, until the compass returns to the starting point. There is a brief discussion of alternate ways to swing the compasses. IclBl It should be noted, however, that a consistent method must be used throughout the
entire analyses.
This analytical method seems easier than dilation method <to
be described in the next section), but is a tedious process and
will consume much more time than the dilation method because it
can not be easily computerized.
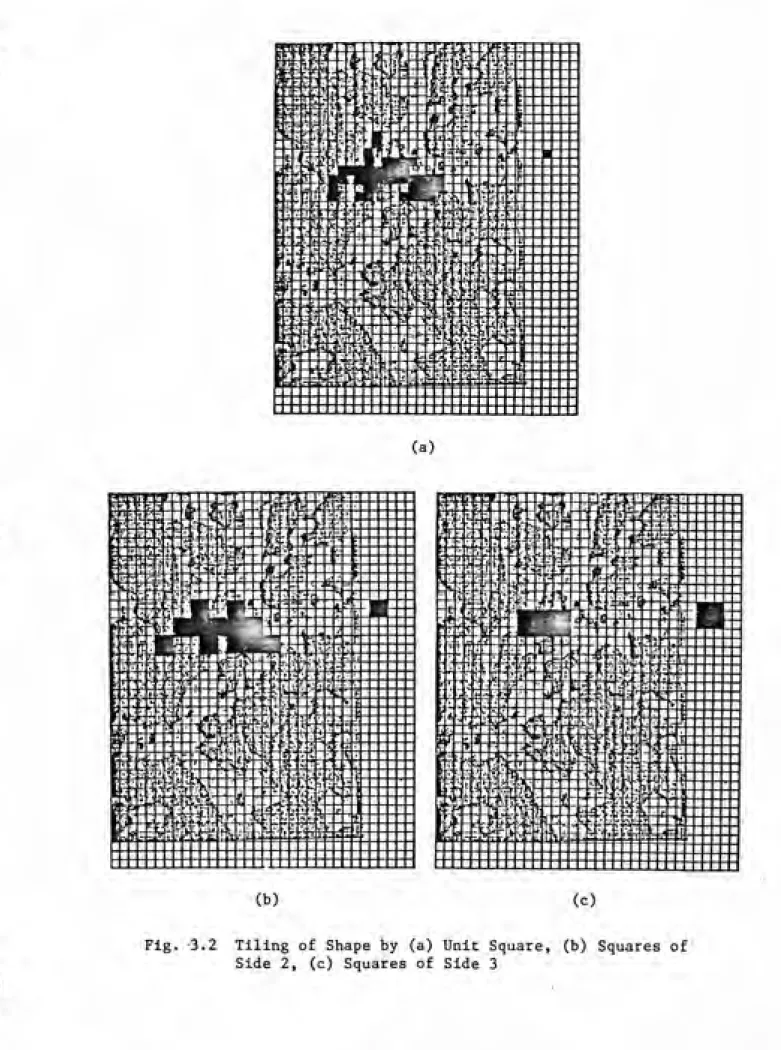
2. Dilation (Covering Squares) Method
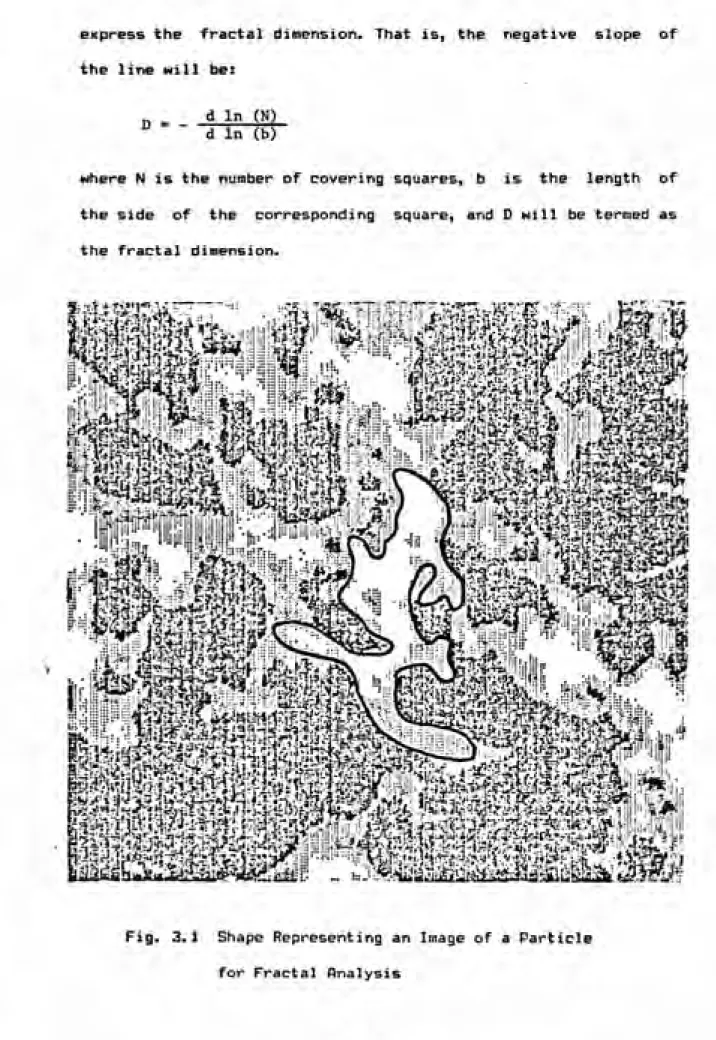
Consider an arbitrary planar profile, as illustrated in Fig.
3.1 outlined by the heavy line. The figure is then covered with a plane covering pattern of different scales, such as regular
express the fractal dimension. That is, the negative slope of
the line will be:
n = d In (N)
" " d In (b)
where N is the number of covering squares, b is the length of
the side of the corresponding square, and D will be termed as
the fractal dimension.
i^S*ifei«.r..: ':*K»f:i-s*nn;n;TT:
^%mmmmmm^
.\:: :•:".:ͣ-:; Si feu? ^M^i^
mmm
fe'^SS
'": :;i l&*^
in"»:::J
Fig. 3.1 Shape Representing an Image of a Particle
for Fractal Analysis-(a)
rr?E?i
)fXiv
iMi^
ffl
(b) (c)
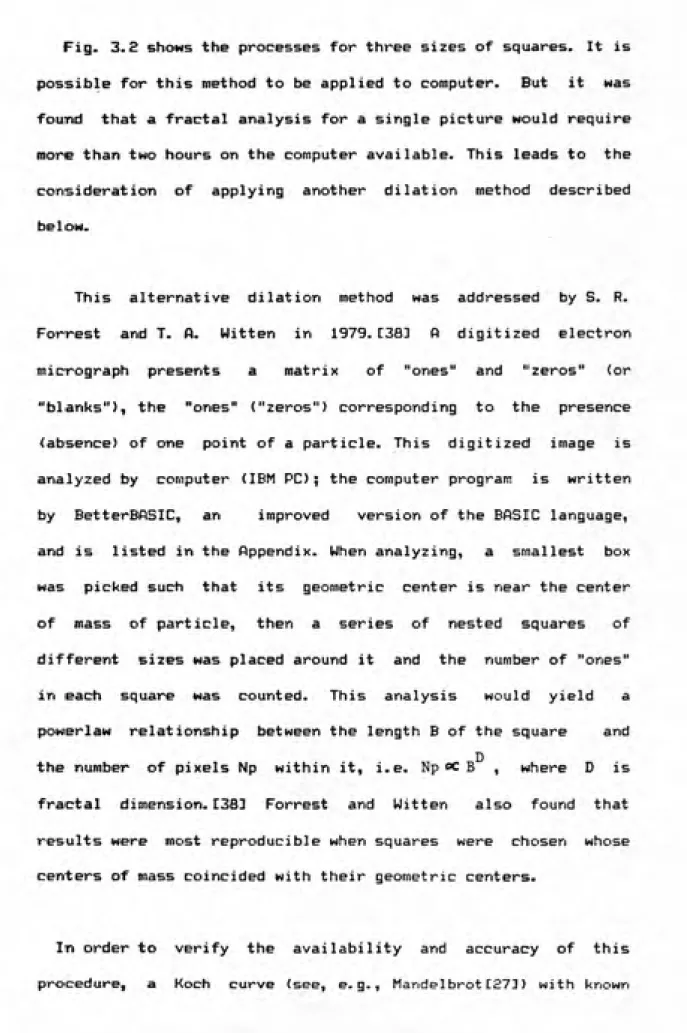
Fig. 3.2 shows the processes for three sizes of squares. It is
possible for this method to be applied to computer. But it was
found that a fractal analysis for a single picture would require
fflore than two hours on the computer available. This leads to the
consideration of applying another dilation method described
below.
This alternative dilation method was addressed by S. R.
Forrest and T. A. Witten in 1979.[38] fi digitized electron
micrograph presents a matrix of "ones" and "zeros" (or
"blanks"), the "ones" ("zeros") corresponding to the presence
(absence) of one point of a particle. This digitized image is
analyzed by computer (IBM PC); the computer program is written
by BetterBOSIC, an improved version of the BftSIC language,
and is listed in the Appendix. When analyzing, a smallest box
was picked such that its geometric center is near the center
of mass of particle, then a series of nested squares of
different sizes was placed around it and the number of "ones"
in each square was counted. This analysis would yield a
powerlaw relationship between the length B of the square and
D
the number of pixels Np within it, i.e. NpoCB , where D is
fractal dimension.[383 Forrest and Witten also found that
results were most reproducible when squares were chosen whose
centers of mass coincided with their geometric centers.
In order to verify the availability and accuracy of this
procedure, a Koch curve (see, e.g., MandelbrotE273) with known
-fractal dimension of 1.500 was analyzed. A mean value for this
test was 1.509, within 1% of accuracy. There are two limitations for this method, which were also stated by Forrest and Uitten. One is due to the finite total number of pixels in the image analyzed, the other is due to the finite size of digitized
image. The first limitation will cause the exponent of the power
law, D (fractal dimension), approaching 0. The second limitation results in the data span being limited to a range of B. Despite
IV. Results
IV.1 Selection of Metallic Wire
The earliest experiments were engaged in the selection of metallic wire. Two criteria are required: low melting point and low residual charge on the particles generated from wire explosion. The higher melting point metals appear to become
thermally ionized during the explosion, while the low melting
point metals could be easily dispersed without ionization. Besides, it is also necessary to have a wire that low residual electrostatic charges can be built up on the particles after explosion, such that electrically dominant forces would not influence the growth of particles. The charges on numerous metalaerosols were measured with a Faraday cage filter. After trying
Cu, Ag, Ho, and Al, Ag wire was chosen. Table 4.1 lists the
measurements of the charge levels on different aerosols.
Table 4.1 Measurements of the Charge Levels on Different Aerosols
Charge/Mass Space Charge
Material ( C/g ) ( C/m^ )
Ag 3.5 E-8 2.9 E-9 Ag 3.9 E-a 2.1 E-9 Ag 1.1 E-8 7.5 E-10
Cu 4.3 E-9 1.0 E-9
IV. 2 Electron Micrographs Wade by SEM
Fig. 4.1 through 4.10 show the electron microscope (SEM) pictures of particles at different pressures and times. Four different pressures were conducted: 1 atm, 0.1 atm, 0.01 atm, and 0.001 atm. There is no problem to collecting particles by using extractive sampler when the pressure was equal to or higher than 0.01 atm, although particles settled more quickly at the lower pressures. Even with repeated attempts, no particles were observed at 0.001 atm. Beside the pressure, other para¬ meters were fixed. They are: wire material, Ag; wire diameter, 0.012*; electric energy, 15 KV; distance between two electrodes,
3 cm.
After realizing that no particles could be collected at the
pressure of 0.001 atm, it was desired to know the lower limit for particle formation. Another two pressure settings were performed, 0.004 atm and 0.002 atm. In these two tests, it was only desired to know the "threshold* of pressure, and no pictures were taken. The PMS counter did show the presence of particles within one hour after wire explosion for these two
pressures.
From the electron microscope pictures (Fig. 4.1 to Fig. 4.10), the primary particles reveal a diameter of 0.04 - 0.05
IV.3 Fractal Analysis
Fig- 4-11 to Fig- 4.20 are the plots of fractal analysis for the particles grown at different pressures (1-0 atm, 0.1 atm, and 0.01 atm). The fractal dimension revealed in the figures, as
determined by one of dilation methods, do show a pressure dependent as well as time dependent tendencies.
For the particles grown at one atmosphere, the fractal dimension in the range of 0.07 to 0.5 micrometer is about 1.3 at short times after wire explosion, and increased to about 1.45
two hours later. The value of 1.45 is characteristic of clustei—
cluster agglomeration, cm i.e. the particle growth is due largely to the coagulation of clusters of particles of com¬ parable sizes. Also in one atmosphere, particles grown above 0.5 micrometer have a fractal dimension of 1.7, which is close to the value of 5/3 expected for particle-cluster agglomeration.
In 0.1 atmosphere, particles exhibited the same general trend; where the range of clustei—cluster growth was from 0.08 to 0.3 micrometer, and the particle-cluster growth range was from 0.5
micrometer and higher.
In 0.01 atmosphere, however, there was an opposite trend. The smaller size range (from 0.07 to 0.5 micrometer) showed a fractal dimension in a range from 1.4 to almost 1.7. While at size of 0-5 micrometer and up to about 1.0 micrometer, the
fractal dimension was about 1.35. This will be discussed later.
-?^^^
i
^*«r^?''
^i^u^ jiyUMI
Fig. 4.1 Electron Micrograph of Agglomerates, 1 atm. Sample Taken at 37 sec. after Explosion. 20,000x
i^Ji-ikk^^
s^>i.:^^^;>^^
7
^^#IW
iC.:l»^52:?g>
iMMpypi s^:l^3S?
<*iSff3l,.^-3Wi?:at'i>?n-i»:
^h^'
wmm^'^-
^^'
iMiaS
m
t.^4'¥s^^^':i^i£^^B*
-'itam^;:^^
""-^"^ 'ͣͣ
^""-Fig. A.3 Electron Micrograph of Agglomerates, 1 atm.
Sample Taken at 129.5 min. after Explosion.(a) 20,000x, (b) 2,000x
Fig. A.A Electron Micrograph of Agglomerates, 1 atm.
Sample Taken at 194.8 min. after Explosion. 20,000x
-CSS^f&iii
l'^?«»! warn
t-J^m^XS^^-^*^' Sif; ' ^ 'f**-^-' *'rfH;a: *^j»«**'«
r.
Fig. 4.5 Electron Micrographof Agglomerates, O.I atm.
BWsL".!^--'^
^V/'sTl
UbM
i
^^
Fig. 4.6 Electron Micrograph of Agglomerates, 0.1 atm.
Sample Taken at 30 nln. after Explosion.
(a) 20,000x, (b),(c) A.OOOx
-ir^m
^j^r^;B^^0.
^^^m^i^i-a J'«Wi.!iiPL f|.iy wrmrmfsmmmmmmm
&
ͣ
> "Cti •-'--4*^ V -^r^.^^-.:.v^..- -.;;-''.
.>^.Vij:-:^^..^^r- ;^;-:--i-.^.-^^j'j*xr^?<?d(Sg-^ rA
Fig. 4.7 Electron Micrograph of Agglomerates, 0.1 atm.
Fig. A.8 Electron Micrograph of Agglomerates, 0.1 atm..
Sample Taken at 120 mln. after Explosion.
Ca) A,000x, (b) BOOx
I
^EM'jEESi^,^
i^feAaa-f fei ^li JUA..:Fig. A.9 Electron Micrograph of Agglomerates, 0.1 atm.
Sample Taken at 180 mln. after Explosion.
(a) A.OOOx. Cb) BOOx
^
^
mS.*-V
^^*^
i©^?^^^^-i£^^^^
gi.»^.--^'v^- ^-rife^- .JL-.. oiiK>:.-;L%
Fig, A.10 Electron Micrograph of Agglomerates, 0.01 atm.
Sample TAken ar (a) 26 sec, 20,000x, (b) 29.8 mln.,
J.U,UUU
5,000 —
D = 1.713 /
2,000 —
/
Np
/
1,000 —
/
500 —
/
D - 1.267200
-/
inn
1
11 1
I0.02 0.05 0.1 0.2
B (pi)
Fig. 4.11 Fractal Analysis for the Particle in Fig. 4.1
0.5 1.0 2.0
-10,000
/
5,000
2,000 U
1,000
—
' D = 1.370
500
u
200
—
y
100 1 1 1 1
1 J
0.02 0.05 0.1 0.2 0.5 1.0 2.0
B ( ^m )
10,000
5,000
-2,000
D = 1.451 1,000
100
0.02 0.05 0.1 0.2 0.5 1.0
B C^m )
Fig. 4.13 Fractal Analysis for the Particle in Fig. 4.3(a)
2.0
-10,000
5,000 —
i
2,000 — D = 1.469
/
1,000 —
/
500
-• ͣ
/
D = 1.227200 —
>
/
•
100 1 1 1 1 1
0.02 0.05 0.1 0.2 0.5 1.0
B ( /im )
Fig. 4.14 Fractal Analysis for the Particle in Fig. 4.5(b)
10.000
/
5,000 1—
>
/
2,000
h-D = 1.706
/
^P
11,000
r
500 i— •
/
D = 1.414200 ^
/
inn
1
1
1 1 10.02 0.05 0.1 0.2 0.5 l.O
B ( pm )
Fig. 4.15 Fractal Analysis for the Particle in Fig. 4.6(a)
2.0
10,000
5,000 —
D = 1.628
/
2,000 —
Np
1,000 1
/
ft
500
/
D = 1.392200—
inn
}
1 1 1 I 1
0.02 0.05 0.1 0.2 0.5 1.0
B ( ;im )
Fig. A.16 Fractal Analysis for the Particle in Fig. 4.7(a)
•
10»000
5,000 —
2,000
1,000
500 —
200-lOQP 0.1
I
D = 1.617
I 1
D = 1.882
1
10.2 0.5 1.0 2.0 5.0
Fig. 4.17 Fractal Analysis for the Particle in Fig. 4.9(a)
10
-10,000
5,000
—
*
/
/ D = 1.167
2,000 —
N?
kl,000
D = 1.425
500 —
/
•
200 —
•
100 1
1
11
1
0.02 0.05 0.10 0.50
1.0
0.20
B ( jam )
Fig. 4.18 Fractal Analysis for the Particle in Fig. 4.10(a)
10,000
5,000
2,000
D = 1.264
Nf
D = 1.492
1,000
500
200
100
0.02 0.05
_I___
0.10
1
_J___0.50
_L_ 1.0
0.20
B ( pm )
Fig. 4.19 Fractal Analysis for the Particle in Fig. 4.10(b)
2.0
10,000
5,000
2,000
N f
1,000
500
200
100
0.02
D = 1.389
D = 1.699
1 I
0.05 0.10 0.20
B ( pn )
0.50 1.0 2.0
V. Discussion
From the electron micrographs (Fig. 4.1 to Fig. 4.10), it is seen that at normal pressure (1 atm) particles tend to form a plane, chain-like agglomerate (Fig.4.1 to Fig. 4.4). At short time after vire explosion, the agglomerates exhibit an outline of linear chain
(Fig. 4.1). At the later stage of growth, branched chain agglomerates appeared (Fig. 2 to Fig. 4). these branched chain agglomerates,
obviously, are built up from a linear chain base. Besides, those branches are not long compared to their parent chain. Comparing these chain-like agglomerates it is found that the chains formed at earlier stage of growth are opened and smaller than those formed at later stage of growth, in that closed chains were observed (Fig. 4.1 and Fig. 4.2 versus Fig. 4.3 and Fig. 4.4).
As the pressure was reduced, distinct differences were observed. At 0.1 atm (Fig. 4.5 to Fig. 4.9), agglomerates are still chain-like. Nontheless, these chain-like agglomerates are more compact, or
ͣ
thicker" (i.e. no longer in two dimensional pattern but three dimensional), than those formed at 1 atm; and the formation of closed
chain agglomerates seemed to be earlier. As pressure went even lower, at 0.01 atm, grown particles were still in the form of chain;
however, they became more and more compact, i.e. space among particles was less, than those grown at higher pressures (see Fig.
4.10). The reason is that the growth at lover pressure, say 0.01 atm,
is due largely to ballistic collision of particles rather than Brownian motion. This leads to the fact that either individual-particles or clusters of -particles are more likely to penetrate inside a groving cluster of particles than to stick around it, such that a very compact structure of aggregate is formed. On the other hand, at higher pressure, say 0.1 atm and 1.0 atm, the interaction of the gas molecules vith the particles is essential in the aggregation process in vhich particles are more likely to stick around the periphery of a growing aggregate than to penetrate into it, such that an open structured aggregate is formed.
From the SEM micrograghs, it is obvious that the major effect of reducing gas pressure on particles' growth is that particles will grow into more compact structures. To quantify this effect, a
descriptor named fractal dimension is applied.
Before measuring fractal dimensions, it should be noted that
fractal dimension can be used to describe the ruggedness of an object
only when this object exhibits fractal characteristics. It is
necessary to realize whether or not the grown particles generated in
this study reveal fractal characteristics.
Consider, for example. Fig. 4.6. Fig. 4.6(a) is a magnified picture of the particle laid on the left side of Fig. 4,6(b). Compare these two pictures, it is found that the structure of the particle
shown on Fig. 4.6(a) is similar to that of the particle laid on right
side of Fig. 4.6(b). They are constructed by the base of closed-chain structure. If we take a closer look at this particle, however, the
found that this agglomerate is added up with spherical primary
particles even though the resolution gets higher and higher. Beyond
this magnification, probably 25,000x or more, the boundary of the
agglomerate becomes a smooth finite profile and exhibits Euclidean
structure rather than fractal structure, since spheres are Euclidean
objects. By definition (see Section I) particles exhibiting the above
described behavior are characterized as natural fractals, provided
they also exhibit scale invariance of some properties.
50
6 a.
20
u
iU
a
^10
u
a. 5
• : 1.0 atm K : 0.01 atm
1 X
D - 1.29
D - 1.15
X
D = 1.57
D - l.Al
X X
0.02 0.05 0.10 0.2 0.5 1.0
Step Size ( pi )
2.0 5.0
Fig. 5.1 Fractal Dimension Measured by Compass Walk Hethod
-If ve use compass valk technique (perimeter method) to measure the fractal dimension of a natural fractal, the plot on log-log scale
would shov tvo linear regions (e.g. see Fig. 5.1). The linear region
at higher resolution describes the general structure of the profile,
the other region at lower resolution describes the packing texture of
the Bubunits (i.e. primary particles). Kaye suggests the former be
described as structural fractal and the latter as textural fractal.
1281 Furthermore, the break-point between these two linear regions should be theoretically at the dimension of the discernible subunit.
[301
The method used to measure fractal dimension in this study is dilation method which is described in Section III.2. Fig. 4.11 through Fig. 4.20 are log-log plots derived from the analysis of the digitized images of 5EH micrographs. Unlike the plot shown in Fig. 5.1 which is obtained from the analysis using compass walk method, these plots show positive slopes. This is true because they are based
on the relation described in Section III. 2: Np^t^B • More actually,
this relation can be written into
where H is the mass enclosed within a sphere of radius R. In this
relation it assumes that the center of mass of the particle be the
center of the circle.
According to the experience derived from analyzing those
object should be expanded around the center of mass of the object. This requires at least an evaluation of the center of mass. Secondly, the slope of the plot is very sensitive to the initial location of the smallest box. In other words, small changes in the location of the smallest box will result in fluctuating slopes. This occurs even though the largest boxes contain the whole image; in that case the total number of pixels (which are coded "1") is the same. To overcome these problems, an averaging technique has been applied. Several expansion centers were chosen in order to derive an averaged plot. That is to say. Fig. 4.11 to Fig. 4.20 are all averaged plots.
Table 5.1 Fractal Dimensions Determined by Dilation Method
1.0 atm 0.1 atm 0.01 atm Time* D Time D ' Time D
0.6 1.267 (0.07-0.5)«» 0.5 1.227 (0.08-0.3) 0.5 1.425 (0.07-0.2)
1.713 ( > 0.5) 1.469 ( > 0.3) 1.167 ( > 0.2)
26.3 1.370 30 1.414 (0.08-0.2) 30 1.492 (0.1-0.5)
129.5 1.451 1.706 ( > 0.2) 1.264 ( > 0.5)
60 1,392 (0.06-0.5) 67 1.699 (0.1-0.4)
1.628 ( > 0.5) 1.389 ( > 0.4) 180 1.617 (0.3-0.9)
1.882 ( > 0.9)
• Time is counted after wire explosion and is in a unit of minute.
•• Unit in the parentheses is in micrometers.
-Table 5.1 lists the measures of fractal dimensions determined by the dilation method. In this table, most of the values of fractal dimensions exhibit two regions. There is no evidence showing that,
like the plot of compass walk method, the break point is near the size of primary particles. However, this can be described as two stages of growth. For example, let us take a look at the fractal dimension of a grown particle at 30 minutes after explosion under 0.1 atmosphere of pressure, fit the early stage of growth (growing from 0.08 to 0.£ micrometers), the fractal dimension of 1.414 manifests a clustei— cluster aggregation. While at the later stage of growth (growing from 0.£ micrometers and larger), the fractal dimension of 1.717 reveals that particle growing at this stage is in particle-cluster aggregation.
For the particles grown at one atmosphere, at short time after explosion, the fractal dimension in the range of 0.07 to about 0.5 micrometer is about 1.3, and is about 1.7 for the range above 0.5 micrometers. Two hours later, it increases to about 1.45 which is a characteristic value of clustei—cluster aggregation (see Table 1.1). The value of 1.7 is close to the value of 5/3 which is an anticipated value for particle-cluster aggregation (see also Table 1.1). The trend of growth at this pressure manifests that clustei—cluster
agglomeration will be dominated for long-term coagulation.
fit 0.1 atmosphere, particles' growth reveals similar features as they grow at one atmosphere. The data presented in Table 5.1 show
coagulation times. The cluster-cluster aggregation occurs for the
size ranging from 0.08 to 0.3 micrometers, and from 0.5 micrometers and larger reveals particle-cluster aggregation.
Unlike 0.1 and 1 atmosphere, particles grown at 0.01 atmosphere exhibit another character. For the size ranging from 0.07 to 0.5 micrometers the fractal dimension is from 1.43 to 1.70, and is from 1.2 to 1.4 for the size of 0.5 micrometers and larger. This tells us that at the early stages of growth cluster-cluster aggregation is dominated within 30 minutes after wire explosion; and particle-cluster aggregation begins dominating at one hour after explosion and later. At the later stages of growth, the growth will approach to cluster-cluster aggregation with longer coagulation time, say, one hour after explosion.
The reason that growth switches from cluster-cluster aggregation to particle-cluster aggregation can be described as follows. As the size of cluster increases, its Brownian motion will become slow because this cluster is large enough that the bombardments of gas molecules on it could not affect its motion; that is to say, this cluster is "stable". In that case, the motion of this cluster is much
less than the background particles or small clusters of much smaller
size. Therefore those background particles and small clusters are more likely to collide with the relatively large clusters rather than
stick themselves. This is the characteristics of particle-cluster
aggregation.
-fls gas density is low, for example, 0.01 atmosphere, the fractal dimension for early stage of growth is larger than that for later stage of growth for the entire sampling time. The micrographs of the particles grown at 0.01 atmosphere (Fig. 4.10) can demonstrate these measurements. In the figures, the structure of the particles shows
that it becomes more compact and solid as looking from the periphery
inward. From another point of view, particles collide together by cluster-cluster aggregation at the early stage of growth; since the gas density is low these clusters of particles can contact one another tightly, such that a compact structure forms. In the limit of
purely ballistic aggregation, a nearly solid structure will have a fractal dimension of 2.0.
The method used to measure fractal dimension in this study is
dealing with two-dimensional projecting shapes which are electron micrographs of the particles generated. However, the real particles are three-dimensional, which is apparent in low angle micrographs or
stereo-pairs. However, in the literature reported by Weits and Huang,£403 it was demonstrated that as long as the particles are sparse enough, the two dimensional projection of a three-dimensional particle will have the same fractal characteristics as the particle itself. Therefore, it is unnecessary to do a three-dimensional
VI. Summary
In this report, the growth behavior of metallic aerosols under normal and reduced pressure environments was investigated. Particles grown at both environments exhibit very irregular outlines, as shown in the electron microscope pictures from Fig. 4.1 to Fig. 4.10. It vas found that the basic structure of agglomerates in all three pressure conditions performed is a chain with some branches. At normal pressure, the agglomerates look like several branched chains stuck together end to end and, constructing an open-chain agglomerate. As pressure decreases, particles' profile is changing from open-chain to closed-chain and their structure becomes more
compact and solid.
The growth of particles is characterized into three types in this study, they are: cluster-cluster aggregation, particle-cluster aggregation, and ballistic aggregation, according to the measured
fractal dimensions.
According to the observations in this study, the agglomerates
under normal and reduced pressure exhibit fractal characteristics, and can be categorized as natural fractals.
A descriptor, called fractal dimension which is used to describe a fractal object, is applied to quantifying the effect of reducing the pressure on the growth of particles. The measures of fractal
dimensions of experimentally generated and grown particles are
summarized in Table 5.1.
Particles grown at 1.0 atmosphere exhibit cluster-cluster aggre¬
gation in the early stage of growth, and particle-cluster aggregation
for the later stage of growth at short time after wire explosion.
Then the growth tends to be a cluster-cluster aggregation.At 0. 1 atmosphere, like at one atmosphere, the growth is attributed to forming small clusters of particles initially. After that, these small clusters of particles aggregate one another by cluster-cluster aggregation to form a larger cluster with a charac¬ teristic fractal dimension of about 1.4. The later stage of growth is dominated by particle-cluster aggregation and is characterized by a
fractal dimension of about 1.7.
At even lower pressure, 0.01 atmosphere, the initial growth is
changing from cluster-cluster aggregation to particle-cluster aggre¬ gation. While the later stage of growth will approach to a cluster-cluster aggregation, but will presumably change to particle-cluster-cluster aggregation at longer times.
Throughout this report, it is obvious that gas mean free path is an important factor to the growth of particles. Although the pressure
does not decrease to very low value, it seems clear that the aggrega¬
tion of particles will tend toward forming more compact structures
with fractal dimensions approaching to a limit value of 2. The most
fractal dimension. The fractal analysis is able to interpret the
structural informations of agglomerates about their growth history.
-REFERENCES
1. Cheng, M. T. and Shaw, D. T.
"Brownian Coagulation of Chainlike Particles", Aerosols: Science, Technology, and Industrial Applications of Airborne Particles. Ed. by B. Y. H. Liu, D. Y. H. Pui and H. J. Fissan.
Elsevier Science Publishing Co., Inc., 1984.
2. Davies, C. N.
"Coagulation of Aerosols by Brownian Motion", J. of Aerosol Science, Vol. 10, pp 151-161, 1979.
3. Friedlander, S. K. and Wang, C. S.
"The Self-Preserving Particle Size Distribution for Coagulation by Brownian Motion", J. of Colloid and Interface Science, Vol. 22, pp 126-132, 1966.
4. Lai, F. S.; Friedlander, S. K.; Pich, J. and Hidy, G. M.
"The Self-Preserving Particle Size Distribution for Brownian Coagulation in the Free-Molecule Regime", J. of Colloid and Interface Science, Vol. 39, No. 2, pp 395-405, 1972.
5. Lee, K. W.
"Change of Particle Size Distribution during Brownian
Coagulation", J. of Colloid and Interface Science, Vol. 92, No.
2, pp 315-325, 1983.
6. Lee, Paul 5. and Shaw, David T.
7. Lee, K. W.; Chen, H.; and Gieseke, J. A.
ͣ
Log-Nortnally Preserving Size Distribution for Brownian Coagulation in the Free-Molecule Regime", J. of Aerosol Science and Technology, Vol. 3, pp 53-62, 1982.
8. Tolfo, Flavio
"A Simplified Model of Aerosol Coagulation", J. of Aerosol Science, Vol. 8, pp 9-19, 1977.
9. Wang, C. S. and Friedlander, S. K.
"The Self-Preserving Particle Size Distribution for Coagulation by Brownian Motion. II Small Particle Slip Correction and Simultaneous Shear Flow", J. of Colloid and Interface Science,
Vol. 24, pp 170-179, 1967. 10. Mandelbrot, B. B.
Fractals: Form, Chance and Dimension. W. H. Freeman, San Francisco, 1977. '
11. Heakin, Paul
"Diffusion-Controlled Aggregation on Two-Dimensional Square Lattices: Results from a New Cluster-Cluster Aggregation Model", Physical Review B, Vol. 29, pp 2930-2954, 1983.
12. Heakin, Paul
"Diffusion-Controlled Cluster Formation in Two, Three and Four Dimensions", Physical Review A, Vol. 27, pp 604-607, 1983.
13. Meakin, Paul
"Diffusion-Controlled Cluster Formation in 2 - 6 Dimensional
Space", Physical Review A, Vol. 27, pp 1495-1507, 1983.
14. Meakin, Paul
"Formation of Fractal Clusters and Networks by Irreversible
-Diffusion Limited Aggregation", Physical Review Letters, Vol. 51, No. 13, pp 1119-1122, 1983.
15. Heakin, Paul
ͣ
Effects of Cluster Trajectories on Cluster-Cluster Aggregation: A Comparison of Linear and Brownian Trajectories in Two- and Three-Dimensional Simulations", Physical Review A, Vol. 29, No.
2, pp 997-999, 1984.
16. Meakin, Paul
"Diffusion-Limited Aggregation on Two-Dimensional Percolation
Clusters", Physical Review B, Vol. 29, No. 8, pp 4327-4330,
1984.
17. Meakin, Paul and Wasserman, Z. R.
"Some Universality Properties Associated with the Cluster Cluster Aggregation Model", Physics Letters, Vol. 103A, No. 6,7, pp 337 341, 1984.
18. Kolb, M.; Botet, R.; and Jullien, R.
"Scaling of Kinetically Growing Clusters", American Physical Society, Vol. 51, No. 13, pp 1123-1126, Sept. 1983.
19. Witten, T. A. and Meakin, Paul
"Diffusion-Limited Aggregation at Multiple Growth Sites",
Physical Review B, Vol. 28, No. 10, pp 5632-5642, 1983.
20. Witten, T. A. and Sander, L. M.
"Diffusion-Limited Aggregation, A Kinetic Critical Phenomenon", Physical Review Letters, Vol. 47, pp 1400-1403, 1981.
21. Hentschel, H. G. E.
22. Ball, R. C. and Witten, T. A.
•Causality Bound on the Density of Aggregates", Physical Review A, Vol. 29, No. 5, pp 2966-2967, 1984.
23. Void, M. J.
•Computer Simulation of Floe Formation in a Colloidal
Suspension*, J. of Colloid and Interface Science, Vol. 18, pp684-695, 1963. 24. Void, M. J.
"Sediment Volume and Structure in Dispersions of Particles", J.
of Physical Chemistry, Vol. 63, pp 1608-1612, 1959.
25. Sutherland, D. N.
ͣ
Comments on Void's Simulation of Floe Formation", J. of Colloid
and Interface Science, Vol. 22, pp 300-302, 1966.
26. Sutherland, D. N.
"A Theoretical Model of Floe Structure", J. of Colloid and Interface Science, Vol. 25, pp 373-380, 1967.
27. Mandelbrot, B. B.
The Fractal Geometry of Nature. W. H. Freeman, San Francisco, 1982.
26. Kaye, Brian H.
"Multifractal Description of a Rugged Fineparticle Profile", Particle Characterization J., pp 14-21, 1984.
29. Kaye, Brian H.; Leblanc, John E. and Clark, Garry G.
"A Study of the Physical Significance of Three-Dimensional Signature Waveforms", Particle Characterization J., pp 59-65, 1984.
30. Kaye, Brian K.
"Specification of the Ruggedness and/or Texture of a Fine Particle Profile by its Fractal Dimension ", Powder Technology, Vol. 21, pp 1-16, 197B.
31. Kaye, Brian H. ; Leblanc, John E.; and Abbot, Paul
"Fractal Description of the Structure of Fresh and Eroded niuminum Shot Fineparticles", Particle Characterization J., pp 56 61, 1985.
3£. Kaye, Brian H.
Direct Characterization of Fineparticles, John Wiley and Son, New York, N. Y,, 1981.
33. Kaye, Brian H.
Fractal Description of Fineparticle Systems, in J. K. Beddow: Modern Methods in Fineparticle Characterization. C.R.C. Press, Boca Raton, Florida, 1983.
34. Phalen, Robert F.
"Evaluation of fin Exploded-Wire fierosol Generator for Use in Inhalation Studies", J. of Aerosol Science, Vol. 3, pp £95-406,
197£.
35. Chace, W. G. and Moore, H. R., eds.
Exploding Wires, Vols. 1-4. Plenum Press, N. Y., 1958-1968. 35. Karioris, Frank G. and Fish, Birney R.
"fin Exploding Wire Aerosol Generator", J. of Colloid Science, Vol. 17, pp 155-161, 1962.
37. Wegrzyn, James E.
"An Investigation of an Exploding Wire Aerosol", Proceeding:
Symposium on Fine Particles, Minneapolis, Minnesota, pp £53-273,
38. Forrest, S. R. and Witten, T. A.
"Long-Range Correlations in Smoke-Particle Aggregates", J. of Physics A: Math. Gen., Vol. 12, No. 5, pp L109-L117, 1979.
39. Lawless, Philip A.; Reist, Parker C.; and Hsieh, M. T.
ͣ
Study of Mean Free Path Effects on the Growth of Ultrafine
Metallic Aerosols: Statement-of-Progress." (unpublished) 40. Weitz, D. A. and Huang, J. S.
"Self-Similar Structures and the Kinetics of Aggregation of Golds Colloids', Kinetics of Aggregation and Gelation, Ed. by F. Family and D. P. Landau. Preceedings of the International Topical Conference on Kinetics of Aggregation and Gelation,
Athens, GA. 1984.
COMPUTER PROGRAM
SOURCE
PRECISION 6 PR0CS=44
BYTE ARRAY(16384): Ba/X BYTE ARRAY(320,200): A/X
INTEGER ARRAY(100): XI, X2, X3, X4, Yl, Y2, Y3, Y4
COMPUTER PROGRAM
10 CLS
20 SET CURSOR 10,25:INPUT "Picture file name ? ";File$
30 CLS
40 SET CURSOR 2,19:PRINT "For picture to appear it needs 22
seconds. *50 SET CURSOR 5,27:COLOR LTGREEN:PRINT "When picture appears
60 SET CURSOR 6,13:COLOR YELLOW:PRINT "Use arrow keys andhit certain keys to set boundaries"
70 SET CURSOR 9,25:C0L0R LTGREENtPRINT "After setting
boundaries ..."
80 SET CURSOR 10, 17:COLOR YELLOW:PRINT "The picture will
then be stored into an array."
90 SET CURSOR 11,28:COLOR YELLOW:PRINT "(It needs a few
minutes)"
100 SET CURSOR 14,19:C0L0R LTCYAN:PRINT "Hit the following
keys to set boundaries." 110 SET CURSOR 16,13:C0L0R YELLOW
120 PRINT "'L' : Left boundary";SPC(15) "'R' : Right
boundary"
130 SET CURSOR 17,13:COLOR YELLOW
140 PRINT "'U' : Upper boundary";SPC(14) "'D' : Lower
boundary"
142 SET CURSOR 18,29:C0L0R YELLOW 144 PRINT "<ESC> : Finish setting"
150 SET CURSOR 21,2a:C0L0R LTRED:PRINT "Type anykey to
continue.";
150 Anykey
170 SET CURSOR 21,28:C0L0R LTRED:PRINT "Acquiring Picture
END PROCEDURE
10 Hes
30 OPEN Files AS 1 LEN 16384
40 READ RECORD *1,1,Ba 50 CLOSE 1
60 FOR I = 4 TO 16003 : Bad) = Ba(I*252) : NEXT 70 Ba(0)=128:Ba(1)=2:Ba(2)=200:Ba(3)=0 END PROCEDURE PROCEDURE: Shrink EXTERNAL: A,Ul,LI,Rb,Lb,Definewindow,Anykey INTEGER: I,J PROCEDURE: Modify END PROCEDURE PROCEDURE: Mes END PROCEDURE PROCEDURE: Modify
EXTERNAL: Rb, Lb
COMPUTER PROGRAM
PROCEDURE: Mes
EXTERNAL: Definewindov,Anykey
10 Definevindov
20 SET CURSOR 10,14:PRINT "The picture has been stored into
a 320 X 200 array."
30 SET CURSOR 12,12:PRINT "Next step is to set vidth and
number of counting boxes.ͣ
40 SET CURSOR 15,27:C0L0R LTRED:PRINT "Type any key to
continue." 50 Anykey END PROCEDURE
10 Modify 20 CLEAR(A)
30 FOR J = Ul TO LI
40 FOR I = Lb TO Rb
50 A(I/2,J) = POINT(I,J) * P0INT(I*1,J) 50 NEXT
70 NEXT
80 SOUND 1000,2 90 Mes
END PROCEDURE
PROCEDURE: SetWidth
INTEGER: X,Y
BYTE ARRAY(5): Ptr
EXTERNAL: W,XI,X2,X3,X4, Yl, Y2
EXTERNAL: Y3, Y4, Showpic, Inc, Def inewindow, Boxnuiii, Anykey STRING: K$[5] EXTERNAL: Ba PROCEDURE: Init END PROCEDURE PROCEDURE: MovePtr END PROCEDURE PROCEDURE: Boxinit END PROCEDURE PROCEDURE: Box END PROCEDURE PROCEDURE: Mes END PROCEDURE PROCEDURE: Valreset END PROCEDURE PROCEDURE: Hesl END PROCEDURE PROCEDURE: Init EXTERNAL; Ptr
COMPUTER PROGRAM 10 PSET(10,10),1 20 GET(10,10)-(10,10),Ptr 30 PRESET(10,10) END PROCEDURE PROCEDURE: MovePtr STRING: K$[5],R15],LtSl,UL5],DCS] EXTERNAL: X,Y,Ptr,Showpic EXTERNAL: Boxinit,Init 10 Shovpic 20 Init 30 R=CHR$(0)*CHR$(77):L=CHR$(0)*CHR$(75): U=CHR$(0)+CHR$(72):D=CHR$(0)*CHR$(80) 40 X = 300 : Y = 50
50 PUT(X, Y),Ptr,XOR 60 DO
70 K$=INKEy$:IF K$=«" THEN GOTO 70 80 IF K$ = CHR$(27> THEN Boxinit 90 IF K$ = " • THEN EXIT
100 IF K$ = R THEN PUT(X,Y),Ptr,XOR : X = X 5 PUT(X, Y),Ptr,XOR
110 IF K$ = L THEN PUT(X,Y),Ptr,XOR : X = X - 4
PUT(X,Y),Ptr, XOR
120 IF K$ = U THEN PUT(X,Y),Ptr,XOR : Y = Y - 4
PUT(X, y),Ptr, XOR
130 IF KS = D THEN PUT(X,Y),Ptr,XOR : Y = Y + 5
PUT(X, Y),Ptr, XOR 140 REPEAT
END PROCEDURE PROCEDURE: Boxinit
EXTERNAL: X,Y,XI, X2, X3,X4,Y1,Y2 EXTERNAL: Y3,Y4
STRING: K$[5]
10 K$=INKEY$ : IF K$ = •" THEN GOTO 10 20 IF KS = "1* THEN X1(0) = X : Y1(0) = Y
30 IF K$ = '2" THEN X2(0) = X : Y2(0) = Y
40 IF K$ = '3' THEN X3(0) = X : Y3(0) = Y
50 IF K$ = M" THEN X4(0) = X : Y4(0) = Y END PROCEDURE
PROCEDURE: Box
EXTERNAL: W,XI,X2,X3,X4,Yl,Y2, Y3 EXTERNAL: Y4,Inc,Boxnum
INTEGER: I
10 CLS
20 W(0)=Y2(0)-Y1(0)
30 X3(0)=X1(0)+2»W(0) : Y3(0)=Y2(0) 40 X4(0)=X3(0) : Y4(0)=Y1(0)
50 FOR I = 0 TO Boxnum
60 Xl<I*l)=Xl(I)-2»Inc : Y1(I*1)=Y1(I)-Inc 70 X2(I*l)=X2(I)-2»Inc : Y2(I*l)=Y2(I)*Inc
COMPUTER PROGRAM
100 W(I)=Y2(I)-Y1(I)
110 LIKE(X1(I),Y1(I))-(X3(I),Y3(I)),1, B
120 NEXT
END PROCEDURE
PROCEDURE: Mes
EXTERNAL: Inc,Boxnum STRING: K$[5]
10 CLS : COLOR YELLOW
20 SET CURSOR 8,12:PRINT "Hit <CR> to choose number of boxes
and increment value.*
30 SET CURSOR 9,23:PRINT "Other keys will use default
values"
40 SET CURSOR 13, 19:PRINT "Default values are: Number of
boxes = 20"50 SET CURSOR 14,19:PRINT " Box
increment =4"
60 SET CURSOR 18,24:C0L0R LTGREEN:PRINT »<ESC> will use
earlier values.*
70 K$=INKEY$:IF K$ = "" THEN GOTO 70
80 DO IF K$=CHR$(13) 90 CLS : COLOR YELLOW
100 SET CURSOR 9,16:INPUT "Number of boxes wanted ?";Boxnum
110 SET CURSOR 11,16:INPUT "Box increment ? ";Inc
120 END DO
130 DO IF K$<>CHR$(13) AND K$<>CHR$(27)
140 Boxnum = 20 : Inc =4
150 END DO
END PROCEDURE
PROCEDURE: Valreset
EXTERNAL: Inc,Boxnum,Definewindow STRING: K$[5]
10 Definewindow
20 SET CURSOR 10,8
30 PRINT "Want to reset number of boxes and box increment
values ? (Y/N)"
40 K$=INKEY$:IF K$="" THEN GOTO 40
50 DO IF K$="y" OR K$="Y" 60 CLS
70 SET CURSOR 9,29:INPUT "Number of boxes ?";Boxnum
80 SET CURSOR 11,29:INPUT "Box increment ?";Inc90 END DO END PROCEDURE
PROCEDURE: Mesl
EXTERNAL: Anykey
10 CLS : COLOR YELLOW
20 SET CURSOR 3,24:PRINT "Use arrow keys to move pointer."
30 SET CURSOR 5,15:PRINT "The pointer should be moved to the
position where"
40 SET CURSOR 6,15:PRINT "is one of the four corners of the
most inner box."
COMPUTER PROGRAM
the following way"
60 SET CURSOR 9,12:PRINT "Hit <ESC> and 1 to set the upper
left corner of that box."
70 SET CURSOR 10,12:PRINT "Hit <ESC> and 2 to set the lower
left corner of that box."
80 SET CURSOR 12,15:PRINT "The upper and lower left corners
should be set" .
90 SET CURSOR 13,15:PRINT "before viewing the boxes. After setting these"
100 SET CURSOR 14,15:PRINT "corners, hit SPACE bar to view how those boxes"
110 SET CURSOR 15,15:PRINT "look like and how do you like
them. You could"
120 SET CURSOR 16,15:PRINT "either reset box number and box increment values"
130 SET CURSOR 17,15:PRINT "or remain these values but change the positions"
140 SET CURSOR 18,15:PRINT "of those boxes."
150 SET CURSOR 21,27:C0L0R LTRED:PRINT "Type any key to
continue.";
160 Anykey END PROCEDURE
10 Mes
20 CLS:COLOR YELLOW
30 SET CURSOR 10,27:PRINT "Need instructions ? (Y/N)"
40 K$=INKEY$:IF K$="» THEN GOTO 40
50 IF K$="y" OR K$="Y" THEN Mesl 60 MovePtr
70 Box
60 PUT(0, 0),Ba, XOR
90 LOCATE 24, 65:PRINT "OK ? (Y/N) ";
100 K$=INKEY$:IF K$="" THEN GOTO 100
110 IF K$<>"Y" AND K$<>"y" THEN Valreset : GOTO 60 120 LOCATE 24,65:PRINT "Computing___";
END PROCEDURE PROCEDURE: Anykey
STRING: SC5]
10 S = INKEY$ : IF S = "" THEN GOTO 10 END PROCEDURE
PROCEDURE: Showpic EXTERNAL: Ba
10 SCREEN 2
15 'LINE(2,0)-(639,191),1,BF 20 PUT(0,0),Ba,XOR
END PROCEDURE
PROCEDURE: Counting
EXTERNAL: A,XI,X2,X3,X4, Yl, Y2, P EXTERNAL: Boxnum
COMPUTER PROGRAM
END PROCEDURE PROCEDURE: Modify
INTEGER: I
EXTERNAL; XI,X2,X3,X4, Boxnum
10 DO IF X1(0> HOD 2 >« 1 20 FOR I = 0 TO Boxnum-l 30 Xl(I) = XKI) - 1 40 X2(I) = X2(I> - 1 5« X3(I) * X3(I) - 1 60 X4(I) - X4(I) - 1
70 NEXT 80 END DO END PROCEDURE
10 Modify 20 CLEAR(P)
30 FOR J = Y1(0) TO Y2(0)-l
40 FOR I = Xl(0)/2 TO X4(0)/2-l
50 P(0) = P(0) A(I,J) 60 NEXT
70 NEXT
80 SOUND 1000,0.5
90 FOR K = 1 TO Boxnum-l
100 P(K> = 0
110 FOR J = YKK) TO Y1(K-1)-1 120 FOR I = Xl<K)/2 TO X4(K)/2-l
130 P(K) = P(K) + A(I,J)
140 NEXT
150 NEXT
160 FOR J = Y2{K-1) TO Y2(K)-1 170 FOR I = Xl(K)/2 TO X4<K)/2-l
180 P(K) = P(K) Ad,J)
190 NEXT
200 NEXT
210 FOR J = Yl(K-l) TO Y2(K-1)-1 220 FOR I = Xl(K)/2 TO Xl(K-l)/2-l
230 P{K) = P(K) A(I,J) 240 NEXT
250 NEXT
260 FOR J = Yl(K-l) TO Y2<K-1)-1 270 FOR I = X4(K-l>/2 TO X4(K)/2-l
280 P(K) = P(K) A(I,J) 290 NEXT
300 NEXT
310 P(K) = P(K) + P(K-l)
320 SOUND 1000,0.5 330 NEXT
340 SOUND 1000,0.5 END PROCEDURE
PROCEDURE: Definewindow
10 CLS : SCREEN 0 : STATUSLINE OFF
20 DEFINE WINDOW 1,0,0,23,79, YELLOW, ON BLUE
COMPUTER PROGRAM
40 COLOR BORDER RED
END PROCEDURE PROCEDURE: Plot
EXTERNAL: W,P,Anykey,Boxnum, Definevindov INTEGER: L,Vc,He,Pmin PROCEDURE: Coord END PROCEDURE PROCEDURE: Scale END PROCEDURE PROCEDURE: Regression END PROCEDURE PROCEDURE: Plot4x3 END PROCEDURE PROCEDURE: Plot3x3 END PROCEDURE PROCEDURE: Plot3x2 END PROCEDURE PROCEDURE: Plot2x2 END PROCEDURE PROCEDURE: Plot2x3 END PROCEDURE PROCEDURE: Coord EXTERNAL: He,Vc PROCEDURE: FourxThree END PROCEDURE PROCEDURE: ThreexThree END PROCEDURE PROCEDURE: ThreexTvo END PROCEDURE PROCEDURE: TwoxTvo END PROCEDURE PROCEDURE: TwoxThree END PROCEDURE PROCEDURE: FourxThree INTEGER: I,J 10 LINE(170,0)-(470,180),1,B
20 FOR I = 0 TO 1
COnPUTER PROGRAM
40 LINE(270*100»I,176)-(270*100«I,180),1
50 NEXT
60 FOR I = 0 TO 2
70 LINE(170,135-45»I)-(177,135-45«I),1 80 LINE(463,135-45»I)-(470,135-45»I),1
90 NEXT
100 FOR J = 2 TO 5 STEP 3 110 FOR I = 0 TO 2
120 LINE(170*100»(I*LOG(J)/2.3),0)-(170100•(I+LOG(J)/2. 3),4),1
130 LINE(170*100»(I*LOG(J)/2.3), 176)-(170*100*(I*LOG(J >/2.3),180), 1
140 NEXT
150 FOR I = 0 TO 3
160
LINE(170,180-45*(I+LOG(J)/2.3)>-(177,180-45»(I+L0G(J)/2.3)),1
170 LINE(463,45»(I*LOG(J)/2.3))-(470,
180-45«(I*L0G(J)/2.3)),1 180 NEXT
190 NEXT
END PROCEDURE
PROCEDURE: ThreexThree INTEGER: I,J
10 LINE<125,0)-(515,180),1,B
20 FOR I = 0 TO 1
30 LINE(255+130»I,0)-(255*130»I,4),1 40 LINE(255*130»I,176)-<255+130»I,180),l 50 NEXT
60 FOR I = 0 TO 1
70 LINE(125,60*60»I)-(132,60+60«I),1 80 LINE(508,60*60»I)-(515,60*60»I),1 90 NEXT
100 FOR J = 2 TO 5 STEP 3 110 FOR I = 0 TO 2
120
LINE(125+130*(I+LOG(J)/2.3),0)-(125+130•(I*LOG(J)/2. 3),4),1
130 LINE(125+130«(I*LOG(J>/2.3),176)-(125+130«(I*LOG(J)/2.3),180),1
140 NEXT
150 FOR I = 0 TO 2
160 LINE(125,180-60»(I+LOG(J>/2.3))-(132,160-60»(I*LOG(J)/2.3)),1
170
LINE<508,180-60»<I*LOG(J)/2.3)>-(515,180-60»(I*LOG(J)/2.3)),1
180 NEXT
![Table 1.1 Fractal Dimensions Obtained from Two-Dimensional Aggregation Models SBBsrrs8ss==ss=ssrs==rss==ssss==s==r==s=s====ss==sssssss=ss: Model D Linear trajectory, particle-cluster 1.95 ± 0.002 [121 Brovnian trajectory, particle-cluster 5/3 [20] Brownian](https://thumb-us.123doks.com/thumbv2/123dok_us/8337328.2213452/14.926.17.893.30.1135/dimensions-obtained-dimensional-aggregation-trajectory-brovnian-trajectory-brownian.webp)