Impact of Positive Diet and Physical Activity Behaviors on the Effectiveness of the Influenza Vaccine in Obese Adults
By
Paula Marie Muñoz
Honors Thesis Department of Nutrition
University of North Carolina – Chapel Hill 2014
Approved:
______________________________ Advisor
ABSTRACT
Paula Muñoz
Impact of Positive Diet and Physical Activity Behaviors on the Effectiveness of the Influenza Vaccine in Obese Adults
(Under the direction of Dianne Ward, Ed.D and Melinda Beck, Ph.D)
Obesity is a public health epidemic that is associated with increased risk of developing a large number of negative health implications, including being linked with increased susceptibility to viral infections. Influenza is an acute viral infection that affects the respiratory systems and is caused by the influenza virus. Every year, influenza infects a large portion of the population and can even result in death. During the H1N1 2009 pandemic, obesity was identified as an independent risk factor for the influenza virus. Vaccination has been identified as the most effective method for prevention of the virus, however obese adults have shown impaired immunological response to influenza vaccination. Increased physical activity and consumption of high quality diets have been shown to produce increased immune response, however the impact that these lifestyle factors have on obese adults receiving the influenza vaccine is unknown.
The purpose of this study was to determine the effects that positive diet and physical activity behaviors had on the effectiveness of the influenza vaccine in obese adults. A sample of 40 subjects were selected and classified into two groups by lifestyle category, healthy and unhealthy, through the use of a diet and physical activity survey screener. Blood serum was collected pre- and 30 days post-vaccination, and IgG antibody levels were measured through absorbance readings.
levels between the unhealthy and healthy groups, the larger percent change exhibited by obese adults classified as healthy, and among those with higher physical activity levels and better diet quality scores, suggests a better response to the influenza virus compared to the obese participants who were unhealthy, with lower physical activity levels and low quality diets. Therefore, obese adults who follow healthy lifestyles may be better protected from the influenza virus than obese adults who do not. As the prevalence of obesity among the population continues to increase, it will be important to find ways to increase the effectiveness of the flu vaccine among this vulnerable population in order to reduce the morbidity and mortality which accompanies the influenza virus.
ACKNOWLEDGEMENTS
I would like to thank my advisors Dr. Dianne Ward and Dr. Melinda Beck for all their advice and for sharing their extensive knowledge and expertise. I would also like to extend thanks to Stephanie Mazzucca for assisting me with the results and analysis portion of my study and for her extensive support with SAS. Additionally, I would like to greatly thank Qing Shi, for guiding me throughout the whole process and for answering all of my questions. I also would like to thank Kim Bartholomew for her assistance working in the clinic, recruiting subjects, and collecting all the data for my project. Lastly, I want to thank all of the members of the Beck lab for their support with this project.
TABLE OF CONTENTS
LIST OF TABLES………..vi
LIST OF FIGURES………...vii
Chapter 1. INTRODUCTION, AIMS, AND HYPOTHESIS…………....………..……...8
2. METHODS………..16
3. RESULTS………20
4. DISCUSSION………..40
REFERENCES………..45
LIST OF TABLES
Table
1. Characteristics of Subjects in Nutrition Screener Validity Study, United States,
2014………..20 2. Characteristics of Subjects in Flu Vaccine Effectiveness Study, United States,
2014………..26
LIST OF FIGURES
Figure
1. Mean diet score based on perceived health status………...23
2. Mean diet score based on diet perception………23
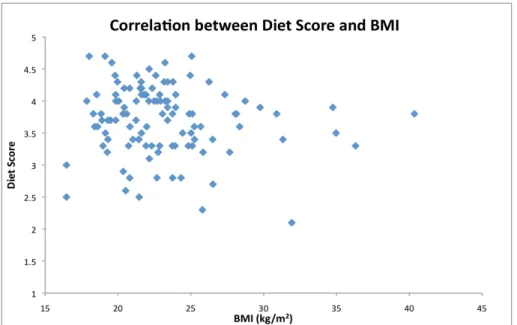
3. Correlation between diet score and BMI……….24
4. Pre and post vaccination IgG total absorbance levels in obese adults……….27
5. Pre and post vaccination IgG1 absorbance levels in obese adults………...28
6. Pre and post vaccination IgG3 absorbance levels in obese adults………...28
7. Pre and post vaccination IgG4 absorbance levels in obese adults………...29
8. Percent change in IgG absorbance levels pre and post vaccination in obese adults…30 9. IgG total absorbance level vs physical activity in obese adults………...32
10. IgG1 absorbance level vs physical activity in obese adults……….32
11. IgG3 absorbance level vs physical activity in obese adults……….33
12. IgG4 absornace level vs physical activity in obese adults………...34
13. Percent change in IgG absorbance in obese adults based on PA level………35
14. IgG total absorbance level vs diet quality in obese adults………...36
15. IgG1 absorbance level vs diet quality in obese adults……….36
16. IgG3 absorbance level vs diet quality in obese adults……….37
17. IgG4 absorbance level vs diet quality in obese adults……….38
18. Percent change in IgG absorbance in obese adults based on diet quality………39
CHAPTER 1
INTRODUCTION, AIMS, AND HYPOTHESIS
The World Health Organization (WHO) concluded in a recent report that being overweight or obese was the fifth primary risk factor for death around the world (WHO 2013). For adults, overweight and obese status is defined through the calculation of a body mass index (BMI), which takes into account the weight and height of the individual (CDC 2012). An adult who is considered overweight has a BMI that falls between 25 and 29.9 kg/m2. An adult who is categorized as obese has a BMI that is 30 kg/m2 or higher (CDC 2012). Obesity has been further categorized into more specific stages including stage I (mild) with a BMI between 30 to 34.9, stage II (moderate) with a BMI between 35 to 39.9, and stage III (severe) with a BMI greater than or equal to 40 kg/m2 (Cornier et al. 2011). It is estimated that 2.8 million people die each year from obesity and overweight-related illnesses (WHO 2013). Individuals who are overweight and obese have been found to have increased associations with all-cause mortality when compared to those who are normal weight (Berrington de Gonzales et al. 2010). Having a higher BMI has been linked with higher instances of developing negative health conditions such as coronary heart disease, heart attacks, and strokes (Owen et al. 2009, Song et al. 2009). Since 1980, the worldwide population of obese individuals has almost doubled leading to an estimate of 500 million adults worldwide being classified as obese (WHO 2013). It is projected that by 2030 there will be 1 billion obese adults in the world if no drastic measure are taken to slow this epidemic (Yang et al. 2008).
Not only does obese status have significant negative health outcomes, but it also carries a hefty economical burden. It is estimated that $185.7 billion are spent annually in the US for medical costs related to obesity (Cawley and Meyerhoefer 2012). Also, medical costs for obese individuals are $3,115 higher than those for normal weight individuals (Cawley and Meyerhoefer 2012). It has been estimated that if obesity trends follow its current track, obesity-related medical costs in the US could increase by $48-$66 billion per year (Wang et al. 2011).
Influenza is a serious public health concern as it causes severe illness around the world. It is an acute viral infection and it can spread easily from person to person. Every year, influenza results in 3 to 5 million cases and leads to 250,000 to 500,000 deaths worldwide (WHO 2014). During the A/H1N1/2009 pandemic, obesity was identified as an independent risk factor for influenza virus (Louie et al. 2011). In fact, obese individuals are at a greater risk for respiratory hospitalizations during seasonal flu periods (Kwong et al. 2011). A review of the literature has also shown that obese patients, hospitalized because of influenza, were at a higher risk of being admitted to the intensive care unit (ICU) and tended to remain in hospitals for longer periods of time (Rodriguez et al. 2011). Another published study found that in an animal model, obese mice who were infected with influenza virus had a 6.6 fold higher mortality rate post-infection and had delayed pro-inflammatory cytokine expression leading to a diminished immune response (Smith et al. 2007).
T-cell response in cells (Sheridan et al 2012). CD8+ T-cells have the capacity to destroy infected cells and defend the body against infection (Harty et al. 2000). However, there is evidence to believe that obesity impairs immunological response to influenza vaccination in humans. The CD8+ T-cell response is impaired in obese populations (Sheridan et al. 2012). Studies indicate that although the influenza vaccine generates the CD8+ T-cell response, there is a vast reduction of the percentage of these cells among obese individuals (Karlsson et al. 2010). IFNy and granzyme B, two proteins and markers of the activity of CD8+, were also significantly reduced among obese who were vaccinated with trivalent influenza vaccine (Sheridan et al. 2012). Granzyme B assists in the destruction of infected cells, while IFNy inhibits viral replication. Additionally, antibody titers are also impaired when obese individuals are vaccinated. Although there is an initial elevated antibody response to influenza vaccination, this trend is not upheld throughout the entire period that influenza is infecting the population (Sheridan et al. 2012). A study indicated an initial heightened antibody response to trivalent influenza vaccine, but after 12 months, the antibody levels for obese decreased by more than 4-fold in over 50% of the obese patients. Contrastingly, among normal weight individuals, the decrease of 4-fold only occurred in less that 25% of the patients (Sheridan et al. 2012). As can be seen, the vaccine is not as protective and thus leaves a growing obese population with suboptimal protection from the influenza virus.
muscle strength training on 2 or more days (CDC 2008). The positive impact of physical activity is instrumental to the body; it reduces risk of developing CVD, type II diabetes, hypertension, obesity, and some cancers (Melzer et al. 2004). Additionally, participation in constant physical activity has been linked with enhancing immune response. Partaking in physical activity has been found to be predictive of greater beta andrenergic receptor responsivity (Hong et al. 2013). With greater responses come lowered pro-inflammatory cytokine levels, which are instrumental in activated immune systems (Hong et al. 2013). Additionally, bouts of moderate aerobic exercise (30min/day for 5days/week for 3 weeks) have been studied and show improved macrophage innate immune function (Kizaki et al. 2008). A review of the literature also indicates that even in obese and overweight individuals, having higher levels of cardio-based fitness reduced chronic immune activation and inflammation (Hong et al. 2013). Regular physical activity has also been linked with enhanced influenza vaccine response. It has been found that influenza-vaccinated older adults who participated in a 10-month exercise regimen had enhanced antibody titers and IFNy production when compared to sedentary patients (Kohut et al. 2004). In another study, an association was found between physical activity and immune response to influenza immunization. Among older adults who were classified as physically active, moderately active, or sedentary, the active seniors had higher anti-influenza IgG and IgM and greater influenza specific lymphocyte proliferation than sedentary individuals (Kohut et al 2002).
to better health outcomes (Rawat et al. 2013). In another study with overweight and obese postmenopausal women, results indicated some evidence that healthy eating patterns contributed to improved immune function and reduced inflammation (Boynton et al. 2007). Diets that are calorie dense and high with fat are associated with increased thymic involution, which results in decreased T-cell levels and diversity and thus leads to decreased immune response (Yang et al. 2009). Fruits and vegetables contain fiber, antioxidants, flavonoids, vitamin A, vitamin E, and many additional essential vitamins and nutrients (Deivert and Fleetwood 2013). When the immune system is activated, pro-inflammatory cytokines and reactive oxygen species are activated to create a primary defense against pathogens; however over-inflammation causes the immune response to be impaired. Through the consumption of nutrient rich foods, many of the nutrients and vitamins are able to act to reduce oxidative stress and inflammation, and are also able to increase activation of T-cells and antibodies (Mahima et al. 2013, Pae et al. 2011).
describing the impact of healthy behaviors among obese individuals on flu vaccine integrity, this project will compare obese individuals who are either following healthy diet and physical activity practices or unhealthy ones and additionally compare how their health practices status affects flu vaccine responses. All in all, the purpose of this study will be to identify the impact of positive diet and physical activity behaviors on the effectiveness of the influenza vaccine in obese adults. I hypothesize that obese individuals who report an exercise regime and healthy diet quality will have improved vaccine responsiveness compared with the obese subjects who are not currently exercising or eating a good quality diet. In order to address the purpose of this study, three specific aims were created.
Aim 1: Compare the IgG antibody titer response to the flu vaccine in a group of obese individuals who are classified as ‘healthy’ (4th quartile of a diet and physical activity health behavior screener) to those classified as ‘unhealthy’ (1st quartile). It is hypothesized that individuals in quartile 4, obese with healthy lifestyles, will have a larger percent increase in IgG antibodies from pre to post vaccination when compared to obese with unhealthy lifestyles in quartile 1.
CHAPTER 2
METHODS
Subjects:
Eligible patients at least 18 years of age were recruited from the University of North Carolina at Chapel Hill Family Medicine Center (FMC) during their flu vaccine appointment. Since all participants were drawn from their primary medical care facility, detailed medical records were available for all subjects. For this study, exclusion criteria included immunosupression, self-reported history of prior influenza vaccination for current season, acute febrile illness, treatment with immunomodulator or immunosuppressive drugs, being pregnant, being non-obese (BMI less than 30 kg/m2), being diagnosed with type I or type II diabetes, not identifying as African-American, African, or Caucasian, and being a non-English speaker. A final analytical sample of 132 subjects (N=132) was obtained. These individuals were then categorized based on combined diet and PA scores into 2 quartiles for health (obese healthy and obese unhealthy). The individual scores were first standardized using z-scores. The diet z-score and the physical activity z-score were added to create a “combined diet and PA z-score.” These scores were then sorted into 4 groups based on quartiles. The highest and lowest quartiles were identified to create the obese healthy and unhealthy groups. Stratified random sampling was used to obtain a random sample of 40 patients, 20 in the healthy obese quartile and 20 in the unhealthy obese quartile. During ELISA assays, 1 subject from the unhealthy quartile was thrown out given failed ELISA assay. This left a final sample size of 39 subjects (n=39).
This single site, prospective study was carried at UNC FMC as part of an ongoing NIH funded clinical trial (IRB# 08-1606, M. Beck, PI). Subjects were recruited through a flier included in mailed appointment reminders for flu shot clinic visits, by posted flyers at the FMC, and use of a Research Coordinator (RC) at the FMC during flu vaccine season (October through March). Upon consenting to be a part of the study, RC obtained a pre-vaccination serum sample and administered the CDC inactivated trivalent influenza virus vaccine to the deltoid muscle. Approximately 30-days post vaccination, another blood draw was obtained from study participants. In order to collect information about diet, a brief 10-question diet screener was developed for this study and validated in a sub-study. The developed diet screener and a physical activity screener were administered during initial clinic visit and results were filed. The serum that was collected was stored at -80˚C until analyzed. Information about the diet survey and physical activity screener are described in the sections below.
Measurement of serum IgG antibody titers:
The plate was washed 3x2 with PBSt and dried. 100µL of TMB Substrate Solution Mix was added to each well and was incubated for 30 minutes at room temperature. The reaction was stopped with 100µL of 2M Sulfuric Acid. The absorbance was read at 450 nm.
Measurement of Health Habits:
Sub-study: Dietary Screener Development and Validity Test
Lack of a suitable diet quality screener required that a new measure be developed and evaluated for use in this research study. The purpose of the diet screener was to assign ‘diet scores’ for subjects in the Influenza vaccine responsiveness study described above.
A diet score was created from the brief 10-question screener with 5 questions addressing positive diet habits and 5 questions addressing negative diet habits. The screener was created based on questions from already established diet-screeners and included information about consumption of sugar-sweetened beverages, excess alcohol, high-fat snacks, fast food consumption, as well as consumption of fruits, vegetables, dairy products, and whole grains. The negative diet habit questions were scored in reverse. In order for a score to be minimally acceptable, participant must have answered at least 4 of the 5 positive diet questions and at least 4 of the 5 negative diet questions had to be answered as well. Each questions was scored on a 1 to 5 range and the point value for each question was added and divided by the number of questions answered to provide a ‘diet score.’
health. This survey was created and administered through Qualtrics, and online survey software. Eligible subjects were between 18 to 65 years of age and were recruited through electronic announcements through listservs and email. Subjects also had to be fluent in English. No restriction on race or ethnicity were determined. For this sub-study a final analytical sample of 111 subjects (N=111) was obtained.
Physical Activity Level Measurement:
Physical activity scores for obese individuals (BMI greater than or equal to 30 kg/m2) were calculated. For this study, the Rapid Assessment of Physical Activity (RAPA) screener was used to attain a ‘physical activity score.’ RAPA was developed to categorize subjects into either high and low activity levels (Topolski et al 2006). A score of 3 indicated that participants were active/meeting guidelines, a score of 2 designated them as irregular active, and a score of 1 designated inactivity.
Statistics/Analysis:
CHAPTER 3
RESULTS
Development of Diet Screener:
A sub-study was conducted to assess the validity of the 10-question nutrition screener that was developed to obtain a measure of diet quality that was needed as part of the health status score. The sample included 111 participants with an average age of 29.8 y, who were 74% female and 85% Caucasian. The ages ranged from 18 to 61 years of age. The racial breakdown was 0.9% American Indian (1 Subject), 3.6% Asian (4 subjects), 2.7% African American (3 Subjects), 0.9% Native Hawaiian or Pacific Islander (1 subject), 84.7% Caucasian (94 subjects), and 6% other (8 Subjects). 19.8% of participants identified as Hispanic (22 subjects). The Body Mass Index (BMI) ranged from 16.5 to 40.4. The mean BMI was 23.1 (4.1).
Participants were asked to rate their overall health status by this question: “How would you rate your health?” with response choices including ‘Bad’, ‘Normal’, and ‘Good.’ A score of 1 indicated a bad health status, a score of 2 indicated a normal health status, and a score of 3 indicated a good health status. The mean rating was of 2.68 (0.51). Participants were also asked to rate their diet compared to that of the average American (In general my diet is _______ than the average American). A score of 1 indicated a diet that was worse, a score of 2 indicated a diet that was the same, and a score of 3 indicated a diet that was better. The mean score was found to be 2.77 (0.49). Table 1 provides a breakdown of the summary characteristics of the population sample.
Table 1: Characteristics of Subjects in Nutrition Screener Validity Study, United States, 2014
Characteristics Patients, No. (%)
Male 29 (26.1)
Female 82 (73.9)
Race:
American Indian 1 (0.9)
Asian 4 (3.6)
African American 3 (2.7)
Native Hawaiian/Pacific Islander 1 (0.9) Caucasian
Other
94 (84.7) 8 (7.2) Ethnicity:
Hispanic 22 (19.8)
Non – Hispanic 89 (80.2)
Age:
18 – 28 72 (64.9)
29 – 39 12 (10.8)
40 – 50 14 (12.6)
51 – 61 13 (11.7)
Diet Perception Rating:
Worse than the average American 3 (2.7) Same as the average American 20 (18.0) Better than the average American 88 (79.3) Health Perception Rating:
Bad Normal Good
2 (1.8) 32 (28.8) 77 (69.4) BMI: 15-20 21-25 26-30 31-35 36-40 36 (32.4) 58 (52.3) 11 (9.9) 4 (3.6) 2 (1.8)
A second analysis was performed on the data in order to determine the association between the calculated average diet score with the perceived health rating and the calculated average diet score with the self-perceived diet status when compared to the average American. A one-way analysis of variance (ANOVA) was calculated for the health rate. The results were F(2,108) = 2.73, p = 0.07 and are showing a trend towards significance. Although the results indicate that there is no statistical difference between the means of the three categories, the calculation of the means for each health category indicate diet scores increase as perceived health becomes more positive. Subjects who rated their health status as low (score of 1) had a mean diet score of 3.35 (1.06). Subjects who identified with a normal health status (score of 2) had a mean diet score of 3.55 (0.66). Subjects who identified with a good health (score of 3) status had a mean diet score of 3.79 (0.45). Figure 1 displays this relationship.
An ANOVA was also calculated comparing participants’ diet score compared to the average American. The results were significant, F(2,108) = 6.94, p = 0.002 and as a result identify that there is a statistically significant difference between the means of each of the perceived diet categories. Subjects who felt that their diet was worse than that of the average American (score of 1) had a mean diet score of 3.10 (0.53), while subjects who identified their diet as the same (score of 2) had a mean diet score of 3.41 (0.62). Subjects who identified with a diet that was better than that of the average American (score of 3) had a mean diet score of 3.80 (0.48). Figure 2 displays this relationship.
the results are representative of the inverse relationship between the two. As the diet score increased the BMI decreased and vice versa. Figure 3 displays this relationship.
Figure 1. This figure represents the mean diet score based on the perceived health status indicated by the
the individuals. A perceived health status score of 1 indicates a bad health status, a score of 2 indicates a
normal health status, and a score of 3 indicates a good health status. Diet scores range from 1 to 5, with 1
Figure 2. This figure represents the mean diet score based on the perceived diet indicated by the the
individuals. A perceived diet score of 1 indicates a diet that was worse than that of the average American,
a score of 2 indicates a diet that is the same as that of the average American, and a score of 3 indicates a
diet that is better than that of the average American. Diet scores range from 1 to 5, with 1 indicating a low
quality diet and a score of 5 indicating a high quality diet.
Figure 3. This figure represents the inverse trend between diet scores and BMI. A higher diet score
correlates with a lower BMI. As the diet score decreases, the BMI becomes higher. A figure represents
data from 111 subjects (N=111).
Effectiveness of Flu Vaccine
The second part of the results will focus on presenting data and trends found when assessing the impact of health status and positive diet and physical activity behaviors on the effectiveness of the influenza vaccine in obese adults.
these, 30.8% (12 subjects) were male. The racial breakdown was 66.7% Caucasian (26 subjects) and 33.3% African American/African (13 subjects). The Body Mass Index (BMI) ranged from 30.2 to 56.7, with a mean of 37.6 (7.7).
The 10-question nutrition screener from the sub-study was used to calculate a diet score. The scoring ranged from 1-5 with a score of 5 signaling the high quality diet and a score of 1 indicating a low quality diet. The mean score for these participants was 3.3 (0.8). To assess physical activity levels RAPA was used (Topolski et al. 2006). The scoring ranged from 1-3 with a score of 3 designating active/meeting guidelines, a score of 2 designating irregular active, and a score of 1 designating inactivity physical activity status. The mean PA score for these participants was 2.1 (0.9). Based on the data from the combined diet and PA scores, a ‘healthy’ (obese with healthy lifestyle, n=20) and an ‘unhealthy’ groups (obese with an unhealthy lifestyle, n=19) were formed.
Table 2: Characteristics of Subjects in Flu Vaccine Effectiveness Study, United States, 2014 Characteristics Overall, No. (%) Healthy, No. (%) Unhealthy, No. (%) Sex:
Male 12 (30.8) 6 (30.0) 6 (31.6)
Female 27 (69.2) 14 (70.0) 13 (68.4)
Race:
Caucasian 26 (66.7) 13 (65.0) 13 (68.4)
African American 13 (33.3) 7 (35.0) 6 (31.6)
Age:
20 – 30 2 (5.1) 2 (10.0) 0 (0.0)
31 – 41 6 (15.4) 4 (20.0) 2 (10.5)
42 – 52 11 (28.2) 5 (25.0) 6 (31.6)
53 – 63 15 (38.5) 8 (40.0) 7 (36.8)
64 – 74 5 (12.8) 1 (10.0) 4 (21.1)
BMI:
30-35 20 (50.0) 10 (50.0) 10 (52.6)
36-40 8 (20.0) 3 (15.0) 5 (26.3)
41-45 6 (15.0) 4 (20.0) 2 (10.5)
46-50 1 (2.5) 0 (0.0) 1 (5.3)
51-55 3 (7.5) 2 (10.0) 1 (5.3)
56-60 1 (2.5) 1 (5.0) 0 (0.0)
Diet Score Average 3.30 3.82 2.74
Physical Activity Score Average
2.08 2.85 1.26
The IgG titer levels were examined for each of the two groups. All data for IgG2 were not included in this analysis because the changes in titer levels were so small and the ELISA test was not sensitive enough to produce useful results.
Figure 4. Mean IgG total absorbance levels for obese with healthy and unhealthy lifestyles. A higher
absorbance indicates a higher presence of IgG total antibodies.
pre-vaccination IgG4 absorbance was 0.325 (0.376). The mean post-vaccination IgG4 absorbance was 0.553 (0.658). Results for IgG1 are represented in Figure 7.
Figure 5. Mean IgG1 absorbance levels for obese with healthy and unhealthy lifestyles. A higher
absorbance indicates a higher presence of IgG1 antibodies.
Figure 7. Mean IgG4 absorbance levels for obese with healthy and unhealthy lifestyles. A higher
absorbance indicates a higher presence of IgG4 antibodies.
category and the other from the healthy one. The recorded percent change for these values were 53,900% and 379,900%, which were largely due to calculation that included a baseline titer too low to be read by the ELISA assay. This left a total analytical sample of 18 (n=18) for the unhealthy group and 19 (n=19) for the healthy group. The mean percent change in IgG1 levels pre- and post-vaccination in the unhealthy group was 130.80% (49.30) and in the healthy group it was 120.60% (47.16). There was a slightly greater percent change in the unhealthy group. For IgG4, three subjects were eliminated from analysis from the unhealthy category since they were outliers. The recorded percent change for these values were 2,200%, 3,126%, and 4,900% and were largely due to calculations that included baseline titers too low to be read by the ELISA assay. This left a total analytical sample of 16 (n=16) for the unhealthy group. The mean percent change in IgG4 level pre- and post-vaccination in the unhealthy group was 2.54% (24.57) and in the healthy group it was 167.20% (37.39). There was once again a greater percent change in the healthy group. The results are displayed in figure 8.
An independent t-test was conducted to compare the differences in percent change of IgG subclass by group. Results for IgG total indicated a non-significant trend in the predicted direction indicating that there was a difference in the percent change of IgG levels pre and post vaccination, t(37) = 0.91, p = 0.37. These results suggest that obese individuals who have healthy lifestyles are trending towards having a greater response to the influenza vaccine. Results for IgG1 indicated a non-significant trend in the predicted direction indicating that there was a difference in the percent change of IgG levels pre- and post-vaccination, however these differences were not statistically different, t(36) = 0.31, p = 0.76. Results suggest that obese individuals who have healthy lifestyles have a greater response to the influenza vaccine. Results for IgG3 indicated a non-significant trend in the opposite direction indicating that there was a difference in the percent change of IgG levels pre and post vaccination, t(35) = 0.15, p = 0.88. Results for IgG4 indicated a non-significant trend in the predicted direction indicating that there was a difference in the percent change of IgG levels pre and post vaccination, t (34) = 1.33, p = 0.193. Results suggest that obese individuals who have healthy lifestyles have a greater response to the influenza vaccine.
were compared: from the unhealthy category those who were ‘low active’ (n=14) were compared to the ‘high active’ individuals (n=16) from the healthy category. Results are displayed in figure 9, 10, 11, and 12.
Figure 9. Mean IgG total absorbance levels for obese with low and high physical activity levels. A higher
absorbance indicates a higher presence of IgG total antibodies. The mean pre-vaccination IgG absorbance
level for low active group was 1.911 (0.428). The mean post-vaccination IgG absorbance level for this
group was 2.344 (0.233). The mean pre-vaccination IgG absorbance for the high active group was 1.552
Figure 10. Mean IgG1 absorbance levels for obese with low and high physical activity levels. A higher
absorbance indicates a higher presence of IgG1 antibodies. The mean pre-vaccination IgG absorbance
level for low active group was 1.588 (1.027). The mean post-vaccination IgG absorbance level for this
group was 1.993 (1.157). The mean pre-vaccination IgG absorbance for the high active group was 1.64
(0.801) and the mean IgG absorbance for the post-vaccination group was 2.424 (0.641).
Figure 11. Mean IgG3 absorbance levels for obese with low and high physical activity levels. A higher
absorbance indicates a higher presence of IgG3 antibodies. The mean pre-vaccination IgG absorbance
level for low active group was 1.017 (0.657). The mean post-vaccination IgG absorbance level for this
group was 1.683 (0.937). The mean pre-vaccination IgG absorbance for the high active group was 1.096
Figure 12. Mean IgG4 absorbance levels for obese with low and high physical activity levels. A higher
absorbance indicates a higher presence of IgG4 antibodies. The mean pre-vaccination IgG absorbance
level for low active group was 0.485 (0.557). The mean post-vaccination IgG absorbance level for this
group was 0.67 (0.774). The mean pre-vaccination IgG absorbance for the high active group was 0.378
(0.403) and the mean IgG absorbance for the post-vaccination group was 0.665 (0.693).
Figure 13. Percent change of IgG absorbance level in obese adults stratified by physical activity level. A
larger percent change indicates a better response to vaccine.
Figure 13. Mean IgG total absorbance levels for obese with low and high quality diets. A higher
absorbance indicates a higher presence of IgG total antibodies. The mean pre-vaccination IgG absorbance
level for low quality diet group was 1.544 (0.297). The mean post-vaccination IgG absorbance level for
this group was 2.469 (0.579). The mean pre-vaccination IgG absorbance for the high quality diet group
Figure 14. Mean IgG1 absorbance levels for obese with low and high quality diets. A higher absorbance
indicates a higher presence of IgG1 antibodies. The mean pre-vaccination IgG absorbance level for low
quality diet group was 1.550 (1.259). The mean post-vaccination IgG absorbance level for this group was
1.975 (0.578). The mean pre-vaccination IgG absorbance for the high quality diet group was 1.691
(0.829) and the mean IgG absorbance for the post-vaccination group was 2.428 (0.958).
Figure 15. Mean IgG3 absorbance levels for obese with low and high quality diets. A higher absorbance
indicates a higher presence of IgG3 antibodies. The mean pre-vaccination IgG absorbance level for low
quality diet group was 0.774 (0.717). The mean post-vaccination IgG absorbance level for this group was
1.373 (1.008). The mean pre-vaccination IgG absorbance for the high quality diet group was 0.901
Figure 16. Mean IgG4 absorbance levels for obese with low and high quality diets. A higher absorbance
indicates a higher presence of IgG4 antibodies. The mean pre-vaccination IgG absorbance level for low
quality diet group was 0.332 (0.664). The mean post-vaccination IgG absorbance level for this group was
0.476 (0.707). The mean pre-vaccination IgG absorbance for the high quality diet group was 0.354
(0.429) and the mean IgG absorbance for the post-vaccination group was 0.631 (0.748).
Figure 17. Percent change of IgG absorbance level in obese adults stratified by diet quality. A larger
CHAPTER 4
DISCUSSION
With 5% to 20% of the population in the US infected with influenza every year, and with an increasing prevalence of obesity in this country, it is important to determine the relationship between obesity and immune response as it relates to influenza vaccination (WHO 2013, NIAID 2012). The literature has provided many studies that have indicated that the obese individual is at greater risk for a more serious development of the influenza virus as obesity impairs the ability for the immune system to respond to the influenza virus effectively (Louie et al. 2009, Smith et al. 2007). Studies have examined the effects of the altered immune systems of obese populations and have identified several different hypotheses for the impaired ability to mount a protective immune response to the virus in this population, including reduced t-cell proliferation and diversity, reduced lymphocyte, monocyte, and leucocyte levels, increased macrophage infiltration in adipose tissue, and release of higher levels of pro-inflammatory adipokines (Sheridan et al. 2012, Marti et al. 2001, Weisberg et al. 2003, Paich et al. 2013, Yang et al. 2009, Perez de Heredia et al. 2012). Additionally, the literature has shown that obese individuals are also not as responsive to the influenza vaccine as elevated post-vaccination antibody levels are not upheld during the entire period that influenza is infecting the population (Sheridan et al. 2012). Finding ways to create an enhanced response to the influenza vaccine in order to create heightened protection from influenza in this vulnerable population is critical.
change between obese individuals participating in high physical activity and consuming high quality diets, and obese individuals participating in low physical activity and consuming low quality diets. Although there were no significant findings between the differences between the percent change of IgG levels pre- and post-vaccination in the healthy and unhealthy lifestyle groups, the results indicate that there is a trend that enhanced physical activity and consumption of a high quality diet can minimize the decreased effectiveness of the influenza vaccine in obese adult populations. Although no other studies of this kind have been conducted, it can be speculated that this enhanced immune response results from the effects exercise and diet have on reducing low-grade inflammation and macrophage infiltration in adipose tissue. Several studies have explored this relationship and have found positive correlations between the two, which help to support our findings (Bruun et al. 2006, Vieira et al. 2009).
We hypothesized those obese individuals with healthy lifestyle practices would exhibit higher percent changes in antibodies pre- and post-vaccination compared to obese adults with unhealthy lifestyle practices. As expected, the percent change in IgG total, IgG1, and IgG4 exhibited a higher percent change in antibody levels in the healthy lifestyle group when compared to the unhealthy lifestyles group. However, there was a slightly higher percent increase in IgG3 levels for the unhealthy lifestyle group when compared to the healthy lifestyle one. An explanatory mechanism for this finding is not understood.
category of obese individuals. The positive correlation between increased exercise levels in populations and enhanced antibody response to the influenza vaccine has been noted in other studies (Kohut et al. 2002, Kohut et al. 2004) and thus supports the idea that exercise has the ability to reverse the immunosuppressant effects of obesity. Kohut et al. 2004 provided evidence to show that in general, subjects who participated in aerobic exercise three times a week for a 10-‐month period tended to show a larger increase in 4-‐week post-‐immunization titer
than subjects who did no exercise (Kohut et al 2004). In fact, they found similar results to
the ones found in this study, in that exercising individuals had an increased change in the
antibody levels pre-‐ to post-‐vaccination when compared to non-‐exercising ones. (Kohut et
al. 2004).
Finally, diet quality alone was analyzed to see the effects that diet had on antibody levels pre- and post-vaccination. We hypothesized that obese individuals with high quality diets would have a greater response to the influenza vaccine marked by a larger percent increase in IgG antibody levels pre- and post-vaccination. As expected, the obese adults with higher quality diets exhibited an elevated antibody percent change than the obese adults with low quality diets. Although diet quality is hard to measure and a review of the literature resulted in no studies comparing the relationship of high quality diet with enhanced immune response specific to the influenza vaccine, other studies have identified that healthful diets have an association with overall enhanced immune response (Rawat et al. 2013, Boynton et al. 2007, Mahima et al, 2013, Pae et al. 2011) which support our findings.
Limitations:
This study had several limitations. First, the interpretation and the analysis of the results are hampered by the small sample size for each of the lifestyle categories (n = 20 healthy lifestyles, n = 19 unhealthy lifestyles). Although the results were able to indicate data that were trending towards significance, the difference in percent change of IgG levels pre and post vaccination could have been found to be statistically significant had their been more samples in each of the lifestyle categories. Secondly, the classification of individuals into the lifestyle quartiles was administered using a self-designed diet screener and a short physical activity screener. The screeners used were not necessarily the best method for identifying lifestyle patterns based on the short number of questions that were asked. Additionally, the scoring used for the PA screener was self-designed and minimally tested, thus provided for more limitations. Longer and more highly validated screeners could have been used to provide more accurate assessments of diet quality and physical activity, but more lengthy measure could have impacted patient willingness to participate. Additionally, the study did not take into account the impact that race can have on immune response. Measures were taken to isolate only individuals who identified as Caucasian or African American/African for the study population, however between these two races immune response to vaccination could vary. Studies have shown that cytokine response following vaccination are influenced by race and ethnicity (Haralambieva et al. 2013, Haralambieva 2014). However, it was not possible to analyze this data separately by race.
Future Studies:
REFERENCES
Aguilar-Salinas CA, Garía EG, Robles L, Riaño D, et al. “High adiponectin concentrations are associated with the metabolically healthy obese phenotype.” J Clin Endocrinol Metab 93.10 (2008): 4075-9.
Berrington de Gonzalez A, Hartge P, Cerhan JR, Flint AJ, Hannan L, MacInnis RJ, et al. “Body-mass index and mortality among 1.46 million white adults.” N Engl J Med 363.23 (2010): 2211-2219
Boyntom A, Neuhouser ML, Wener MH, Wood B, Sorensen B, Chen-levy Z, Kirk EA, Yasui Y, Lacroix K, McTiernan A, Ulrich CM. “Associations between healthy eating patterns and immune function on inflammation in overweight or obese postmenopausal women.” Am J Clin Nutr 86.5 (2007): 1445-1455.
Brochu M, Tchernof A, Dionne IJ, Sites CK, et al. “What are the physical characteristics associated with a normal metabolic profile despite a high level of obesity in postmenopausal women.” J Clin Endocrinol Metab 86.3 (2001): 1020-5.
Bruun JM, Helge JW, Richelsen B, Stallknecht B. “Diet and exercise reduce low-grade inflammation and macrophage infiltration in adipose tissue but not in skeletal muscle in severely obese subjects.” Am J Phys 290 (2006): 961-7.
Cawley John, Meyerhoefer C, “The medical care cost of obesity: an instrumental variables approach.” J Health Econ 31.1 (2012): 219-230.
Centers for Disease Control and Prevention. “Defining Overweight and Obesity.” Atlanta, GA: National Center for Chronic Disease Prevention and Health Promotion. 2012.
Centers for Disease Control and Prevention. “How much physical activity do adults need?” Atlanta, GA: National Center for Chronic Disease Prevention and Health Promotion. 2008. Cornier MA, Marshall JA, Maahs DM, Eckel RH. “Prevention of overweight/obesity as a strategy to optimize cardiovascular health.” Circulation 124.7 (2011): 840-850.
Deivert SF and Fleetwood MK. "Obesity and the Immune System." Obesity and the Immune System.” Obesity Action Coalition, Web. 31 Mar. 2014.
<http://www.obesityaction.org/educational-resources/resource-articles-2/general-articles/obesity-and-the-immune-system>.
Haralambieva IH, Ovsyannikova IG, Kennedy RB, Larrabee BR, et al. “Race and sex-based differences in cytokine immune responses to smallpox vaccine in healthy individuals.” Human Immunology 74 (2013): 1263-66
Haralambieva IH, Salk HM, Lambert ND, Ovsyannikova IG, et al. “Associations between race, sex, and immune response variations to rubella vaccination in two dependent cohorts.” Vaccine 32.17 (2014): 1946-53
Harty JT, Tvinnereim AR, White DW, “CD8+ T cell effector mechanisms in resistance to infection.” Annu Rev Immunol 18 (2000): 275-308.
Hong S, Dimitrov S, Pruitt C, Shaikh F, Beg N. “Benefit of physical fitness against inflammation in obesity: Role of beta adrenergic receptors.” Brain Behav Immun 1591.13 (2013)
Karelis AD. “Metabolically healthy but obese.” Lancet 372.9646 (2008): 1281-3.
Karelis AD, Faraj M, Bastard JP, St-Pierre DH, et al. “The metabolically healthy but obese individual presents a favorable inflammation profile.” J Clin Endocrinol Metab 90.7 (2005): 4145-50.
Karlsson EA, Beck MA. “The burden of obesity on infectious disease.” Exp Biol Med (Maywood) 235.12 (2010): 1412-1421
Karlsson EA, Sheridan PA, Beck MA. “Diet-induced obesity impairs the T cell memory response to influenza virus infection.” J Immunol 184.6 (2010): 3127-33
Karpe F, Dickmann JR, Frayn KN, “Fatty acids, obesity and insulin resistance: time for a reevaluation.” Diabetes 60.10 (2011): 2441-49.
Kizaki T, Takemasa T, Sakurai T, Izawa T, Hanawa T, Kamiya S, Haga S, et al. “Adaptation of macrophages to exercise training improves innate immunity.” Biochem Biophys Res Commun 372.1 (2008): 152-6
Kohut ML, Arntson BA, Lee W, Rozeboom K, Yoon KJ, Cunnick JE, McElhaney J. “Moderate exercise improves antibody response to influenza immunization in older adults.” Vaccine 22.17-18 (2004): 2298-2306.
Kohut ML, Cooper MM, Nickolaus MS, Russell DR, Cunnick JE. “Exercise and psychosocial factors modulate immunity to influenza vaccine in elderly individuals.” J Gerontol A Biol Sci Med Sci 57.9 (2002): M557-562.
Louie JK, Acosta M, Samuel MC, Schechter R, Vugia DJ, Harriman K, Matyas B. “A novel risk factor for a novel virus: obesity and 2009 pandemic influenza A (H1N1).” Clin Infect Dis 52.3 (2011): 301-312.
Lumeng CN, Bodzin JL, Saltiel AR. “Obesity induces a phenotypic switch in adipose tissue macrophage polarization.” J Clin Invest 117.1 (2007): 175-84.
Mahima, Ingle AM, Verma AK, Tiwari AK, Karthik K, Chakraborty S, et al. “Immunomodulators in day to day life: a review.” Pak J Biol Sci 16.17 (2013): 826-43
Martí A, Marcos A, Martínez JA. “Obesity and immune function relationships.” Obes Rev 2.2 (2001): 131-40.
Melzer K, Kayser B, Pichard C. “Physical activity: the health benefits outweigh the risks.” Curr Opin Clin Nutr Metab Care 7.6 (2004): 641-647.
National Institute of Allergy and Infectious Diseases. The Flu Types – Seasonal, Pandemic,
Avian (Bird), Swine [Internet]. Available from:
http://www.niaid.nih.gov/topics/Flu/understandingFlu/Pages/definitionsOverview.a.spx. Accessed April, 2014.
Ogden CL, Caroll MD, Kit BK, Flegal KM. Prevalence of obesity in the United States, 2009-2010. NCHS Data Brief, no 82. Hyattsville, MD: National Center for Health Statistics. 2012. Owen CG, Whincup PH, Orfei L, Chou QA, et al. “Is body mass index before middle age related to coronary heart disease risk in later life? Evidence from observational studies.” Int J Obes (Lond). 33.8 (2009): 866-77.
Pae M, Meydani SN, Wu Dayong. “The role of nutrition in enhancing immunity in aging.” Aging Dis 3.1 (2012): 91-129.
Paich HA, Sheridan PA, Handy J, Karlsson EA, et al. “Overweight and obese adult humans have a defective cellular immune response to pandemic H1N1 Influenza a virus” Obesity 21.11 (2013): 2377-86.
Perez de Heredia F, Gomez-Martinez S, Marcos A. “Obesity, Inflammation, and the immune system.” Proceedings of the Nutrition Society 71.2 (2012): 332-38.
Rawat R, McCoy SI, Kadiyala S. “Poor diet quality is associated with low CD4 count and anemia and predicts mortality among antiretroviral therapy-naïve HIV-poitive adults in Uganda.” J Acquir Immune Defic Syndr 62.2 (2013): 246-253.
Sheridan PA, Paich HA, Handy J, Karlsson EA, Hudgens MG, Sammon AB, Holland LA, Weir S, Noah TL, Beck MA. “Obesity is associated with impaired immune response to influenza vaccination in humans.” Int J Obes (Lond) 36.8 (2012): 1072-1077.
Smith AG, Sheridan PA, Harp JB, Beck MA. “Diet-induced mice have increased mortality and altered immune responses when infected with influenza virus.” J Nutr 137.5 (2007): 1236-43. Song YM, Sung J, Davey Smith G, Ebrahim S. “Body mass index and ischemic hemorrhagic stroke: a prospective study in Korean men.” Stroke 35.4 (2004):831-6
Topolski TD, LoGerfo J, Patrick DL, Williams B, Walwick J, Patrick MB. “The rapid assessment of physical activity (RAPA) among older adults” Prev Chronic Dis 3.4 (2006): A118.
Vieira VJ, Valentine RJ, Wilund KR, Antao N, Baynard T, Woods JA. “Effects of exercise and low-fat diet on adipose tissue inflammation and metabolic complications in obese mice.” Am J Phys 296 (2009): 1164-71.
Vinzi VE, Chin WW, Henseler J, Wang H. (2010) Handbook of Partial Least Squares: Concepts, Methods, and Applications Berlin, Germany: Springer
Wang YC, McPherson K, Marsh T, Gortmaker SL, Brown M. “Health and economic burden of the projected obesity trends in the USA and the UK.” Lancet 378.9793 (2011): 815-25.
Weisberg SP, McCann D, Desai M, et al. “Obesity is associated with macrophage accumulation in adipose tissue.” J Clin Invest 112.12 (2003): 1796-1808.
Whitlock G, Lewington S, Sherliker P, Clarke R, Emberson J, et al. “Body-mass index and cause-specific mortality in 900 000 adults: collaborative analyses of 57 prospective studies.” Lancet 373.9669: 1083-96
World Health Organization. “Influenza (seasonal).” WHO Fact Sheet, no 211. Geneva, Switzerland: World Health Organization Media Centre. 2014.
World Health Organization. Obesity and overweight. WHO Fact Sheet, no 311. Geneva, Switzerland: World Health Organization Media Centre. 2013.
Yang H, Youm Y, Vandanmagsar B, et al. “Obesity accelerates thymic aging.” Blood 114.18 (2009): 3803-3812.