i
Barriers to Wellness
Amongst Military Hospital Employees
By
Darren W. Hearn
A Master’s Paper submitted to the faculty of the University of North Carolina at Chapel Hill
in partial fulfillment of the requirements for the degree of Master of Public Health in
the Public Health Leadership Program
Chapel Hill Spring 2016
____________________________________
____________________________________ Date
____________________________________
iii ABSTRACT
Darren W. Hearn: Barriers to Wellness Amongst Hospital Employees (Under the direction of Lori Evarts and Elina Hodges)
Multiple studies have investigated perceived barriers to employees participating in
wellness activities at the workplace and have shown these barriers to have significant
effect on human behavior, lack of physical activity and overall lifestyles. Research on
specific barriers to wellness has taken place in unique employer environments,
including those analyzing wellness among shift workers, but there is a lack of evidence
evaluating specific barriers faced by personnel working in a military hospital.
In partnership with US Army Public Health Command, we surveyed both uniformed
and civilian workers in a military hospital to determine what barriers to wellness,
specifically physical activity, exist. We asked questions, performed analysis on how to
best mitigate these barriers, and investigated the correlation that exists between the
barriers and overall perceived health.
Our analyses indicate that time and lack of motivation are the most common barriers
to physical activity. Additionally, as the number of barriers to physical activity increase,
so does the likelihood that employees perceive themselves as being unhealthy.
Key Words: Wellness, work-place wellness, physical activity, barriers to physical
iv
Acknowledgements
v
Table of Contents
List of Tables……… vi
List of Figures……….. vii
List of Abbreviations……….. viii
Introduction……… 1
Methods……….4
Results………...6
Discussion………....9
Table 1………14
Figure 1………..15
Figure 2………..16
Figure 3………..17
Table 2………18
Table 3………19
Table 4………20
vi
List of Tables
Table 1: Demographic Data……….………..14
Table 2: Chi Squared Analysis………...…..18
Table 3: Univariate Analysis with Numbers of Barriers……….19
vii
List of Figures
Figure 1: Barriers to Physical Activity……….….……....15
Figure 2: Aspects that Would Improve Physical Activity………...……..16
viii
List of Abbreviations
AHA………...……….American Heart Association
DoD………...…………Department of Defense
DUA……….………..Data Use Agreement
IOM………Institute of Medicine
IRB………..………Institutional Review Board
SPSS®………..….Statistical Package for the Social Sciences (from IBM)
1 INTRODUCTION
The United States and much of the world faces a growing epidemic of obesity
(Institute of Medicine (US) Committee on Health and Behavior: Research, 2001; Ogden,
C.L. et al., 2006). The condition now even includes children and adolescents who are
facing obesity climbing at an alarming rate (Ogden, C.L. et al., 2006). The
consequences of this serious problem are well established and potentially devastating.
Conditions associated with an elevated body mass include but are not limited to
diabetes, hypertension, coronary heart disease, and even certain malignancies (Institute
of Medicine (US) Committee on Health and Behavior: Research, 2001; Pi-Sunyer,
2002). For many Americans, obesity and elevated body mass is a consequence of
decreased physical activity. The many advancements in developed societies including
easier transportation, more convenient technology, and decreased need for manual
labor have also contributed to this trend. Further, trends indicate an overall decrease in
physical activity worldwide (Harvard School of Public Health, 2015).
The paradox in the developed world situation is that despite advances in
technology and equipment that eliminate the need for certain types of work, most
individuals are now busier than they once were. In fact, Americans specifically have
workweeks longer than other wealthy industrialized countries and are more likely to
work odd and/or weekend hours (Hamermesh & Stancanelli, 2014). This unhealthy
balance often results in employees spending more time at their place of work than any
other location. Thus, worksites are now playing increasingly larger roles in promoting
healthy behaviors (Sorensen, G. et al., 1999). Large multinational corporations like
2
opportunities for physical activity (“Corporate Fitness Centers Increasing Across the
Nation - Athletic Business,” 2015). Such efforts offer more than just another benefit;
they provide a means to decrease barriers to wellness.
Barriers borne of our hectic and increasingly busy culture interfere with the
individual’s ability to maintain nutritional and spiritual wellness, and perhaps most
dramatically, a physically active life. Efforts to decrease these barriers therefore play an
increasingly important role. Multiple studies have examined both the reasons for being
physically active as well as the perceived barriers to activity and overall wellness
(Bautista, Reininger, Gay, Barroso, & McCormick, 2011; Justine, M., Azizan, A.,
Hassan, V., Salleh, Z., & Manaf, H., 2013; Matson-Koffman, D.M., Brownstein, J.N.,
Neiner, J.A., & Greaney, M.L., 2005; Phiri, Draper, Lambert, & Kolbe-Alexander, 2014;
Sjörs, Bonn, Lagerros, Sjölander, & Bälter, 2014; Trost, S.G., Owen, N., Bauman, A.E.,
Sallis, J.F., & Brown, W., 2002). Common barriers include lack of time, inexperience,
and lack of motivation (Bautista et al., 2011; Justine, M. et al., 2013; Phiri et al., 2014;
Sjörs et al., 2014; Trost, S.G. et al., 2002). Barriers impede all realms of wellness
maintenance but the aforementioned can be particularly detrimental when they affect an
individual’s ability to perform physical activity.
Although barriers can affect anyone without specific regard to their profession,
certain professions demand an inherently more difficult schedule that can itself be an
obstacle. Healthcare providers often have challenging work schedules and cannot
simply take a break for physical activity. This population specifically cites their schedule
3
service industry, long shifts, odd hours, and atypical schedules, logically detract from
their ability to be physically active beyond that which is required for their employment.
Researchers have studied barriers in various settings including corporate and
healthcare but there is sparse evidence on how barriers affect those working at military
hospitals (Blackford, Jancey, Howat, Ledger, & Lee, 2013; Phiri et al., 2014). Military
hospitals are unique as employees are not only active duty military but also government
civilian, and contractors. Often, many of the civilian employees (both government
civilian and contractors) are spouses of activity duty military personnel and therefore
directly subject to the rigors of the active duty military lifestyle. Even those who are not
spouses often have unique pressures put on them by the presiding environment. The
military lifestyle for activity duty personnel presents a unique set of challenges in
addition to magnifying problems their civilian counterparts face. The highly mobile life of
most military personnel usually means that family and social support networks are
strained or locally nonexistent. Routines are often changed by field problems,
deployments, and moves every two to four years. Finally, innumerable additional
duties, training, and obligations ask more of the military provider than traditional patient
care providers.
The purpose of this study is to address the research gap by investigating
common barriers to physical activity for employees within a military hospital. The
hypothesis is that time and lack of childcare would be the primary barriers to
performance of physical activity. Lack of childcare is hypothesized to be a barrier due to
historically long working hours and the aforementioned lack of social and family support.
4
barriers to physical activity with the individual’s perception of their personal health
status. The hypothesis is that previous injury being a current barrier to physical activity
will be correlated with an overall perception of not being healthy. Additionally explored
is the hypothesis that the presence of multiple barriers to physical activity will be
correlated with the individual perception of not being healthy.
METHODS
The health promotion team at a small, 42-bed military hospital with 1,197
employees and a large catchment area serving approximately 39,900 beneficiaries, saw
the need to ascertain the current barriers to physical, nutritional, and spiritual activity in
an effort to develop a successful employee wellness program. The team developed a
survey to gather this information in partnership with the US Army Public Health
Command (USAPHC). The USAPHC had the capability to provide the team a secure
link through which employees could access the survey and the ability to then provide
aggregate, de-identified data including the tables referenced below to the hospital
health promotion team. The study received permissions through the USAPHC research
board and a data use agreement (DUA) was formally put in place between the hospital
team and USAPHC. USAPHC also agreed to assist in statistical analysis of the results.
Additionally the study was later presented to the Institutional Review Board (IRB) at the
University of North Carolina, who on July 7, 2015, made a determination that the study
of the data did not constitute human research.
Information was gathered about employee barriers via secure web-based survey.
The survey was open to any hospital employee: government civilian, contractor, or
5
anonymous and optional for the employees. These stipulations were set forth by both
the hospital and USAPHC(Chervak & Schuh, 2015). Availability of the survey was
announced via digital daily announcements, verbal advertisement to large groups of
employees, word of mouth, and specific emails to the staff from hospital executives.
The survey was open from October to December 2014 for a total of 45 days. At the end
of the survey period, announcements and advertisements of the survey were more
frequent.
The survey design was multiple-listed-option with a skip design pattern. Subject
matter experts in the hospital from public health, physical therapy, dietetics, social work,
and religious departments submitted questions related to wellness and their particular
field. Although the focus of this research is only on the questions regarding barriers to
physical activity and perceived health, the total survey had 49 questions that included
questions from the aforementioned areas specifically regarding health behavior and
barriers to healthy behavior. When asked about barriers, respondents were instructed
to mark all barriers that applied to them. To improve speed and efficiency, certain
questions were not presented to the participant if it was appropriate for that person to
skip those questions. For most users, the total time to complete the survey was under
five minutes.
Following the survey closure, data were cleaned such that responses where
participants marked “other” were categorized.(Chervak & Schuh, 2015) The data were
then analyzed by USAPHC using SPSS® software. Initial categorization of data was by
state of perceived wellness and then further organized by age range, military affiliation
6
delineated by military or civilian grade, and health care specialty was also included as a
category. Within the category of physical activity, specific barriers were highlighted
along with the percentage of respondents who indicated that the specific barrier affected
their level of physical activity.
Chi squared analysis was performed on individual barriers to physical activity
with the dichotomized dependent variable of perceived health. This variable was
determined by the answer to the question “do you perceive yourself as being healthy”
with the two options for answer being “yes” or “no.” Statistical tests were evaluated at
the alpha = .05 level.
Logistic regression was then conducted, examining the correlation of the number
of reported barrier variables and the dichotomous dependent variable of perceived
health. The number of variables was a simple tally based on the number of affirmative
answers the participant marked when asked about various types of barriers.
Finally, multivariate regression was performed to assess the potential for
correlation between higher numbers of variables and perceived health, using a
multivariate analysis to control for demographic variables within the previous logistic
regression.
RESULTS
Valuable information was extracted from the results of the survey at each level of
statistical analysis. The survey population (see Table 1) was primarily represented by
uniformed, or active duty, personnel (described as “officer” and “enlisted” in future
7
contractors, indicated as “other” in future tables. First, it is important to understand how
the participants perceived their own health. In this survey, 90% of individuals
considered themselves to be healthy, and of those who considered themselves not to
be healthy (n=38), 95% were interested in becoming healthier. Although the survey
population largely considered itself to be healthy, many stated taking part in unhealthy
behaviors. To underscore the importance of further examining physical activity, 222
(58%) of respondents indicated that they did not get enough exercise. Furthermore,
158 (41%) of participants marked that they were either somewhat or very dissatisfied
with their personal physical activity and exercise.
Figure 1 illustrates specific barriers, outlined as percentage of respondents
indicating that barrier affected them. Lack of time was common to 65% of participants
and lack of motivation affected nearly half of participants at 45%. A previous medical
condition was considered a barrier in just over one-quarter of all participants at 28%.
These top three barriers were nearly twice as prevalent as all other barriers listed.
These findings invalidated the original hypothesis that lack of childcare was a significant
barrier.
To further expound upon the perceived barriers, participants also answered
questions about aspects they thought would improve their physical activity. Figure 2
depicts the importance of time to employees and how closely they associate time with
their ability to be physically active. 64% of participants indicated that time off during the
day would improve their physical activity, an aspect nearly three times as important as
any other. Incentives and access to personal trainers, two potential aspects to improve
8
It is important to highlight that the data suggest that barriers not only affect
physical activity itself, but also affect the organization and instruction on physical
activity. Figure 3 shows the interest in adult physical fitness broken down by military
affiliation, and as a combination, it represents the sample’s greatest interest. However,
the follow on questions indicate that nearly 60% of participants anticipated that lack of
time would be a barrier to attending health education classes or activities. Similarly,
over 40% thought the hours the activities would be available would potentially be a
barrier.
The initial analysis of barriers was quite helpful in understanding the barriers to
physical activity and the improvement of physical activity but more extensive analysis
could also be done to understand how these barriers may be affecting the 38 (10% of
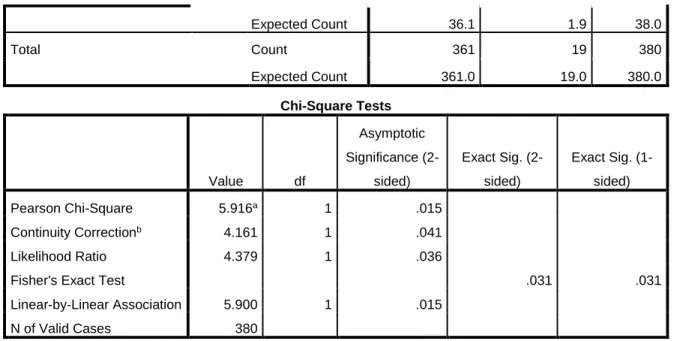
the sample) who perceived themselves as being unhealthy. Results of the Chi squared
analysis between each of the barriers and the dichotomous report of perceived health
showed previous injury and lack of knowledge to be correlated with perceived lack of
health (Table 2), with statistically significant results (p-value < .01).
Given that specific perceived barriers showed correlation to lack of perceived
health, the overall number of barriers an individual experienced was examined as a
potential correlative circumstance to perceived lack of health. Recalling that the
participant was asked to mark all barriers that applied, the opportunity for this analysis
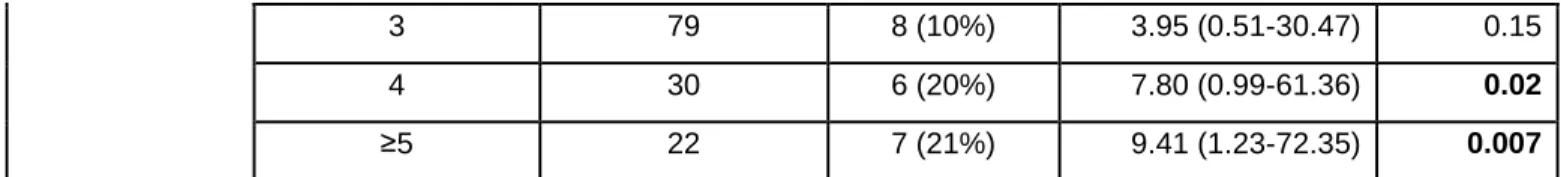
was available. Initial univariate analysis (Table 3) showed a steadily increased risk ratio
with the number of barriers the person indicated. This reached statistical significance at
four barriers, and the risk ratio confidence interval low value was greater than 1.00
9
As significance was reached in a univariate analysis, multivariate analysis to
control for potential confounding variables was performed. Given the myriad of data
gathered in the study, there were multiple options for multivariate analysis. While initially
it may seem logical to control for other health behaviors when evaluating physical
activity, such analysis would actually be inappropriate when viewing wellness as a
collective state of being. When viewing wellness as a holistic state, barriers to one
aspect of wellness could logically be applied to other aspects of wellness and therefore
affect the overall state of perceived wellness. That being the case, the decision was
made not to run the analysis controlling for multiple other barriers, but focus on
controlling for demographic variables, specifically age, gender, and military affiliation.
The results of the multivariate analysis in this fashion largely confirmed that of
the univariate analysis. Table 4 shows that when controlled for major demographic
status, the presence of four or more barriers reached statistical significance in its
correlation to the participant perceiving himself or herself as unhealthy. The odds ratio
was also again significant in this analysis as the low end of the confidence interval was
greater than 1.00 and p-value = .04.
DISCUSSION
Examining the barriers to employee wellness play an increasingly important role
in today’s society. With the growing problem of obesity and the associated
health-related effects playing a larger role than ever in medicine, the community, and the
workplace, careful examination of barriers to wellness, specifically physical activity and
exercise are essential. With workplaces now taking more prominent roles in advancing
10
carefully consider barriers to participating in wellness activities and their impact on the
overall health of their employees. The need to mitigate or even eliminate these barriers
is necessary not simply to enhance the employee experience, but to financially benefit
the organization. Financial incentive is gained through decreased health care costs,
increased productivity, improved morale, increased retention and decreased
absenteeism (Baicker, Cutler, & Song, 2010). This is an important point worthy of
emphasis. Savings is not simply associated with decreased health care costs; rather
additional revenue is appreciated when workers are present and well. Decreased
absenteeism, for example, allows workers to focus on their own productivity rather than
making up for the work not completed by an absent colleague. Baicker, Cutler and
Song (2010) found that the return on investment in wellness programs was $3.27 for
every dollar spent through decreased health care cost and $2.73 for every dollar spent
through decreased absenteeism.
In previous studies, researchers have found that in many cases, lack of time,
motivation, and knowledge have been barriers to an individual’s wellness (Bautista et
al., 2011; Justine, M. et al., 2013; Phiri et al., 2014; Sjörs et al., 2014; Trost, S.G. et al.,
2002) but there was little evidence available on if these same barriers were affecting
employees of a military medical facility given the unique aspects of that population.
This study confirms that the same barriers of time, motivation, and knowledge do, in
fact, influence the wellness of the military medical facility employee. To further confirm
this conclusion, participants indicated that if they could, they would change aspects of
their environment that directly related to these same barriers including carving out time
11
showed that the barriers not only affect the ability to be physically active, but employees
anticipate that similar barriers would affect the organization’s offering of physical
exercise groups and education sessions on physical activity and exercise.
Deeper analysis of barriers in this study actually demonstrate other important
corollaries. In a question heretofore largely uninvestigated, barriers not only affect the
individual’s ability to perform physical activity, but are also correlated with the person’s
perception of their own health. Specific barriers of previous injury and lack of
knowledge were shown to be correlated with perceived lack of individual health.
Consideration should also be given to the number of barriers a person perceives
toward their well-being. Univariate analysis alone and multivariate analysis controlling
for demographic characteristics indicate that if a person chose four or more barriers as
affecting their ability to perform physical activity, it was significantly correlated to them
perceiving themselves as being unhealthy. Although the consideration of this idea is
perfectly logical, the consequences are rather significant. It appears from the results of
this study that just the perception of barriers can be correlated to lack of perceived
health. Additional research examining the numbers of perceived barriers would be
beneficial to the increased understanding of the effect of barriers on the population.
Results indicate that barriers similar to that of other populations exist in a military
medical facility and that these very same barriers are statistically related to the
employee’s perceived health giving more credence to the idea that barriers must be
addressed in a fashion that is meaningful to the individual. This study was actually the
prequel to developing an employee wellness program at the studied military hospital.
12
programs is not new and, in fact, recommendations from the American Heart
Association (AHA) (Carnethon et al., 2009) state that employers should seek to reduce
or eliminate barriers that discourage use of worksite wellness programs. Further
research could be performed now on the most effective way to both measure and
efficiently address those barriers.
This study produced interesting results and indications for further study but as
with any study, did contain limitations. With approximately 32% of the hospital
population responding to the survey, it is plausible that those who responded to the
survey did not accurately represent the population. It is possible that the type of person
who is interested enough in wellness to fill out the survey may have different barriers
than those who were not interested at all. Secondly, the dichotomized self-assessment
of health may have led to a decreased ability to truly analyze results. With only 10% of
individuals reporting themselves to be unhealthy, there may not have been enough
power to accurately assess the correlation of barriers and state of perceived health. In
future studies, the use of a Likert scale may be a more efficient and powerful tool.
In conclusion, there has never been a greater need to assess, decrease, and
eliminate barriers to wellness than in today’s increasingly sedentary and obese society.
Barriers common to other employed populations also appear to be common to
employees of a military medical facility. Not only that, but the barriers appear to be
affecting the individual’s perceived health. Approaches to improving the barriers,
including environmental changes, are necessary and public health leaders should
continue to explore programs that utilize such techniques. Leaders in military hospitals
13
Defense (DoD) put forth in Operation Live Well (“Operation Live Well,” n.d.), writing that
they want “to make healthy living the easier choice and social norm...” Policies that
address barriers of time and motivation are particularly beneficial. Ogden Air Logistics
Center offers an excellent example. There, employees are authorized three hours per
week to participate in a fitness program. This agreement between the command and
the employee unit allows participants to participate in exercise activities but also
requires consistent documentation of the workouts, approved routines and health
clearances to continue participation (Close, K, 2009). A cultural change that embraces
physical activity and encourages it as a part of each day rather than something
squeezed in “when there is time” would be the most helpful step forward in decreasing
and eliminating the barriers to physical activity experienced by military healthcare
employees. The analysis and reporting of the successes and failures of these programs
14
Tables and Graphs
Table 1: Demographic Data [Table courtesy of Chervak and Schuh (2015)]
15
16
17
Figure 3: Health Education Topics of Interest by Military Affiliation [Figure courtesy of Chervak and Schuh (2015)]
0% 10% 20% 30% 40% 50% 60% 70%
P
e
rcen
ta
ge
of
r
e
sp
on
d
e
n
ts
18 Table 2: Chi squared analysis
Pain or previous medical diagnosis [Question: What
barriers do you face when trying to improve your
physical activity? (Check all that apply):
Total Not Selected Selected
Not selected, but
Other response
indicates
Do you consider yourself
healthy?
Yes Count 262 77 3 342
Expected Count 245.7 93.6 2.7 342.0
No Count 11 27 0 38
Expected Count 27.3 10.4 .3 38.0
Total Count 273 104 3 380
Expected Count 273.0 104.0 3.0 380.0
Crosstab
Lack of experience or knowledge
[Question: What barriers do you
face when trying to improve your
physical activity? (Check all that
apply):]
Total Not Selected Selected
Do you consider yourself
healthy?
Yes Count 328 14 342
Expected Count 324.9 17.1 342.0
No Count 33 5 38
Chi-Square Tests
Value df
Asymptotic
Significance
(2-sided)
Pearson Chi-Square 40.587a 2 .000
Likelihood Ratio 35.746 2 .000
Linear-by-Linear Association 33.710 1 .000
19
Expected Count 36.1 1.9 38.0
Total Count 361 19 380
Expected Count 361.0 19.0 380.0
Table 3: Univariate Analysis with Number of Barriers [Data table created at request of the author by Drs. Chervak and Schuh]
Variable category Total n n(%) consider
themselves unhealthy Risk Ratio (95% CI) p-value Number of barriers to physical activity
0 39 1 (3%) 1.00
1 108 7 (6%) 2.23 (0.32-19.89) 0.36
2 102 9 (9%) 3.44 (0.45-26.27) 0.20
Chi-Square Tests
Value df
Asymptotic
Significance
(2-sided)
Exact Sig.
(2-sided)
Exact Sig.
(1-sided)
Pearson Chi-Square 5.916a 1 .015
Continuity Correctionb 4.161 1 .041
Likelihood Ratio 4.379 1 .036
Fisher's Exact Test .031 .031
Linear-by-Linear Association 5.900 1 .015
N of Valid Cases 380
a. 1 cells (25.0%) have expected count less than 5. The minimum expected count is 1.90.
20
3 79 8 (10%) 3.95 (0.51-30.47) 0.15
4 30 6 (20%) 7.80 (0.99-61.36) 0.02
≥5 22 7 (21%) 9.41 (1.23-72.35) 0.007
Table 4: Multivariate Analysis with Number of Barriers (controlling for
demographic data) [Data table created at request of the author by Drs. Chervak and Schuh]
Variable category Total n n(%) consider themselves
unhealthy
Odds Ratio (95% CI)
p-value
Number of barriers to physical activity
0 39 1(3%) 1.00
1 108 7(6%) 2.05(0.24-17.62) 0.52
2 102 9(9%) 3.06(0.36-25.78) 0.30
3 79 8(10%) 3.49(0.41-29.52) 0.25
≥4 52 13(25%) 9.44(1.14-78.48) 0.04
Age 18-25 34 1(3%) 1.00
26-39 145 10(7%) 2.74(0.32-23.79) 0.36
40-54 138 16(12%) 4.41(0.48-40.47) 0.19
55+ 63 11(17%) 6.73(0.65-69.48) 0.11
Gender Male 166 11(6%) 1.00
Female 214 27(13%) 1.34(0.55-3.27) 0.53
Military affiliation Enlisted 118 8(7%) 2.17(0.58-8.14) 0.25
Officer 87 4(5%) 1.00
DA Civilian 169 25(15%) 2.06(0.62-6.86) 0.24
21
REFERENCES
Baicker, K., Cutler, D., & Song, Z. (2010). Workplace Wellness Programs Can Generate Savings.
Health Affairs, 29(2), 304–311. http://doi.org/10.1377/hlthaff.2009.0626
Bautista, L., Reininger, B., Gay, J. L., Barroso, C. S., & McCormick, J. B. (2011). Perceived Barriers
to Exercise in Hispanic Adults by Level of Activity. Journal of Physical Activity & Health,
8(7), 916.
Blackford, K., Jancey, J., Howat, P., Ledger, M., & Lee, A. H. (2013). Peer Reviewed: Office-Based
Physical Activity and Nutrition Intervention: Barriers, Enablers, and Preferred Strategies
for Workplace Obesity Prevention, Perth, Western Australia, 2012. Preventing Chronic
Disease, 10. http://doi.org/10.5888/pcd10.130029
Carnethon, M., Whitsel, L. P., Franklin, B. A., Kris-Etherton, P., Milani, R., Pratt, C. A. … and
Council on Nutrition, P. A. and M. (2009). Worksite Wellness Programs for
Cardiovascular Disease Prevention A Policy Statement From the American Heart
Association. Circulation, 120(17), 1725–1741.
http://doi.org/10.1161/CIRCULATIONAHA.109.192653
Chervak, M., & Schuh, A. (2015, February). Assessment of Injuries and Fitness among Employees
at General Leonard Wood Army Community Hospital: Survey Results. Fort Leonard
22
Close, K. (2009, May 12). AFMC Civilian Wellness Letter_0.pdf. Retrieved January 7, 2016, from
http://75thforcesupport.com/sites/default/files/AFMC%20Civilian%20Wellness%20Lett
er_0.pdf
Corporate Fitness Centers Increasing Across the Nation - Athletic Business. (2015, June).
Retrieved November 22, 2015, from
http://www.athleticbusiness.com/fitness-training/corporate-fitness-centers-increasing-across-the-nation.html
Hamermesh, D. S., & Stancanelli, E. (2014). Long Workweeks and Strange Hours (No. w20449).
National Bureau of Economic Research. Retrieved from
http://www.nber.org.libproxy.lib.unc.edu/papers/w20449
Institute of Medicine (US) Committee on Health and Behavior: Research, P. (2001).
Findings and Recommendations. Retrieved from
http://www.ncbi.nlm.nih.gov/books/NBK43746/
Justine, M., Azizan, A., Hassan, V., Salleh, Z., & Manaf, H. (2013). Barriers to participation in
physical activity and exercise among middle-aged and elderly individuals. - PubMed -
NCBI. Retrieved November 19, 2015, from
http://www.ncbi.nlm.nih.gov/pubmed/24154584
Matson-Koffman, D.M., Brownstein, J.N., Neiner, J.A., & Greaney, M.L. (2005). A site-specific
literature review of policy and environmental interventions that promote physical
activity and nutrition for cardiovascular health:... - PubMed - NCBI. Retrieved November
23
Ogden, C.L., Carroll, M.D., Curtin, L.R., McDowell, M.A., Tabak, C.J., & Flegal, K.M. (2006).
Prevalence of overweight and obesity in the United States, 1999-2004. - PubMed - NCBI.
Retrieved November 19, 2015, from http://www.ncbi.nlm.nih.gov/pubmed/16595758
Operation Live Well. (n.d.). Retrieved January 7, 2016, from
http://www.health.mil/Military-Health-Topics/Operation-Live-Well
Phiri, L. P., Draper, C. E., Lambert, E. V., & Kolbe-Alexander, T. L. (2014). Nurses’ lifestyle
behaviours, health priorities and barriers to living a healthy lifestyle: a qualitative
descriptive study. BMC Nursing, 13(1), 38. http://doi.org/10.1186/s12912-014-0038-6
Pi‐Sunyer, F. X. (2002). The Obesity Epidemic: Pathophysiology and Consequences of Obesity.
Obesity Research, 10(S12), 97S–104S. http://doi.org/10.1038/oby.2002.202
Sjörs, C., Bonn, S. E., Lagerros, Y. T., Sjölander, A., & Bälter, K. (2014). Perceived Reasons,
Incentives, and Barriers to Physical Activity in Swedish Elderly Men. Interactive Journal
of Medical Research, 3(4), e15. http://doi.org/10.2196/ijmr.3191
Sorensen, G., Stoddard, A., Peterson, K., Cohen, N., Hunt, M.K., Stein, E., … Lederman, R. (1999).
Increasing fruit and vegetable consumption through worksites and families in the
treatwell 5-a-day study. - PubMed - NCBI. Retrieved November 19, 2015, from
http://www.ncbi.nlm.nih.gov/pubmed/9987465
Trost, S.G., Owen, N., Bauman, A.E., Sallis, J.F., & Brown, W. (2002). Correlates of adults’
participation in physical activity: review and update. - PubMed - NCBI. Retrieved
![Table 1: Demographic Data [Table courtesy of Chervak and Schuh (2015)]](https://thumb-us.123doks.com/thumbv2/123dok_us/8345878.2218033/22.918.114.796.202.812/table-demographic-data-table-courtesy-chervak-schuh.webp)
![Figure 1: Barriers to Physical Activity [Figure courtesy of Chervak and Schuh (2015)]](https://thumb-us.123doks.com/thumbv2/123dok_us/8345878.2218033/23.918.142.797.255.832/figure-barriers-physical-activity-figure-courtesy-chervak-schuh.webp)
![Figure 2: Aspects that would improve physical activity [Figure courtesy of Chervak and Schuh (2015)]](https://thumb-us.123doks.com/thumbv2/123dok_us/8345878.2218033/24.918.127.800.251.792/figure-aspects-improve-physical-activity-figure-courtesy-chervak.webp)
![Figure 3: Health Education Topics of Interest by Military Affiliation [Figure courtesy of Chervak and Schuh (2015)]](https://thumb-us.123doks.com/thumbv2/123dok_us/8345878.2218033/25.918.110.852.256.733/figure-health-education-topics-military-affiliation-courtesy-chervak.webp)