i
Geographic Variation in Knee Replacement Surgery: Provider or Population Driven?
Stephanie Tiele Poley
A dissertation submitted to the faculty of the University of North Carolina at Chapel Hill in partial fulfillment of the requirements for the degree of Doctor of Philosophy in the Department of Health Policy and Management, Gillings School of Global Public Health.
Chapel Hill 2011
Approved by Thomas Ricketts Sandra Greene Mark Holmes Scott Kelley John Paul
ii
© 2011iii
Abstract
Stephanie Tiele Poley
Geographic variation in knee replacement surgery: Provider or population driven? (Under the direction of Thomas Ricketts)
In recent years there has been rapid growth in the use of total knee arthroplasty (TKA). This study examines longitudinal and geographic trends for TKA in North Carolina between 2000 and 2009. Data are drawn from the North Carolina Discharge databases, linked to external datasets and analyzed by provider, facility, and county. Discharges with an ICD-9 procedure code for TKA (81.54) are included in the analyses.
iv
Multivariate spatial regression analysis of TKA utilization in 2008 found that the most significant predictors of county TKA utilization were supply related. County supply of primary care providers per 100,000 persons, the presence of a hospital with high-volume of TKA, the number of skilled nursing facilities, and number of hospital beds were all
statistically significant predictors of use. The county rate of uninsurance, admission rate for marker conditions, and the spatial parameter representing TKA utilization for neighboring counties were also statistically significant factors.
v
For PorterSo that I may provide every possible opportunity for you.
vi
Acknowledgements
The road that led me to this achievement was marked by a few bumps, dead ends, pleasant diversions, detours, and a big hill at the end. But I made it to the end and my journey was greatly enriched by taking the scenic route. I credit my compass, my crew, my
cheerleaders, and my stubbornness for getting me here.
UNC is an amazing institution and I owe a big thanks to past and present colleagues. First and foremost, I would like to express my sincerest gratitude to the members of my
dissertation committee. Tom Ricketts, my dissertation chair / advisor / boss / mentor, has taught me to think big, to be meticulous but pragmatic at the same time, and he has always given me the latitude to do things my own way. He believed I could do this and didn’t give
up on me. Sandra Greene provided technical and practical advice on my project, motivation (sometimes in the form of shame), wisdom and empathy during rough patches, and has been an incredible professional role model and source of advice for me. Mark Holmes, my methods “trainer”, pushed me to think harder than I believed I was capable of, always in
pursuit of a better product. Scott Kelley offered invaluable clinical guidance that shaped the design of this study. John Paul was a generous resource for information on the original studies of knee replacement surgery and a great editor.
vii
about completing a dissertation. Paul Voss was exceedingly generous with his time,
teaching me spatial data analysis methods and reviewing my proposal and final dissertation. Ann Howard and Randy Randolph never turned me away when I needed help with a
programming trick or glitch. Katie Gaul helped to refine my cartographic skills and coach me on making pretty maps. Jen King was a great sounding board and source of moral support; it helped so much to not feel alone in my anxiety and fear of failure. My ACS HPRI
colleagues, especially Dr.Sheldon, were an amazing source of clinical advice,
encouragement and enthusiasm for this project. Kristie Thompson took the reins, making it possible for me to focus on this project, and has been a wonderful friend, too. I could not have made it through this process without such a strong network of professional support.
My friends and family have been so loyal, thoughtful, and encouraging throughout my graduate studies, somehow knowing when (and when not) to ask about my progress. Most suffered through boring explanations of my dissertation project, feigning interest and
listening patiently as I worked through little (and big) problems. Many even provided helpful insight or reviewed my work. You are too numerous to name individually (and I don’t want
to risk forgetting someone), but please know that your support was essential in
accomplishing my goal. Two in particular, Lu and Arthur, kept my feet warm and softened my brow on countless occasions without ever saying a word. Thank you all, sincerely.
viii
Table of Contents
List of Abbreviations ... xiv
1. Introduction ... 1
1.1. Background ... 1
1.1.1. Knee Arthroplasty ... 2
1.1.2. Clinical Effectiveness of Knee Arthroplasty ... 6
1.1.3. Cost-Effectiveness of Knee Arthroplasty... 8
1.2. Study Purpose and Specific Aims ... 9
1.3. Relevance ...10
1.4. Conceptual Framework ...13
1.5. Regional Variation ...14
1.6. Healthcare Supply and Surgeon-Induced Demand ...14
1.7. Andersen’s Behavioral Model of Healthcare Utilization ...18
2. Literature Review ... 20
2.1. Overview of Literature Review ...20
2.2. Utilization Trends and Demographic Profile of Patients ...20
2.3. Risk Factors for Knee Arthroplasty ...22
2.4. Geographic Variation and Induced Demand for Knee Replacement Surgery ...29
2.5. Physician Practice Style in Knee Arthroplasty...30
3. Research Design ... 32
3.1. Overview of Methods ...32
ix
3.3. Unit of Analysis and Geography ...35
3.4. Data Sources...36
3.4.1. NC Discharge Databases ... 36
3.4.2. North Carolina Office of State Budget and Management ... 37
3.4.3. Area Resource File ... 37
3.4.4. Current Population Survey Estimates ... 38
3.4.5. Nielsen Claritas® Demographic Data ... 38
3.4.6. North Carolina Medical Board’s Physician Licensure Data ... 39
3.4.7. Division of Health Service Regulation (DHSR) Data ... 39
3.4.8. Centers for Disease Control and Prevention County Summary of Obesity from the Behavioral Risk Surveillance System (BRFSS) Data ... 40
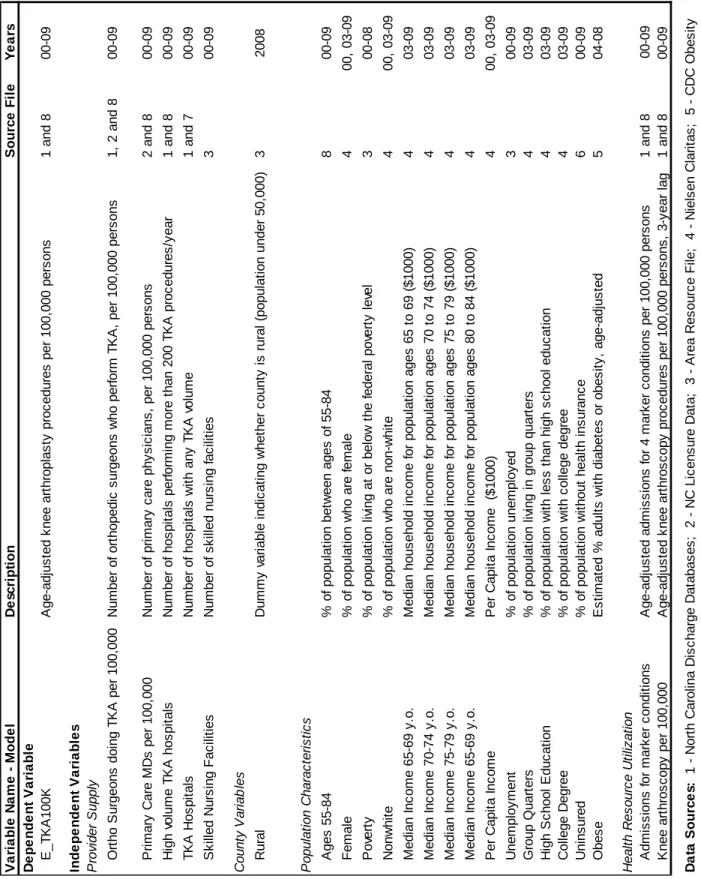
3.5. Measures ...41
3.5.1. Dependent Variable ... 41
3.5.2. Independent Variables ... 42
3.6. Hypotheses ...48
3.7. Analytical Methods By Research Aim ...50
3.7.1. Aim 1: Change in Patient Characteristics ... 50
3.7.2. Aim 2 (Part 1): Change in Orthopedic Surgeons Performing TKA ... 52
3.7.3. Aim 2 (Part 2): Change in Hospitals Performing TKA ... 54
3.7.4. Aim 3: Factors Associated with County Utilization of TKA ... 55
4. Results ... 60
4.1. Overview of Results...60
4.2. Longitudinal Trends in Knee Replacement Utilization ...60
4.3. Characteristics of Knee Arthroplasty Discharges ...61
x
4.5. Orthopedic Surgeons Performing Knee Arthroplasty ...70
4.6. County-level Utilization of Knee Arthroplasty ...73
5. Discussion and Conclusions ... 99
5.1. Summary and Interpretation of Findings ...99
5.2. Implications for Quality, Access, and Costs ... 104
5.3. Limitations ... 110
5.4. Conclusions ... 113
xi
List of Figures
Figure 1. Knee Joint Before and After Knee Arthroplasty... 2
Figure 2. Knee Prosthesis ... 2
Figure 3. U.S. Hospitalizations in 2007 ... 6
Figure 4. Demand Shifting ... 15
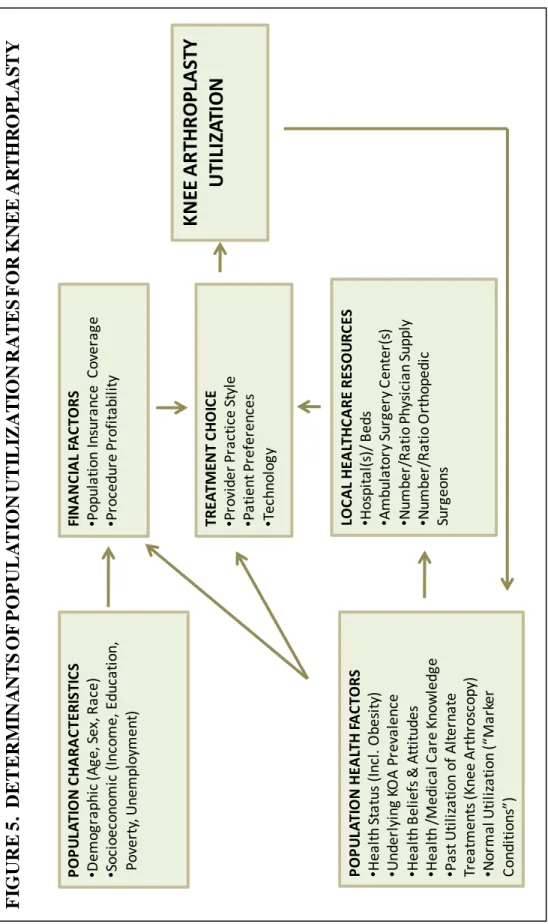
Figure 5. Determinants of Population Utilization for Knee Arthroplasty ... 19
Figure 6. Sample and File Structure ... 34
Figure 7. Data Sources and Description of Measures ... 43
Figure 8. Definitions of “Marker Conditions”... 48
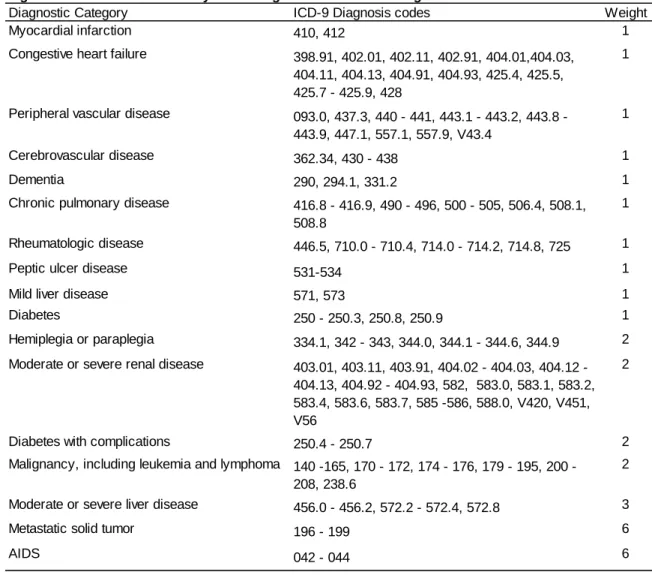
Figure 9. Charlson Comorbidity Index Diagnosis Codes and Weights ... 52
Figure 10. Number of Knee Arthroplasty Discharges and Providers Analyzed ... 53
Figure 11. Inpatient Knee Arthroplasty Discharges, North Carolina, 2000 - 2009 ... 61
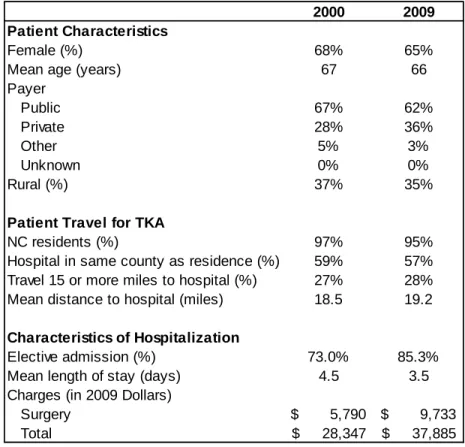
Figure 12. Descriptive Statistics for Inpatient TKA Discharges, North Carolina ... 62
Figure 13. Age Distribution of Inpatient Knee Arthroplasty Discharges, North Carolina, 2000 - 2009 ... 63
Figure 14. Primary Payer for Inpatient Knee Arthroplasty Discharges, North Carolina, 2000-2009 ... 63
Figure 15. Charges for Discharges with Knee Arthroplasty, North Carolina, 2000 - 2009 ... 65
Figure 16. Diagnoses for Inpatient Discharges with Knee Arthroplasty, North Carolina, 2009 ... 65
xii
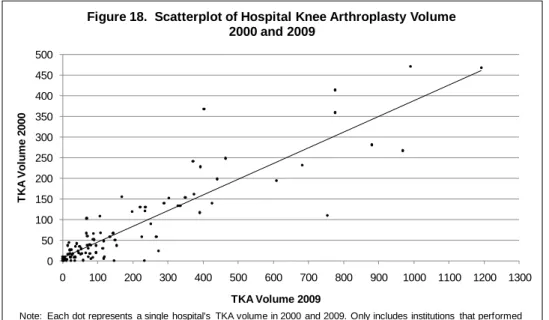
Figure 18. Scatterplot of Hospital Knee Arthroplasty Volume, 2000 and 2009 ... 67
Figure 19. Number of North Carolina Hospitals Performing Knee Arthroplasty ... 68
Figure 20. Volume of Knee Arthroplasty Procedures in North Carolina Hospitals ... 68
Figure 21. Inpatient Knee Arthroplasty Utilization by Institutional Volume of TKA,
North Carolina, 2000 - 2009 ... 70
Figure 22. NC Orthopedic Surgeons Performing TKA 2000 - 2009,
By Provider-Years ... 70
Figure 23. Volume of NC Inpatient Discharges with Knee Arthroplasty and Number
of Providers, 2000 - 2009 ... 71
Figure 24. Characteristics of NC Orthopedic Surgeons Performing Knee
Arthroplasty, 2000-2009 ... 71
Figure 25. NC Knee Arthroplasty Procedures by Provider Characteristics,
2000 - 2009 ... 72
Figure 26. NC Knee Arthroplasty Discharges by Provider Volume,
2000 - 2009 ... 73
Figure 27. NC County Rates of Inpatient Knee Arthroplasty Utilization, Age
Adjusted per 100,000 Persons, 2000 - 2009 ... 73
Figure 28. NC County Rates of Inpatient Knee Utilization, Age Adjusted per
100,000 Persons, By Rural-Urban Location, 2000 - 2009 ... 74
Figure 29. Knee Arthroplasty Procedures per 100,000 Persons,
Age Adjusted, 2000 ... 76
Figure 30. Knee Arthroplasty Procedures per 100,000 Persons,
Age Adjusted, 2009 ... 77
Figure 31. North Carolina Knee Arthroplasty Utilization Rates with Location
of Hospitals and Orthopedic Surgeons, 2000 ... 78
Figure 32. North Carolina Knee Arthroplasty Utilization Rates with Location of
Hospitals and Orthopedic Surgeons, 2001 ... 79
Figure 33. North Carolina Knee Arthroplasty Utilization Rates with Location of
Hospitals and Orthopedic Surgeons, 2002 ... 80
Figure 34. North Carolina Knee Arthroplasty Utilization Rates with Location of
xiii
Figure 35. North Carolina Knee Arthroplasty Utilization Rates with Location of
Hospitals and Orthopedic Surgeons, 2004 ... 82
Figure 36. North Carolina Knee Arthroplasty Utilization Rates with Location of Hospitals and Orthopedic Surgeons, 2005 ... 83
Figure 37. North Carolina Knee Arthroplasty Utilization Rates with Location of Hospitals and Orthopedic Surgeons, 2006 ... 84
Figure 38. North Carolina Knee Arthroplasty Utilization Rates with Location of Hospitals and Orthopedic Surgeons, 2007 ... 85
Figure 39. North Carolina Knee Arthroplasty Utilization Rates with Location of Hospitals and Orthopedic Surgeons, 2008 ... 86
Figure 40. North Carolina Knee Arthroplasty Utilization Rates with Location of Hospitals and Orthopedic Surgeons, 2009 ... 87
Figure 41. Sample Statistics for County Aggregated Data, North Carolina ... 90
Figure 42. Knee Arthroplasty per 100k in 2008, North Carolina ... 91
Figure 43. Moran's I for TKA Utilization, 2008 ... 91
Figure 44. LISA Map of TKA Utilization, 2008... 92
Figure 45. LISA Map of Multivariate Regression Residuals, 2008 ... 92
Figure 46. Multivariate Regression Results for 2008 Model of North Carolina County Knee Arthroplasty Utilization ... 94
Figure 47. Multivariate Regression Results for Change in North Carolina County Utilization of Knee Arthroplasty Utilization, 2004-2008 ... 98
Figure 48. Knee Arthroscopy Discharges, North Carolina 1997-2006 ... 103
Figure 49. Characteristics of Discharges That Do Not Link to Provider Licensure Data ... 111
xiv
List of Abbreviations
ACGME The Accreditation Council for Graduate Medical Education AHRQ Agency for Healthcare Research and Quality
AIC Akaike Information Criterion
ARF Area Resource File
BLS Bureau of Labor Statistics
BMI Body Mass Index
BRFSS Behavioral Risk Factor Surveillance Survey
B-P Breusch-Pagan Test
CDC Centers for Disease Control and Prevention CMS Centers for Medicare and Medicaid Services
CPI Consumer Price Index
CPS Current Population Survey
DHSR Division of Healthcare Services Regulation
DRG Diagnosis Related Group
FE Fixed Effects Regression
FIPS Federal Information Processing System HCUP Healthcare Cost and Utilization Project HRQoL Healthcare Related Quality of Life HRR Hospital Referral Region
xv
J-B Jarque-Bera Test
KA Knee Arthroplasty
KOA Knee Osteoarthritis
LISA Local Indicators of Spatial Autocorrelation
LM Lagrange Multiplier Test
MDC Major Diagnostic Category MIS Minimally Invasive Surgery
NCHPDS North Carolina Health Professions Data System NCIOM North Carolina Institute of Medicine
NHANES National Health and Nutrition Examination Survey NCOSMB North Carolina Office of State Budget and Management NIS Nationwide Inpatient Sample (Discharge Data)
NPI National Provider Identification
OA Osteoarthritis
OLS Ordinary Least Squares Regression
PCI Per Capita Income
PCP Primary Care Provider
PPACA Patient Protection and Affordable Care Act SNF Skilled Nursing Facility
TKA Total Knee Arthroplasty
1
1. Introduction
1.1. Background
In recent years, there has been a sharp increase in the volume of orthopedic surgical procedures in the United States, particularly joint replacement. Between 1997 and 2005, hospitalizations involving musculoskeletal procedures increased by nearly 24%[1], far outpacing population growth of 11% during the same 9-year period1. Hospitalization for one of the most common orthopedic procedures, knee arthroplasty, increased by 69% between 1997 and 2005[1], and growth in demand for this procedure is expected to continue and accelerate over the next two decades. Why utilization of this procedure has changed so dramatically is unclear. Since neither the technology nor technique for knee arthroplasty has changed substantially in recent years, most explanations of the increase tend to focus on changes in the patient population, their lifestyles and health behaviors, and the practice patterns of providers performing the surgery. This study examines longitudinal and
geographic trends in knee arthroplasty in North Carolina between 2000 and 2009 and describes patterns of the utilization at the patient and provider level, identifying factors that are associated with the increase in utilization.
The study approach is driven by literature on geographic variation in health care utilization, especially the work by Wennberg and associates at Dartmouth since the 1970s.[2-10] In a landmark study of healthcare utilization in Vermont, Wennberg et al. found hospitalization
1 http://www.census.gov/popest/archives/
2
rates for specific diagnoses and procedures that were ten times as high in some hospital service areas as in others. [5] The unexplained variation in utilization, according to Wennberg, is evidence of differences in physicians’ beliefs regarding the most efficacious
treatments and consumer preferences for conditions with multiple treatment options. Interest in regional variation among otherwise similar places remains prominent in health services research and in debates about reducing healthcare costs. Of significant concern is whether the variation may be indicative of under- or over-utilization. This study examines variation in knee arthroplasty rates as a function of population characteristics and local healthcare resources, using North Carolina counties as the unit of analysis.
1.1.1. Knee Arthroplasty
The normal knee joint is made up of three
compartments or bone surfaces, the lateral, medial, and patellofemoral, which function together as a complex hinge and allow the leg to extend, flex, rotate, and glide. Trauma or disease may erode cartilage in one or more compartment and lead to inflammation and pain.[11] Knee arthroplasty is a surgical procedure in which the diseased or
damaged knee joint tissue is resurfaced and an artificial knee joint is implanted (Figures 1 and 2). Surgery may involve some or all of the three knee bone surfaces. The most common indications for knee arthroplasty include severe osteoarthritis of
3
Osteoarthritis (OA) is a degenerative disease which affects joint cartilage and underlying bones, and the condition is often marked by inflammation, pain, stiffness and, occasionally, muscle atrophy. It is the most common form of arthritis and the CDC estimates that
approximately 26.9 million adults in the U.S. are currently affected by the disease2. A study by Hootman predicts prevalence of arthritis and rheumatic conditions will be 67 million (25% of the population) by 2030.[12] Idiopathic OA and other types such as rheumatoid or
posttraumatic OA have distinctly different disease pathways and causes; however, little information is available distinguishing the prevalence of each type. A study of the disease in Iowa estimated that approximately 12% of osteoarthritis cases are posttraumatic OA.[13] Risk factors for these different types of OA vary, but most research tends to focus on the risk factors associated with idiopathic OA.
A study by Hawker et al. estimated that 93.4% of all Medicare patients receiving knee replacements between 1985 and 1989 had a primary diagnosis of osteoarthritis,[14] and other studies indicate that knee arthroplasty may be more successful for degenerative conditions than traumatic injury.[15] Knee osteoarthritis is caused by gradual loss of cartilage between the bones of the knee joint. Primary osteoarthritis is generally associated with aging, a process during which an increase in the water content of the cartilage
gradually causes the protein composition to change such that the cartilage cracks and flakes. Secondary osteoarthritis is characterized by an underlying condition such as injury or obesity. Obesity causes osteoarthritis by eroding the cartilage through excessive
mechanical stress; metabolic processes such as diabetes, hypertension, and high levels of dietary fat may also have a biological effect which degrades cartilage, though the evidence on this association is weak and sparse.[16, 17] Osteoarthritis acts to degrade the normal
4
cushion of cartilage between bones, leaving friction between bones unmitigated and leading to inflammation and pain. Prosthetic implants, via knee arthroplasty, act as a substitute cushion for the damaged cartilage, thereby eliminating pain and restoring range of motion.
Knee arthroplasty techniques were adapted from those developed for hip arthroplasty in the 1960s by John Charnley, and the first generation of knee total condylar prostheses was introduced in 1972 by Insall and colleagues.[11] Today, there are multiple designs and manufacturers of prosthetic knees, and the procedure is one of the most common orthopedic procedures performed in the U.S. The procedure requires anesthesia and is increasingly being performed with minimally invasive techniques, described in more detail below. Prostheses can be implanted using cemented or cementless fixation techniques, the choice of which may affect the lifespan of the procedure.[18] Implant survivorship also varies according to patient characteristics and prosthesis. Overall, evidence points to a finite lifespan of prosthetic components and high likelihood of revision surgery due to aseptic loosening. Aseptic loosening is the shedding of microscopic particles from the polyethylene surface; it occurs as a result of the biological impact of wear on the polyethylene surfaces, which can be accelerated by mechanical demand, sterilization method, prosthesis size, and joint congruity.3 Literature indicates standard open arthroplasty results in 90% prosthesis survivorship at 10 to 15 years.[11, 18-21] NIH consensus statements suggest failure rates of approximately 1% per year at 20 years post surgery.[22]
Over the past three decades, advances in the procedure have been made in the
development of alternative prosthetic materials such as titanium, improvements in and better adherence to sterilization procedures, and innovations in the cementing process and
5
surface, to delay prosthetic failure due to aseptic loosening.[19, 24] Aseptic loosening is the primary cause of most revision surgeries.
Minimally invasive surgical (MIS) techniques, characterized by an 8-12 centimeter incision, are perhaps the most profound recent surgical innovation for knee arthroplasty. [21, 25] Introduced in the 1990s, the technique is appealing to both patients and doctors because MIS is believed to cause less damage to the extensor mechanism, shorten operative and recovery time, reduce pain, and improve post-operative healing.[21] However, some critics believe that the limited visualization may compromise component placement and
consequently shorten the survivorship of the prosthesis.[26]
A number of factors are considered when assessing a patient’s candidacy for knee
arthroplasty, including age, comorbidities, and the stage and anatomy of disease or joint damage. The main contraindication for the procedure is an active local or systemic
infection; other factors that may disqualify a patient for the procedure include poor vascular circulation, neurological disease, or previous history of septic arthritis.[11, 19, 22] Patients with moderate osteoarthritis may be appropriate candidates for less invasive therapies such as arthroscopy and osteotomy; however, the benefit of these other procedures depends on the severity and site of the osteoarthritis.[27] Further, some evidence suggests that these procedures may have limited benefit or, in fact, be harmful to the joint and lead to
complicated subsequent procedures including total knee arthroplasty.[28-30]
6
between 2005 and 2007 of nearly 9%. In 2007, there were 605,176 discharges in the United States involving a knee arthroplasty, making the overall incidence rate 200 per 100,000 persons (Figure 3).
1.1.2. Clinical Effectiveness of Knee Arthroplasty
Knee arthroplasty is widely accepted as a procedure to treat degenerated knees with favorable long-term results and low rates of complications and mortality. While complete rehabilitation may take up to 18 months, postoperative functional improvements and pain reduction are evident in a shorter time period for a large proportion of patients.[21] Twenty years of research show substantial overall improvements in functional status, health-related quality of life, and pain alleviation; the NIH consensus statement estimates 85 percent of patients are satisfied with results from knee arthroplasty.[22] A recent case-control study by Hawker et al. found that Canadian patients with osteoarthritis who had joint arthroplasty, compared with those who did not have the procedure, experienced significant reductions in pain, disability, associated arthritis-attributable health care costs, and stable general health status.[31] However, the vast majority of literature on knee arthroplasty outcomes shows that clinical effectiveness varies according to patient demographics, health-related factors,
Knee arthroplasty All hospital stays Number of hospital stays (% of all stays) 605,176 (1.5%) 39,541,948 (100%)
Mean length of stay 3.6 days 4.6 days
Mean hospital cost $14,777 $8,692
Aggregate costs (% of total national cost) $8.946 billion (2.6%) $343.9 billion (100%)
Data Source: AHRQ, Center for Delivery, Organization, and Markets, Healthcare Cost and Utilization project, Nationwide Inpatient Sample, 2007.
Figure 3. U.S. Hospitalizations in 2007
Number of hospital stays based on all-listed procedures; knee arthroplasty discharges based primary ICD-9 procedure code of 80-84, 81.54 or 81.55
Source: HCUPnet, Accessed 1/25/2010 at
7
and surgical factors.[19] In addition to functional improvements resulting from knee arthroplasty, the rate of complications is very low; overall, mortality estimates range from 0.3% to 0.7%, with some variation by demographic group.[22, 32-34]
Multiple studies have found that the long-term benefit and implant durability are greater in older patients, perhaps because of lower levels of postoperative physical activity.[35-38] Richmond notes that “high-impact activities are deleterious after joint replacement
arthroplasty and may lead to precocious failure of the implant through wear of the polyethylene and potential loosening of the prosthesis.”[27] On the other hand, risk of
mortality and surgical complications have been shown to increase with age following knee arthroplasty, likely due to more preoperative comorbidities.[39-41]
Similarly, the long-term benefit of a knee prosthesis is lower [36] and risk of mortality [40] or surgical complication [41] is slightly higher for men than for women undergoing knee
arthroplasty. In a study of more than four million discharges between 1990 and 2004, Memtsoudis et al. found men had 10% higher risk of mortality and higher risk of surgical complications associated with knee arthroplasty, including cardiac complication and pulmonary embolism, than did women.[41]
8
Several studies have shown that complication rates for knee arthroplasty are inversely related to hospital and surgeon knee arthroplasty volume; facilities and/or providers
performing a few knee arthroplasties have worse outcomes. [40, 46-49] Similarly, a recent study by Cram showed that the incidence of surgical complications was lower in orthopedic specialty hospitals versus general hospitals.[50] Medicare patients undergoing total knee or hip replacement in orthopedic specialty hospitals had approximately 62% of the risk of complication or death observed in general hospitals.
1.1.3. Cost-Effectiveness of Knee Arthroplasty
Knee arthroplasty is also regarded as a cost-effective therapy for improving mobility and improving quality of life for patients, compared with no surgical intervention. Studies have shown that knee arthroplasty produces significant improvements in well-being at modest costs, though results can be difficult to interpret, due to the computational methods.[51-53] Using Medicare data, Lavernia et al estimate that knee arthroplasty costs at approximately $6,500 per “well-year”.[53] Alternately, a Finnish study by Rissanen et al. estimated the
9
Hawker et al. examined osteoarthritis-related health care expenditures among patients who did and did not receive joint replacement and found a statistically significant reduction in costs for patients who had surgery.[31] Revision arthroplasty, which is more costly due to higher incidence of complications, such as infection, and requires longer length of hospital stay, is not considered in most cost analyses. The costs of revision surgery is estimated conservatively at $36,848 (2006).[55] Several studies [55-59] suggest that the direct costs of revision knee arthroplasty are not fully reimbursed in all facilities and that the estimates of costs may therefore be skewed to the low end.
1.2. Study Purpose and Specific Aims
This dissertation explores the influence of population and provider characteristics on the geographic variation of knee replacement utilization in North Carolina between 2000 and 2009. The theoretical motivation for the study follows Wennberg’s observations of regional variation, incorporating some elements of classic sociological theory including Andersen’s
Behavioral Model of Healthcare Utilization [60, 61], and economic theory which emphasizes the effect of providers and capacity on utilization. The study takes a multidisciplinary
approach to examining use of a specific elective surgical procedure. A secondary goal of the study is to describe how the characteristics of patients, providers, and institutions for knee arthroplasty have changed over time in North Carolina. Specifically, this dissertation’s
four research questions include three essentially descriptive queries and one analytic question:
10
1. Have there been changes in the characteristics of patients receiving knee replacement surgery during the study period?
2. Have there been changes in the supply, distribution, and scope of practice of orthopedic surgeons in North Carolina during the study period?
3. Have there been changes in the institutions that provide orthopedic surgical service, particularly knee arthroplasty, during the study period?
4. What factors are associated with higher or lower utilization of knee arthroplasty in North Carolina counties? Does the variation exist because of the ecological factors suggested by Andersen or does it reflect a variation in inputs as suggested by Wennberg?
1.3. Relevance
11
Investigating the factors associated with geographic variation in utilization of knee
arthroplasty allows us to answer the question about whether particular areas may be under- or over-utilizing care, and to develop workforce distribution strategies.
Information regarding the epidemiology and utilization trends for knee replacement can be useful to help us know if knee arthroplasty can be prevented through modifiable risk factors, including obesity, joint injury and occupational risk. Public health policies or programs may be designed to increase participation in physical activity, improve nutrition, or focus
occupational therapy in order to reduce the incidence of knee osteoarthritis and joint injury which lead to knee arthroplasty. Such interventions have potential to reduce the
considerable and growing economic burden of knee arthroplasty by preventing the underlying diseases.[64, 65]
Further, the increasing utilization of knee arthroplasty procedures poses important
12
From a public health, economic, and health planning perspective, understanding the patterns of medical care utilization and its causes are important goals. Such information permits appropriate allocation and distribution of resources such as healthcare workers, reimbursement rates, technology, and physical capacity or infrastructure. Further, it
provides policymakers and health planners with insights to prevent illness, improve medical outcomes, and promote efficient use of limited resources. The projected imbalance
between demand and capacity requires a focus on either increasing provider supply through training expansions or reducing demand for services by focusing on preventing severe knee osteoarthritis in the population. The Accreditation Council for Graduate Medical Education (ACGME) accredited positions in orthopedic surgery recently expanded by approximately 9.3%; however, more positions may be necessary to meet future demand if current projections of demand for orthopedic procedures are accurate [67]. Further, alternative workforce strategies may be necessary to address the shortage in the short-term, as training delays the entry of these new providers into the workforce.
Previous studies have examined risk factors for knee arthroplasty and documented an increase; however, few studies have empirically explored the determinants driving demand and none have studied the trends in North Carolina, a state whose population
characteristics are much like the rest of the U.S. population. Literature on other types of medical care utilization provides useful theories to test in the case of knee arthroplasty rates, including a prominent theory that posits that medical care providers “induce” demand
13
small area variation, but also offers evidence for the purpose of policy development around disease prevention and healthcare workforce planning.
1.4. Conceptual Framework
Regional variation is a phenomenon in which neighboring geographic areas exhibit very different utilization rates for healthcare services [5]. Over the past three decades, studies of regional variation have identified conditions and procedures for which there are significant differences in the rate of hospitalization among communities that are otherwise similar with respect to population characteristics. Knee replacement surgery is among those procedures that have shown high variability in utilization across space and time, but little evidence exists to explain the variation. [4, 74] The theoretical and methodological motivation for this
dissertation is derived from this body of work on regional variation in healthcare utilization, much of it led by Wennberg and colleagues at Dartmouth.
In fact, studies of regional variation have generally ignored the influence of community and population characteristics on utilization, and attributed the variation to the treatment choices of physicians. While most health services researchers acknowledge that provider decisions contribute to variation in patterns of healthcare use, a common criticism of these studies is that they fail to empirically demonstrate the relationship. A major objective of this study is to incorporate additional explanatory variables into a model of utilization for knee arthroplasty, including population and local provider characteristics. This study takes a multidisciplinary approach in identifying the determinants of utilization for knee arthroplasty based on classic models of medical care use (Figure 5). Figure 5 represents the distillation of several
14
of Healthcare Utilization, by Andersen and Newman, and the economic theory of provider-induced demand are drawn upon to help build the analytical model.
1.5. Regional Variation
With its findings of significant variation in the rates of tonsillectomies, appendectomies, cholecystectomies, hysterectomies, and other surgical procedures, Wennberg and Gittlesohn’s 1973 study of small area variation in Vermont ignited a strong and lasting
interest in studying geographic variation of healthcare utilization.[5] Numerous studies by Wennberg and others have followed over the past four decades, showing similar patterns of variation in other states and regions, and between countries [4, 74-81]. Various theories arise from these studies over what causes the variation, most prominently Wennberg’s belief
that there is inconsistency in medical decision making over and above the variation in need. Other factors that have been shown to be associated with variation in utilization include local healthcare resources such as hospital beds or outpatient surgery centers, [6, 78] and
physician supply, [68, 69] discussed in greater detail in the following section. Other studies emphasize the need to estimate the effect of socioeconomic population characteristics such as education, poverty, income, unemployment, and others.[75, 82-85] These studies are the foundation for this dissertation’s methodological approach of knee arthroplasty utilization
in North Carolina, which focuses on the effect of population and provider variables which have been omitted in previous studies of the procedure.
15
P
S1 S2
D2
D1
Q
Figure 4. Demand Shifting
Physicians and healthcare providers have a complicated influence on patient utilization of medical services. A physician’s responsibility to assess illness and then treat or refer
patients for care creates a dual role as both supplier of services and agent for the patient, [69, 72, 86] which may consequently create a shift in the demand for services. Generally, it is believed that physician influence on demand shifts the demand curve outward (from D1 to D2 in Figure 4) increasing utilization so as to optimize the physicians’ preferred level of services and related income. In markets with high provider to population ratios, the demand shift may be inward so as to contract utilization and associated physician workload.
However, in the case of surgical services, demand is rarely expected to be suppressed because most markets are thought to have excess capacity among practicing surgeons.[69] This theory is commonly called supplier-induced demand, and it posits that the utilization of healthcare services is inflated due to the economic motivations of providers.
16
Like Cromwell and Mitchell, more recent studies have found evidence that provider-induced demand is greatest for services that are more discretionary, such as elective surgery and diagnostic procedures.[73, 87-90]
Other classic studies of provider-induced demand focus on the relationship between
provider density and income, [70, 71] finding evidence of a positive relationship between the two. That is, output per provider in areas with greater physician density is higher as
physicians seek to increase their income. Using an alternative approach to estimate induced demand, two other studies [72, 91] compared utilization rates of the general population with that of physicians and their spouses. Both discovered higher rates of healthcare utilization among the more informed population, lending support to the theory of provider-induced demand.
“The mechanisms by which physicians are hypothesized to be able to increase both fees
and volume of services in the presence of an increasing manpower supply vary, but taken together they represent a belief in the theory of demand inducement.”[73] Still, non-believers
are plentiful. Many of the classic studies, especially those by Fuchs and Cromwell and Mitchell, have been criticized for methodological limitations including omitted variable bias and inconsistency in the construction of variables for geographic areas – particularly related
17
More recently, a study by Lu et al. measured the influence of new orthopedic surgery programs on increasing Medicare utilization of lower extremity arthroplasty, finding no evidence of an association and therefore concluding there was no provider-induced demand. However, the methodological approach of this study included many opportunities for bias including the composition of comparison groups, construction of independent variables, and choice of level of analysis [94]. This dissertation draws upon the methodological improvements of these studies in examining the relationship between utilization of knee replacement surgery and provider supply.
Despite criticism, the plausibility of provider-induced demand offers continuing appeal for researchers interested in explaining geographic variation in healthcare utilization. Improving upon past methodologies and using new datasets, the theory remains a prominent
framework for explaining a portion of healthcare utilization. While acknowledging
disagreements and challenges, Green notes that “looking for the effects of availability on the
utilization of medical resources is similar to tracking the abominable snowman. The
evidence is fragmentary, and though the search is exciting and fraught with danger, no one is quite sure what to do were the beast ever confronted face to face.” [95]
In pursuit of an estimate of surgeon-induced demand, it is important to reiterate that a finding of its existence does not necessarily imply that there is unnecessary care. In fact, both empirical evidence and anecdotes suggest that some beneficial treatments, such as knee replacement, may actually be underutilized for certain populations.[50, 96] While findings from the Dartmouth group on small-area variation are interpreted to suggest waste and inappropriate care, there is limited justification for such conclusions. Dr. Schlicke’s 1978 comments that “much has been made of the fact that Americans have twice as many
18
in one country or too few in the other” are important to consider.[97] More recently,
research has suggested that unwarranted geographic variation is less extensive than
believed and that some research concluding inefficiency related to regional variation may be based on flawed methods.[98] However, estimating the various influences on healthcare utilization provides a more clear understanding of the policy levers available to achieve the optimal level of care.
1.7. Andersen’s Behavioral Model of Healthcare Utilization
A much cited classic theoretical model of healthcare utilization from the 1960s is that of Ronald Andersen called the Behavioral Model of Healthcare Utilization. This framework depicts the use of medical care as a function of individual, societal, and institutional factors. An important improvement on the original model was published in 1973 by Andersen and Newman,[61] in which they further explain utilization as dependent on the type of health service in question. That is, the relative influence of factors such as age, education, income, and others will vary in predicting utilization of therapeutic treatments, such as knee
arthroplasty, in the present context, versus preventive, diagnostic, or custodial care. In their model, utilization of secondary care, which returns an individual to the state of functioning prior to the illness or injury, depends in part on the nature and structure of local healthcare resources and community characteristics. This dissertation incorporates characteristics of the county’s population, focusing specifically on the effect of the local physician and
20
2. Literature Review
2.1. Overview of Literature Review
Literature on knee replacement surgery provides some insight to longitudinal trends in utilization by identifying the main individual risk factors for disease that leads to knee arthroplasty. Studies have identified variation in the use of knee arthroplasty; however, few have examined the correlates of utilization at a population level, and the potential
association with characteristics of the local healthcare market has been virtually ignored. This chapter summarizes what is known about knee arthroplasty utilization through published literature.
2.2. Utilization Trends and Demographic Profile of Patients
Changes in the rate of knee replacement surgery in the United States have been well documented since the 1980s. Data have consistently shown an increase in knee replacement surgery, though the magnitude of growth varies according to the study
population, geographic area, and time period studied. A common conclusion is that growth in knee arthroplasty has been steadily if not rapidly increasing and that the increase is disproportionate to overall utilization of healthcare services or other surgical procedures.
One of the earliest studies of knee replacement trends by Katz [99] et al. found the rate of knee replacement surgery among Medicare beneficiaries surgery doubled over a five year
21
period between 1985 and 1990. An analysis of the National Hospital Discharge Survey (NHDS) by Kurtz[100] showed a threefold increase in knee replacement surgery throughout the 1990s and early 2000s. More recent studies expand the scope of examination to include other payers through Healthcare Cost and Utilization Project (HCUP) discharge databases, which show more modest though still substantial increases in the general population. Using HCUP Nationwide Inpatient Sample (NIS) discharge data, Kim et al. [62] found a 50% increase in knee replacement surgery between 1997 and 2004. Similarly, Merrill [1] found an increase of 69% in the procedure in the U.S between 1997 and 2005 using NIS. By 2005, more than 555,800 inpatient knee replacements had been performed, which corresponds to a utilization rate of 187.5 procedures per 100,000 persons, using U.S. Census Bureau population estimates. Compared to other surgical procedures, growth in knee replacement is the second fastest growing reason for hospitalization for orthopedic treatment in 2005.[101] Future growth in the procedure rate for knee arthroplasty is estimated to be 673% by 2030.[102]
Regional and state analyses have also found similar patterns of growth in knee replacement surgery during the same timeframe. Mehrotra et al. [103] found the age-adjusted rate of knee replacement in Wisconsin, using the state’s inpatient discharge data, increased by
81.5% for persons older than 44 between 1990 and 2000. Data from a large prepaid health plan in Southern California show incidence rates for knee replacement increasing by
approximately 5% annually between 1995 and 2004.[32]
Comparison of knee arthroplasty rates in the U.S. to other developed countries is difficult because of differences in data, study populations, estimates of “at risk” populations,
22
interpreting utilization rates within the U.S. For example, studies of the Swedish Knee Arthroplasty Register indicate a five-fold increase in utilization rates between the 1980s and 1990s, mostly in the population over 65 years old. [104] Still, the utilization rate in Sweden was 63 per 100,000 persons in 1996-1997, which is approximately half the rate in the U.S. for 1997 according to data from AHRQ (Figure 3). Australia’s utilization for knee
arthroplasty was 76.8 per 100,000 persons in 1998, and the volume of knee arthroplasty cases increased by 42.8% between 1994-1998[105] Similarly, the total volume of knee replacements more than doubled in England during the 1990s, to an incidence rate of 70.7 per 100,000 women and 62.1 per 100,000 men in 2000.[106] These studies demonstrate that utilization of knee arthroplasty is increasing rapidly outside of the United States, but that our rate of use is still much higher than in other countries.
2.3. Risk Factors for Knee Arthroplasty
The literature on knee arthroplasty includes many studies which examine variation in utilization of the procedure by patient characteristics, most notably age, gender, race, and health status characteristics including obesity. A recent meta-analysis of risk factors for onset of knee osteoarthritis in older adults identifies additional modifiable risk factors
including previous knee injury, smoking, occupational activities, and physical activity [107]. For many patient characteristics, there appears to be a difference in utilization despite similarity in the prevalence of underlying clinical causes.
23
population, Mahomed et al.[33] found the highest rates of knee arthroplasty in the 75-79 year old age group and lowest among those over 90 years. Similarly, Katz et al.[99] found a higher risk of knee replacement associated with the age group including 70-84 among Medicare enrollees, with reduced risk after 85 years of age. Dixon’s study in the U.K. also
found that being between the ages of 70-74 was one of the strongest predictors of having a knee arthroplasty.[106] Kurtz found knee arthroplasty utilization higher in the age group 65-74 than in 45-64, but discovered that the largest increase in utilization between 1990-2002 was for those under 65 years.[100]
This finding has been corroborated by other work, including a study by Jain which found that though most knee arthroplasties were performed on older patients and most of the increase in the study period was for older age groups, there was a “rapid increase in knee
arthroplasty rates among younger populations (40-49 and 50-59) between 1990-2000”.[108]
Using NIS data, Kim found that the rate of increase in knee arthroplasty among persons age 45-64 was 83% compared with 38% in the 65-84 year old group.[62] In Wisconsin,
Mehrotra observed a decline in the average age of knee replacement during the 1990s by more than ten years, from 79.6 to 68.5 years, and found that the youngest age group (45-49 years) experienced the greatest increase in knee replacements.[103] Khatod also found that the greatest rates of increase for knee arthroplasty utilization were among individuals younger than 65 in Southern California.[32] Abroad, utilization of knee arthroplasty among younger patients is also increasing at a similarly rapid rate. A recent study of the Swedish Knee Arthroplasty Register found the rate of total knee replacement surgery in patients younger than 55 increased fivefold between 1998 and 2007, and between 2002 and 2007 Australia reported a 40% increase in utilization for patients under 55 [109, 110].
24
replacement surgeries. Between 1990-2000, Jain found that women accounted for approximately 63% of knee arthroplasties in the U.S. according to the National Inpatient Survey discharge data.[108] Also using NIS data but for a later time period, 1997-2004, Kim found that between 57% to 64% of knee replacements were for women.[62] Analyses of single states or regions have found consistent patterns. Mehrotra found that women
accounted for approximately 60% of all knee replacement discharges in Wisconsin between 1990-2000.[103] In Southern California, women accounted for 61% of knee replacements between 1995-2004.[32] Within the Medicare population, Katz found that knee
replacements were twice as likely for women as for men.[99] A separate study of Medicare data by Mahomed found nearly two-thirds of all primary knee replacements were for
females[33]. Procedure rates among women in every race group were higher in Skinner’s
study using Medicare data, though the disparity between men and women was most pronounced among minorities.[111]
Several studies have investigated factors underlying the disproportionate utilization of knee arthroplasty among women. A population-based study by Hawker found that, among patients with identified knee osteoarthritis, knee replacement was underutilized for both genders, but was recommended significantly less often for women than for men.[112] The potential need for arthroplasty, determined by scored responses to health assessments and radiographic examination, was found to be three times as great for women as men. Further, the study showed that women were less likely to have discussed arthroplasty with their physician, suggesting the possibility of gender differences in clinical recommendations for knee arthroplasty. The latter issue was further examined in Borkhoff’s study of 71
physicians’ clinical decision making, which also identified underutilization of knee
25
recommended for knee arthroplasty.Minorities have also been found to have a lower likelihood of undergoing a knee
replacement.[33, 99, 108, 111, 114-116] In a study of Medicare enrollees, Katz estimated the odds of having knee arthroplasty were 1.5 times higher for whites than for blacks.[99] Similarly, Mahomed found the risk ratio for knee arthroplasty among black Medicare enrollees was 0.73 as compared to whites [33] and a study of veterans by Jones had a nearly identical finding of lower odds among blacks.[115] Also consistent with these findings, Wilson calculated a lower likelihood of having knee arthroplasty among blacks, which persisted after controlling for insurance status, economic status, and age. Skinner’s
analysis of Medicare beneficiaries also found that knee arthroplasty was more common among whites than other groups;[111] blacks had the lowest rate of utilization among the three groups (whites, blacks, Hispanics) for both women and men. This study, however, showed that racial variation in utilization was more pronounced among men than women. In 29/30 Hospital Referral Regions (HRRs)3, rates of knee arthroplasty were significantly lower for black men than White or Hispanic men; however, rates for white women were only significantly higher in 15/30 HRRs than for black or Hispanic women. A recent study by Steel analyzed data from the Health and Retirement Study, finding, among other factors, that being black is associated with lower likelihood of receiving joint replacement surgery among people deemed potentially in need of one; this analysis stands apart from many in that the denominator for incidence is the population with osteoarthritis.[117]
The potential causes of ethnic or racial variation in utilization of knee arthroplasty are many; however several recent studies show evidence of differences in knowledge, attitudes,
3
26
preferences, and familiarity about the procedure. A survey by Ibrahim of 600 veterans in the late 1990s revealed race-related differences in familiarity or knowledge about knee
replacement.[118] Similarly, a small study by Suarez-Almazor in a Houston, TX outpatient clinic found that minority patients with knee osteoarthritis were less familiar with the surgical treatment option of knee arthroplasty and less likely to have considered having one, even after controlling for severity of osteoarthritis.[119] Chang also conducted focus groups, observing that blacks were more likely to have concerns about their candidacy for knee arthroplasty and the overall clinical decision making process, signaling physician
mistrust.[120] A less conclusive focus group study found that participants of different racial or ethnic backgrounds had dissimilar perspectives on pain and limitations associated with knee osteoarthritis, trust in their providers, and concerns about cost; however, authors stopped short of concluding patterns existed on the basis of race or ethnicity.[121] Most recently, Hausmann et al. found that blacks were less likely to receive a physician
recommendation for joint replacement in the VA system, however, the disparity diminished when patient preferences regarding the procedure were incorporated [122]. This study suggests that patient preferences may have more influence on observed disparities in utilization of knee arthroplasty than previously thought.
27
Several of the earliest studies of the connection between obesity and knee osteoarthritis were conducted by Felson and colleagues in the late 1980s.[123] These studies found a positive association between weight and knee osteoarthritis, which is stronger among women. Data from the Framingham study of cardiovascular disease demonstrated similar findings of an association between obesity and risk of osteoarthritis using weight level; the risk was higher for women. [123] Using National Health and Nutrition Examination Survey (NHANES) data, Anderson and Felson found that obese women had four times the risk of osteoarthritis of women with BMI under 25, while BMI greater than 30 was associated with a relative risk of 4.8 compared with men who were neither obese nor overweight.[123] Also using NHES, Dillon et al. examined the correlates of osteoarthritis, finding strong
associations between radiographic knee osteoarthritis and obesity (BMI greater than or equal to 30); other significant factors included being over 70 years old, female, and
black.[124] A study by Davis in the late 1980s found evidence in examining NHANES data to suggest that the differential prevalence of obesity in men and women contributes to the differences in osteoarthritis of the knee between men and women.[125] A recent study by Niu of 2,623 subjects in Iowa and Alabama found a positive association between BMI and incident knee osteoarthritis.[126]
Several small case-control studies have also identified an association between knee osteoarthritis and obesity. In Wendelboe’s 2003 case-control study in a Utah hospital, BMI
28
Numerous foreign studies have found similar associations between knee osteoarthritis and obesity. In Iceland, Franklin[129] found positive associations between high BMI and knee osteoarthritis, as did numerous studies in the U.K.,[130-133] Germany,[134] and the Netherlands.[135] The strongest association between obesity and knee replacement was observed in a recent study by Liu, where middle-aged women in the heaviest group had more than ten times the relative risk of knee replacement as those in the lightest weight group; these results did not vary significantly when controlling for confounding factors.[131] A more modest four-fold increase in risk for knee osteoarthritis was observed in Manek’s
2003 study of twins in the U.K, which persisted after controlling for genetic factors.[133] Spector found that the risk of knee osteoarthritis increased by 6.5% for every five kilogram increase in weight [132] Sturmer found that the association between weight and knee osteoarthritis was stronger after controlling for confounding factors such as smoking and age; the study’s findings of no association with osteoarthritis of other joints offer evidence to refute a potential metabolic process in favor of mechanical joint stress.[134] Reijman’s
Rotterdam study found similar evidence of an association between obesity and knee but not hip osteoarthritis.[135]
A number of studies have examined the strength of various anthropometric measures in relation to osteoarthritis risk. Abbate’s study of women in Johnston County, NC, found that
all obesity measures were associated with knee osteoarthritis, but that BMI was the
strongest predictor.[57] Two other foreign studies also assessed similar obesity measures, similarly finding that BMI showed the strongest association, along with body weight in Wang’s study.[136, 137] Collectively, these studies establish a compelling connection
29
2.4. Geographic Variation and Induced Demand for Knee Replacement Surgery
The importance of examining area variation in healthcare utilization, particularly for elective surgical interventions like knee replacement, has been frequently and contentiously
discussed in the context of cost containment and appropriate provision of care. Although high use does not necessarily mean inappropriate use, the variation between adjacent or similar areas is of considerable interest in the quest to attain the optimum and most efficient level of care.
The geographic variation of a number of surgical procedures, such as CABG, tonsillectomy, and appendectomy, has been studied extensively by Dartmouth Atlas researchers and others. Yet, only a handful of studies have examined geographic variation in utilization for knee arthroplasty, one of the most common orthopedic surgical procedures in the U.S.; only a few of those take a multivariate approach to explaining the variation.
One of the most relevant studies for this dissertation was conducted by Zhou et al. and published 1996.[138] In this study authors conducted a two-stage regression analysis using hierarchical data, including Medicare claims data, to model variation in knee replacement rates nationally and within healthcare regions. Findings suggested that income, poverty, and total and orthopedic provider supply are all strongly associated with lower knee revision procedure rates, while hospital beds had a positive association. Rural areas also had higher rates of knee replacement than urban; this finding is consistent with other studies and is likely due to a higher prevalence of osteoarthritis among the areas’ large elderly
populations.[139] Another study of regional variation in knee arthroplasty in the U.S. using 1988 Medicare data by Peterson et al., found low correlation between states’ knee
30
relationship with population density.[140] Also using Medicare data, Skinner found
evidence of patient differences between HRRs that explained part of the variation observed in knee arthroplasty utilization among racial groups including all Hispanics and black
women.[111] While these studies offer insight for examining regional variation in knee arthroplasty, they do not make use of spatial epidemiological techniques to assess the geography of variation. Furthermore, the results do not explain substantial increases in utilization observed in recent years as these studies preceded observed growth.
Foreign studies of geographic variation in knee arthroplasty have also yielded important results. A comparison of two regions in Canada by Hawker found high utilization of knee arthroplasty in areas with lower potential need (measured as underlying illness) and willingness to have the procedure.[96] A small study involving medical record auditing in high and low joint arthroplasty areas in Ontario by van Walraven examined whether geographic variation of utilization was explained by inappropriate provision of surgery through medical chart review. [141] Results detected no difference in the provision of inappropriate surgical care in high rate versus low rate areas. Although this study is limited by the number of cases reviewed, and suffers poor generalizeability for the U.S. because of differences between the two countries’ population access to care, its value is in directly
examining the issue most small-area variation studies strive to examine through proxies: inappropriate care.
2.5. Physician Practice Style in Knee Arthroplasty
31
recommendations for each type of treatment for knee osteoarthritis has not been studied in the U.S. However, a few Canadian studies have studied this component of regional
variation.[141-144] Wright’s 1999 study of area variation in knee replacement surgery is
particularly relevant to this proposed analysis despite the fact that it analyzes Canadian trends and data.[145] Examining county-level knee arthroplasty procedures in Ontario, Wright examined the relationship between knee replacement rates and physician and population characteristics, including provider’s enthusiasm for the procedure. The study
32
3. Research Design
3.1. Overview of Methods
To study longitudinal and geographic trends in the utilization of knee replacement surgery, this dissertation analyzes North Carolina inpatient discharge data between 2000 and 2009, employing spatial regression techniques to identify provider and population characteristics associated with variation in use of knee replacement surgery in North Carolina counties. Descriptive analyses are conducted first, to provide a broad understanding of the trends in patient characteristics for knee arthroplasty discharges, as well as a profile of the physicians and institutions performing knee arthroplasty. Knee arthroplasty discharges were then aggregated by county to produce age-adjusted knee arthroplasty utilization rates for
multivariate analyses. County aggregated data were merged with other datasets describing population characteristics and healthcare resources for each year between 2000 and 2009. Ordinary Least Squares (OLS) and spatial lag regression techniques, were then used to estimate the effect of county-level socio-demographic characteristics on utilization rates among North Carolina counties. Data availability and constraints of spatial regression methodology necessitated cross sectional analysis, using 2008 data, for the main multivariate analysis of utilization rates. To explore longitudinal variation in utilization of TKA, regression techniques were also used to analyze of the change in knee arthroplasty utilization between 2004-2008 as a function of change in covariates during the same period.
33
3.2. Sample and Data File StructureInpatient discharges with an ICD-9 procedure code for total knee arthroplasty, 81.54, were extracted from the NC Inpatient Discharge database for the years 2000-20094. Discharges were excluded if the institution was a psychiatric, rehabilitation or drug treatment facility and if the record contained an ICD-9 code for a known contraindication, V64.x patient refusal or other contraindication, among any of the diagnosis codes. A total of 1,649 discharges were excluded according to these criteria, leaving a total of 132,499 discharges with a knee arthroplasty procedure during the period Jan 1 2000 through December 31 2009. These discharges were summarized and extracted, creating four separate datasets for analysis: 1) a discharge-level file for examination of patient characteristics and the medical encounter; 2) a provider-level file, whereby the annual number of knee arthroplasty discharges are
summarized for each orthopedic surgeon for analysis of trends in the physicians performing knee arthroplasty; 3) a hospital-level file, whereby the annual number of knee arthroplasty discharges are summarized for each hospital and analyzed for trends in the institutions where knee arthroplasties are performed; and 4) a county-level file, whereby an age-adjusted rate of knee arthroplasty utilization is calculated using patient residence for every North Carolina county, for multivariate and spatial analysis of factors associated with variation in utilization of the procedure. Production of these files was facilitated by the availability of key variables in the discharge record including the facility ID, the attending physician ID (which was either a national provider identification number (NPI) or a Uniform Provider Identification Number (UPIN)), and Federal Information Processing Standard (FIPS) county code of the patient’s residence. These variables allowed linkage to external
data, including hospital data from the NC Division of Healthcare Services Regulation using
4 North Carolina Inpatient Discharge databases acquired from Cecil G. Sheps Center for Health Services Research at the University of North Carolina at Chapel Hill.
34
the facility ID, the NC Physician Licensure Data using the attending physician ID, and
various sources of county data using the patient’s FIPS county code as detailed in Figure 6.
Because the physician licensure files, maintained by the Cecil G. Sheps Center for Health Services Research under contract with the North Carolina Medical Board, do not currently contain UPINs or NPIs, linking the discharges to provider data required the construction of a crosswalk file. The crosswalk file was constructed by manually searching for two online national provider databases using the UPINs and NPIs contained in the discharge record for knee arthroplasty cases.5,6 Successful searches in these databases returned the full name, current and historical UPINs and NPIs, primary specialty, current practice location, and state license numbers for the provider. Using the name and, when available, North Carolina state license number, a search was then performed in the North Carolina licensure data files to verify the information and confirm a match. Erroneous entry of provider IDs on the
5 The National Provider Indntifier Database NPI Registry Search: www.hmedata.com/npi.asp 6 Nebo Systems eCare Online NPI and UPIN Search: www.ecare.com /
Figure 6. Sample and File Structure
NC Inpatient Discharges *Excl. Normal Newborns and Discharges in Rehab, Psych
or Drug Treatment Hospitals (N=13,708,389)
Knee Arthroplasty Surgery
(N= 132,499)
ORTHO SURGEONS
(N=620)
Merged by f acility ID (FAC) to DHSR data on
location, bed size, total TKA volume, and hospital type. Only hospitals perf orming knee arthroplasty analyzed.
Merged by attending physician’s UPIN/NPI to NC Physician Licensure Files containing specialty (1º and 2º), gender, age, practice
location, clinical hours, practice type. Only orthopedic surgeons analyzed.
HOSPITALS (N=95)
COUNTIES (N=100)
Merged by FIPS to NC OSBM, ARF, CPS, CDC, and other county-summarized data
35
discharges prevented identification of some physicians, as detailed later in this chapter.
3.3. Unit of Analysis and Geography
The main geographic unit of analysis for this dissertation is the county. Although county boundaries may not necessarily affect preferences in how a population uses healthcare services, counties are a conventional unit of analysis in health services research and planning because of the availability of county aggregated data and the convenience of distributing resources to an organized government. In North Carolina, county governments serve an important role for local populations, as they are tasked with the responsibility for ensuring availability of a variety of human services including public health.[146, 147] Counties have the authority to collect revenue from residents and are the recipients of state and federal funding for many public health programs including public health departments (G.S. 130A-34), and therefore counties are an interesting unit of analysis with regard to the health and healthcare use of residents within a county. From a methodological perspective, North Carolina counties are a good unit of analysis because of their relatively uniform size, compared with counties in many western states, and because many state and national datasets are available at the county level. Choice of county as a geographic unit may introduce some bias in that the service area for different types of service, namely primary care versus orthopedic surgical care, varies; this limitation will be discussed in more detail throughout the paper.
County-level age adjusted knee arthroplasty utilization rates are summarized from individual inpatient discharges for each year in the analysis, based on patient residence.
36
information for every inpatient encounter in a short-term acute care non-federal hospital in North Carolina, thus representing the actual volume of utilization during the study period with the exception of those at military, veterans’, or out-of-state hospitals. Ten years of data (2000 – 2009) are summarized for each of the 100 North Carolina counties, and merged
with other county data for the same years.
3.4. Data Sources
Data are drawn from multiple secondary datasets for various levels of analysis. Procedure utilization data, the focus of this analysis, are drawn from the North Carolina Discharge Databases. Supporting data are taken from the North Carolina Medical Board Physician Licensure the North Carolina Department of Health and Human Services Division of Health Service Regulation Hospital Data, the Area Resource File, Nielsen Claritas® data, The Current Population Survey data, and the Centers for Disease Control’s county summary of obesity from the Behavioral Risk Factor Surveillance System. Each source of data is
described in the following section, along with details regarding the development of measures and methods of analysis.
3.4.1. NC Discharge Databases
Discharge data are retrieved from uniform claim forms used by institutions to bill payers, the UB-04 and UB-92 for hospitals and CMS 1500 for ambulatory surgery centers. Annual summary files contain a record for every discharge in the state’s non-federal, short-stay