Sharif University of Technology
Scientia IranicaTransactions A: Civil Engineering www.scientiairanica.com
Multi-objective optimization of structures using
charged system search
A. Kaveh
and M.S. Massoudi
Centre of Excellence for Fundamental Studies in Structural Engineering, Iran University of Science and Technology, Narmak, Tehran, P.O. Box 16846-13114, Iran.
Received 8 October 2013; received in revised form 6 January 2014; accepted 15 April 2014
KEYWORDS Multi-objective optimization; Charged system search;
Decision making; Pareto optimal; Size optimization.
Abstract. Many industrial problems are concerned with optimization of large and complex systems involving many criteria. Indeed, optimization problems encountered in practice are seldom mono-objective. In general, there are many conicting objectives to handle. This study introduces a new method for the solution of multi-objective optimization problems. Multi-objective optimization is utilized to nd the most suitable solution, which covers the requirements and demands of decision makers. The main goal of the resolution of a multi-objective problem is to obtain a Pareto optimal set and, consequently, the Pareto front. This method is based on the Charged System Search (CSS) algorithm, which is inspired by the Coulomb and Gauss laws of electrostatics in physics. In order to illustrate the eciency of the proposed method, numerical examples are solved and results are compared to show the ability of the CSS in nding optimal solutions.
© 2014 Sharif University of Technology. All rights reserved.
1. Introduction
In the last two decades, many ecient mono-objective optimization algorithms have been developed [1-7]. These algorithms search through possible feasible solu-tions, and ultimately identify the best results. Multi-objective optimization techniques play an important role in engineering design, resource optimization, and many other elds. Their main purpose is to nd a set of best solutions from which a designer or decision maker can choose a solution to derive maximum benet from available resources. The various objectives of a multi-objective optimization problem often conict and/or compete with one another. In multi-criterion Decision Making (DM), no single solution can be termed as the optimum solution to the multiple conicting objectives, as a multi-objective optimization problem is amenable to a number of trade-o optimal solutions. For
*. Corresponding author. Tel.: +98 21 77240104; Fax: +98 21 77240398
E-mail address: [email protected] (A. Kaveh)
this purpose, multi-objective optimization generates a Pareto front, which is a set of non-dominated solutions for problems with more than one objective. The major goal of a multi-objective optimization algorithm is to generate a well-distributed true Pareto optimal front or surface.
Over the past decade, a number of Multi-Objective Evolutionary Algorithms (MOEAs) have been developed, such as the Non-dominated Sort-ing Genetic Algorithm (NSGA)-II [8], the Strength Pareto Evolutionary Algorithm (SPEA2) [9], the Pareto Archive Evolution Strategy (PAES) [10], Multi-Objective Particle Swarm Optimization (MOPSO) [11], and hybrid multi-objective optimization comprised of CSS and PSO [12].
In this paper, a new multi-objective optimization approach, based purely on the Charged System Search (CSS) algorithm, is introduced. The CSS is a pop-ulation based meta-heuristic optimization algorithm proposed recently by Kaveh and Talatahari [5,13,14]. In the CSS, each solution candidate is considered a charged sphere, called a Charged Particle (CP). The
electrical load of a CP is determined considering its tness. Each CP exerts an electrical force on all the others, according to the Coulomb and Gauss laws from electrostatics. Then, the new positions of all the CPs are calculated utilizing Newtonian mechanics, based on the acceleration produced by the electrical force, the previous velocity and the previous position of each CP. Many dierent structural optimization problems have been successfully solved by CSS [13,14].
In the present work, after a brief description of multi-objective optimization (MOP), the main con-cepts of the Charged System Search algorithm are provided. For better understanding of the MOPs, readers can refer to [15]. Then, the multi-objective charged system search algorithm is presented. A simple multi-criteria decision making process is also presented. Numerical examples are prepared to show the eciency and accuracy of the proposed method. Finally, the concluding remarks are provided.
2. Multi-objective optimization concepts Denition 1. Multi-objective optimization problem. A multi-objective optimization problem can be dened as:
MOP = 8 < :
min F (x) = (f1(x); f2(x); :::; fn(x))
S:C: x 2 S (1) where n 2 is the number of objectives, x = (x1; x2; :::; xk) is the vector representing the decision
variables, and S represents the set of feasible solutions associated with equality and inequality constraints and explicit bounds. F (x) = (f1(x); f2(x); :::; fn(x)) is the
vector of objectives to be optimized.
Denition 2. Pareto dominance. An objective vec-tor, u = (u1; u2; :::; un), is said to dominate v =
(v1; v2; :::; vn), denoted by u v, if and only if no
component of v is smaller than the corresponding component of u, and at least one component of u is strictly smaller, that is:
8i 2 f1; :::; ng : ui vi^ 9i 2 f1; :::; ng : ui< vi:
Denition 3. Pareto optimality. A solution, x2 S,
is Pareto optimal if for every x 2 S, F (x) does not dominate F (x), that is F (x) F (x).
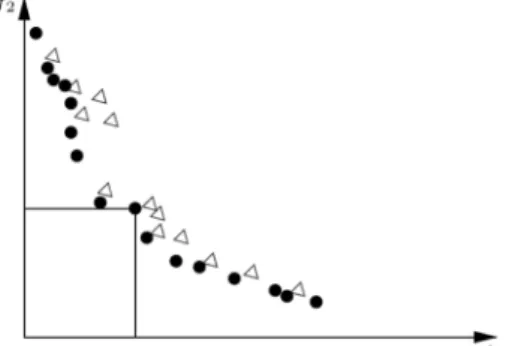
Graphically, solution xis Pareto optimal if there
is no other solution x such that point F (x) is in the dominance cone of F (x), which is the box dened
by F (x) with its projections on the axes and origin (Figure 1).
Denition 4. Pareto optimal set. For a given MOP(F; S), the Pareto optimal set is dened as P=
fx 2 S=@ x02 S; F (x0) F (x)g.
Figure 1. Pareto solution denoted by solid dots and dominate solution shown by triangles.
Denition 5. Pareto front. For a given MOP(F; S) and its Pareto optimal set, the Pareto front is dened as P F= fF (x); x 2 Pg.
The Pareto front is the image of the Pareto optimal set in the objective space. Obtaining the Pareto front of a MOP is the main goal of a multi-objective optimization. The Pareto front should have two desirable properties consisting of good convergence and diversity.
3. Charged system search algorithm
The charged system search contains a number of Charged Particles (CP), where each CP is treated as a charged sphere and can insert an electric force onto the others. The magnitude of this force for a CP located inside the sphere is proportional to the separation distance between the CPs, and, for a CP located outside the sphere, is inversely proportional to the square of the separation distance between the particles. The resultant forces persuade the CPs to move towards new locations, according to the motion laws of Newtonian mechanics. In the new positions, the magnitude and direction of the forces are reformed and this successive action is repeated until a terminating condition is satised. The pseudo-code for the CSS algorithm is summarized as follows:
Level 1: Initialization
Step 1. Initialization. The magnitude of charge for each CP is dened as:
qi =tbest tworstt(i) tworst i = 1; 2; :::; N; (2)
where tbest and tworst are the best and the worst tness of all the particles, respectively, t(i) represents the tness of agent i, and N is the total number of CPs. The separation distance, rij, between two
charged particles is dened as follows: rij = k(X kXi Xjk
i+ Xj)=2 Xbestk + "; (3)
CPs, respectively, Xbest is the position of the best
current CP, and " is a small positive number. The initial positions of CPs are determined randomly. Step 2. CP ranking. Considering the values of the tness function, sort the CPs in an increasing order. Step 3. CM creation. Store a number of the rst CPs and the values of their corresponding tness functions in the Charged Memory (CM).
Level 2: Search
Step 1. The probability of moving determination. Determine the probability of moving each CP towards the others using the following probability function:
pij =
8 < :
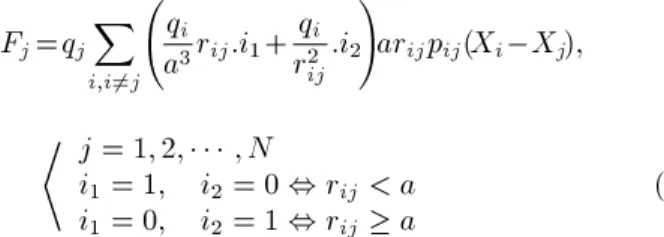
1 t(i) tbestt(j) t (i)>rand _ or t(j) > t(i) 0 otherwise (4) Step 2. Forces determination. Calculate the resultant force vector for each CP as:
Fj=qj
X
i;i6=j
qi
a3rij:i1+
qi
r2 ij:i2
!
arijpij(Xi Xj);
* j = 1;2; ;N
i1= 1; i2= 0 , rij < a
i1= 0; i2= 1 , rij a
(5)
where Fj is the resultant force acting on the jth CP.
arij is a new parameter, so-called the kind of force,
and determines the type of force, where +1 represents the attractive force and 1 denotes the repelling force, which is dened as:
arij=
8 < :
+1 w.p. kt
1 w.p. 1 kt
(6)
where \w.p." stands for \with the probability". In this algorithm, each CP is considered a charged sphere with radius a, which has a uniform volume charge density. Step 3. Solution construction. Move each CP to the new position and nd the velocities as:
Xj;new=randj1:ka:mFj j:t
2
+ randj2:kv:Vj;old:t + Xj;old; (7)
Vj;new= Xj;newtXj;old; (8)
where ka and kv are the acceleration and velocity
coecients, respectively. These can be obtained as
follows: If randj1 and randj2are two random numbers
uniformly distributed in the range [0,1], then: ka= 0:5 (1 + iter=itermax) ;
kv= 0:5 (1 iter=itermax) : (9)
Step 4. CP position correction. If each CP swerves o the predened bounds, correct its position using the harmony search-based handling approach, as described in [16].
Step 5. CP ranking. Considering the values of the tness function, sort the CPs in an ascending order. Step 6. CM updating. Include the better new vectors in the CM and exclude the worst ones from the CM. The number of substitutions is not constant. In primary iterations, many CM vectors may be excluded, but in later iterations (when the particles are converged to the optimal answer), this number is decreased. Level 3: Terminating criterion controlling Repeat the search level steps until a terminating criterion is satised.
Figure 2 shows the owchart of the CSS algo-rithm.
4. Multi-objective charged system search optimization algorithm
This algorithm is based on a pure Charged System Search (CSS) algorithm. For using this algorithm in a multi-objective optimization procedure, some changes are made and some additional steps are considered.
Figure 3. Dominance rank determination.
4.1. Algorithm
This algorithm consists of the following steps:
Step 1. Initialize the Charged Particles (CPs) mag-nitudes randomly. The initial speed of each particle is considered zero.
Step 2. Determine the magnitude of charge for each CP. For this purpose, the vector of objectives for each CP is calculated. Then, dominance rank of each CP is obtained. The dominance rank of a solution is related to the number of solutions in the population that dominates the considered solution. Figure 3 represents the procedure for determining the dominance rank of some solutions.
Diversity loss is observable in many meta-heuristics. To face the drawback related to the stagna-tion of a populastagna-tion, diversity must be maintained in the population. In general, the diversication method deteriorates solutions that have a high density in their neighborhoods. For solution i, distances dij between i
and other solutions of population j, are computed. The magnitude of charge for solution i, q(i), is calculated as:
q(i) =DR 1
i mi i 2 [1; 2; :::; N]; (10)
where DRi is the dominance rank of solution i and
mi=Pj2popsh(dij).
Sharing function, sh(dij), is dened as follows:
sh(dij) =
8 < :
1 dij
if dij<
0 otherwise (11) The constant represents the non-similarity threshold. The eectiveness of the sharing principle depends mainly on these two parameters that must be set carefully. Indeed, diversication becomes inecient
with a low value of , but, the convergence speed of the front becomes too small when this value is too high. Step 3. Now, CM should be created. For this purpose, the particles with dominance rank equal to 1 are selected as CM.
Step 4. While iter <= itermax, in other words, since a terminating criterion is not satised, repeat the following steps:
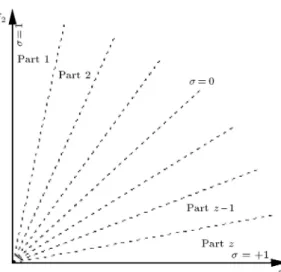
a) Determine the CMpart and CPpart. This means that the location of all the particles in the popula-tion and archive should be determined. It should be noted that the objective space is divided into z parts.
The space division method employed here is the same as the formulation introduced in [16]. According to this method, to each particle with F (x) = (f1(x); f2(x)), a value, i is dened as:
= f12 f22
f2
1 + f22: (12)
In case the objectives are not in the same range, for a two-objective optimization problem, can be calculated as below:
= m21 m22
m2 1+ m22;
m1= ff1 fmin1 max1+ fmin1;
m2= ff2 fmin2
max2 fmin2; (13)
where fmax1(fmin1) and fmax2(fmin2) are the
max-imum (minmax-imum) values of the rst and second objective of the particles in the population or archive, respectively. The schematic demonstration of dierent parts is shown in Figure 4.
b) Calculate the resultant force vector for each CP or CM particles as:
Fj=qj
X
i;i6=j
qi
a3rij:i1+
qi
r2 ij:i2
!
arijpij(Xi Xj);
8 < :
i1=1; i2=0 , rij< a
i1=0; i2=1 , rij a
(14)
where the probability of moving, pij, can be
calcu-lated according to Eq. (4). Fj is the resultant force
acting on the jth particle, and arij is the kind of
force, and determines the type of force explained in the previous sections. This parameter can be
Figure 4. Division of the objective space by assigning parameter to each particle.
calculated as follows: if i; j 2 CP or i; j 2 CM
) arij =
(
+1 if rand kt
1 if rand < 1 kt
if i 2 CP and j 2 CM ) arij = 1
This means: A CM particle is repeled by all CP particles if i 2 CM and j 2 CP ) arij = +1
This means: A CM particle attracts all CP particles
c) Compute the new position and velocity of each particle using Eqs. (7) and (8). When the current position of a particle is obtained, the following control should be performed:
if j 2 CP ) Part(Xnewj)
should be the same as Part(Xoldj);
otherwise Xnewj = Xoldj:
This means that each particle of CP should remain in its initial part up to the end of the optimization procedure, but CM particles can be moved to other parts.
d) Update the magnitude of each particle of CP and CM. Calculate their dominance ranks and select the new members of CM. This means that all particles which have a dominance rank equal to one should be selected as the new CM.
e) In this step, each particle of CM is compared with other particles of CM. In other words, the Euclidean distance between the objective vectors of all the particles in the CM is calculated, and, if this value is smaller than a positive predened value, one of them is eliminated. Using this approach, a crowding region cannot be generated in the objective space.
5. Multi-criteria decision making
The aim of solving multi-objective optimization prob-lems is to help a Decision Maker (DM) nd a Pareto solution that copes with his preferences. One of the fundamental questions in MOPs resolution is related to interaction between the problem solver and the decision maker. Indeed, the Pareto optimal solutions cannot be ranked globally. The role of the decision maker is to specify some extra information to select his favorite solution.
Many dierent approaches can be used for the decision making process [17]. A simple method for the multi-criteria decision making problem, so-called the multi-criteria tournament decision making method (MTDM), is described in [18]. This method provides the ranking of alternatives from best to worst, ac-cording to the preferences of a human decision maker. It has another positive aspect, involving few input parameters, just the importance weight of each crite-rion. This method introduces a function, R, capable of reecting the DM global interests. In order to nd this function, rst, each possible solution is compared to the others, considering only the ith-criterion. The pairwise comparisons are performed through the tournament function, Ti(a; A), which counts the ratio of times
alternative a wins the tournament against each other b solution from A. Hence, considering that a is a non-dominated point in the objective space, Ti(a; A) can be
stated as: Ti(a; A) =
X
8b2A;a6=b
ti(a; b)
(jAj 1); (15) where:
ti(a; b) =
(
1 if fi(b) fi(a) > 0
0 otherwise (16) The tournament function, Ti(a; A), assigns a score to
each solution in the Pareto front. The assigned score works as a performance measure, which provides a distinct ordering of the elements of A for each criterion. In order to generate the global ranking, taking into account all criteria and their respective weights, wi
(priority factors), the scores are aggregated into the global ranking function, R. The weighted geometric
mean, which is utilized by many dierent researchers, is considered the aggregation function in this study, as follows:
R(a) = (n
i=1Ti(a; A)wi)
1
n; (17)
where n is the number of objective functions. The priority weights must be specied by the DM in accordance with the following conditions:
wi> 0 and n
X
i=1
wi= 1: (18)
The ranking index, R(a), gives an idea of how much each alternative is preferred to the others. In other words: if R(a) > R(b), then, a is preferred to b, and when R(a) = R(b), then a is indierent to b.
6. Numerical examples
In this section, some numerical results are presented in order to show the performance of the pure CSS algorithm in multi-objective optimization problems. The algorithms are coded in MATLAB and, in order to handle the constraints, a penalty approach is utilized. When the constraints are in the range of allowable limits, the penalty is zero. Otherwise, the amount of penalty is obtained by dividing the violation of allowable limit by the limit itself. For the examples presented in this paper, the CSS algorithm parameters are set as follows: ka= 2, kv = 2, the number of agents
is taken as 100, the maximum number of iterations is set to 100, a = 1, T = 1 and kt= 0:5. The algorithm
is run with an archive size of 100. In this paper, a real coded NSGA-II is utilized with a population size of 100, a crossover probability of 0.9 (pc = 0:9),
tournament selection, a mutation rate of 1=u (where u is the number of decision variables), and distribution indexes for crossover and mutation operators are taken as c= 20 and m= 20, respectively (as recommended
in [8]). MOPSO used a population of 100 particles, an archive size of 100 particles, a mutation rate of 0.5, and 30 divisions for the adaptive grid [11]. Also, s-MOPSO is run with a population of 100 particles, an archive size of 100 particles, and a mutation probability of 0.05 [16]. The parameters considered for CSS-MOPSO consist of C1 = 1, C2 = 2, R = 15, rld = 0:01, rud = 0:05, mutation probability = 0.1, archive size of 100 and a population of 50 particles [12]. For all examples presented in this paper, the number of tness function evaluations (structural analysis) in the multi-objective optimization phase is restricted to 30,000.
The results obtained by CSS is compared to the original MOPSO [11], s-MOPSO [19], NSGA [8] and MOCHS [20].
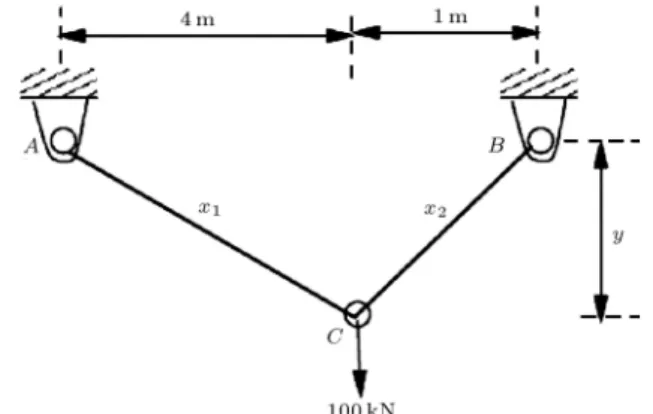
Example 1. A 2-bar truss design. This problem was originally studied using the -constraint method [21].
Figure 5. The two-bar truss problem.
Figure 6. Pareto optimal front obtained using CSS method for two-bar truss design problem.
As shown in Figure 5, the truss has to carry a certain load without elastic failure. Thus, in addition to the objective of designing the truss for minimum volume, there are additional objectives of minimizing stresses in each of the two members, AC and BC. The two-objective optimization problem for three variables y (vertical distance between B and C in m), x1 (cross
sectional area of AC in m2), and x2 (cross sectional
area of BC in m2) is constructed as follows:
Minimize f1(x) = x1
p
16 + y2+ x2p1 + y2
Minimize f2(x) = max(AC; BC)
s.t. 8 > < > :
max(AC; BC) 105
1 y 3 x 0
where AC=20
p
16+y2
yx1 and BC=
80p1+y2
yx2 .
Table 1. Comparison of the results for two-bar truss design problem. Optimization
method EM-MOPSO [22] NSGA-II [8] MOCHS [20]
CSS (present work) Obtained extreme
values (m3, kN)
h
0:004026; 99996i h0:00407; 99755i h0:00375; 99847i h0:00412; 99457i h
0:05273; 8434:493i h0:05304; 8439i h0:0537; 7685i h0:08078; 8434:23i
Figure 7. The I-beam design problem.
the CSS method. Also, the two extreme objective values obtained by various algorithms are compared in Table 1.
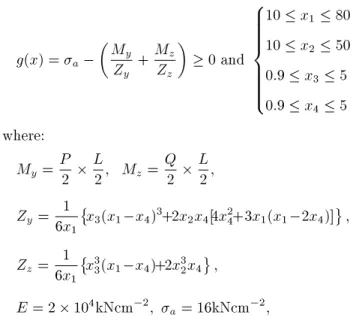
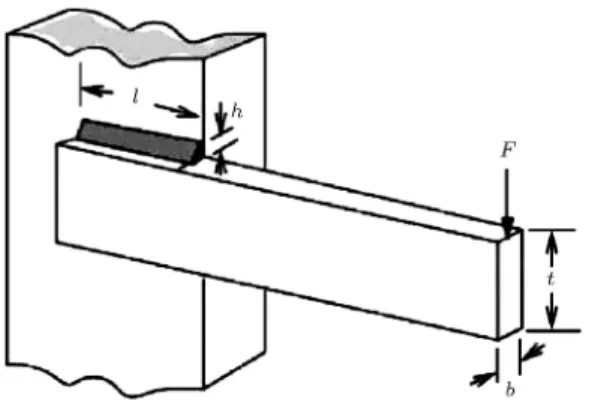
Example 2. An I-beam design. The second design problem is taken from [21]. The problem is to nd the dimension of the beam shown in Figure 7. In this design problem, the dimensions of the geometric and strength constraints should be satised, and, at the same time, the cross-sectional area of the beam and the static deection of the beam should be minimized under a force, P . The mathematical formulation of the problem is as follows:
Minimize cross-sectional area (cm2):
f1= 2x2x4+ x3(x1 2x4);
Minimize displacement (cm2):
f2= PL 3
48EI; where:
I =121 x3(x1 2x4)3+2x2x4[4x24+3x1(x1 2x4)] :
Find xi; i = 1; 2; 3; 4
Figure 8. Pareto optimal front obtained using the CSS method for the I-beam design.
Subject to:
g(x) = a
My
Zy +
Mz
Zz
0 and 8 > > > > > > < > > > > > > :
10 x1 80
10 x2 50
0:9 x3 5
0:9 x4 5
where:
My =P2 L2; Mz= Q2 L2;
Zy =6x1 1
x3(x1 x4)3+2x2x4[4x24+3x1(x1 2x4)] ;
Zz= 6x1 1
x3
3(x1 x4)+2x32x4 ;
E = 2 104kNcm 2;
a= 16kNcm 2;
P = 600kN; Q = 50kN; and L = 200cm:
Figure 8 shows the Pareto front obtained after 100 iterations. The CSS obtained the minimal cross-sectional area of 127.8201 units for a deection of
Figure 9. The welded beam design.
0.0573, and for the minimal deection of 0.0059 units, the cross-sectional area is 847.5709 units. EM-MOPSO obtained the minimal cross-sectional area of 127.9508 units for a deection of 0.05368 units, and for the minimal deection of 0.005961 units, the cross-sectional area was 829.5748 units. NSGA-II obtained a min-imal cross-sectional area of 127.2341 units with a deection of 0.0654 units, and a minimal deection of 0.0060 units with a cross-sectional area of 829.8684 units.
Example 3. Welded beam design. The third design problem was studied by [22]. A beam needs to be welded onto another beam and must carry a certain load (Figure 9). The overhang has a length of 14 inches, and a force, F , of 6000 lb is applied at the end of the beam. The objective of the design is to minimize the cost of fabrication and the end deection. The mathematical formulation of the two-objective optimization problem is as follows:
Minimize 8 < :
f1(x) = 1:10471h2l + 0:04811tb(14 + l)
f2(x) = (x) = 2:1952t3b
Subject to 8 > > > > > > < > > > > > > :
g1(x) = 13:600 (x) 0
g2(x) = 30:000 (x) 0
g3(x) = b h 0
g4(x) = Pc(x) 6000 0
The rst constraint ensures that the shear stress developed at the support location of the beam is less than the allowable shear strength of the material (13,600 psi). The second one ensures that the normal stress developed at the support location of the beam is less that the allowable yield strength of the material (30,000 psi). The third ensures that the thickness of the beam is not less than weld thickness, from a practical standpoint. The fourth one ensures that the allowable buckling load of the beam (along the t direction) is
Figure 10. Pareto optimal front obtained using the CSS method for the welded beam design.
greater than the applied load, F . The stress and buckling terms are as follows:
(x) = s
(0)2+ (00)2+p l000
0:25(l2+ (h + t)2);
0= 6; 000p
2hl;
00=6; 000(14 + 0:5l)
p
0:25(l2+ (h + t)2)
2f0:707hl(l2
12+ 0:25(h + t)2)g
;
(x) = 504; 000t2b ;
Pc(x) = 64; 746:022 (1 0:0282346t) tb3:
Figure 10 shows the optimized non-dominated solu-tions obtained using the CSS algorithm. EM-MOPSO found the minimal cost solution as 2.382 units with a deection of 0.0157 inches, and the minimal deection as 0.000439 with a cost of 36.4836 units. For NSGA-II, the minimal cost was 3.443 units for a deection of 0.0101 units, and the minimal deection was 0.004 with a cost of 36.9121 units. For the CSS, the minimal cost is 2.5112 units for a deection of 0.000439 units, and the minimal deection is 0.0108 with a cost of 47.3722 units.
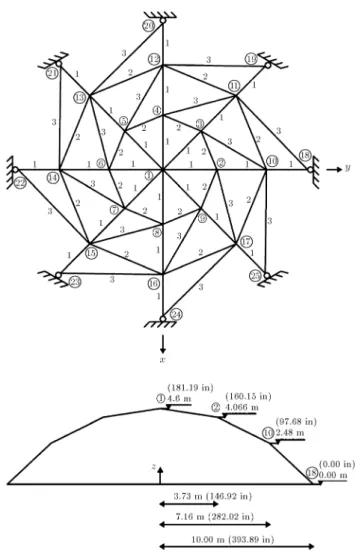
Example 4. A 25-bar truss structures. Another famous 25-bar truss is considered, as shown in Fig-ure 11 [12]. Again, the problem is to nd the cross-sectional area of members, such that the total struc-tural weight and the displacement in the Y -direction at node 1 are minimized concurrently. The structure includes 25 members, which are divided into eight
Figure 11. A 25-bar space truss structures and its member grouping.
groups, as follows: (1) A1, (2) A2 A5, (3) A6 A9, (4)
A10 A11, (5) A12 A13, (6) A14 A17, (7) A18 A21
and (8) A22 A25.
The applied load to this structure is: FX(1)= 4:45( kN); FY (1)= 44:5( kN);
FZ(1)= 44:5( kN); FY (2)= 44:5( kN);
FZ(2)= 44:5( kN); FX(3)= 2; 25( kN);
FX(6)= 2:67( kN):
The upper and lower bounds for the cross sections of each truss element are 64.45 mm2 (0.1 in2) and
2191.47 mm2 (3.4 in2), respectively. The modulus of
elasticity is taken as E = 68:97 kN/mm2 (1 104 ksi)
and the weight density as = 2:714E 8 kN/mm2
(0.1 lb/in2). Constraints on the truss limit the
princi-pal stress, j, in each element to a maximum allowable
stress value of j = 0:27584 kN/mm2 (40 ksi).
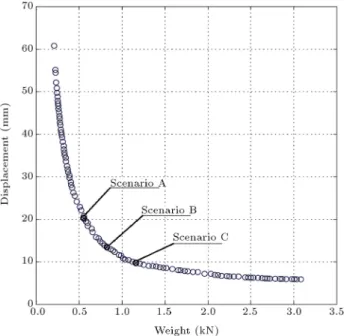
The Pareto front obtained by the CSS algorithm is shown in Figure 12. Also, the two extreme objective values obtained in 10 runs of algorithms are shown in Table 2.
In this example, after nding the Pareto front, the next step is to ask DMs to notify their preferences by considering all the information integrated in the Pareto front. Many dierent scenarios are possible for
Figure 12. The Pareto front of 25-bar truss structure and the best solutions according to three dierent scenarios. Table 2. Comparison of the extreme values obtained by dierent methods for two-bar truss design problem.
Optimization method Obtained extreme values (mm, kN)
CSS-MOPSO [12]
h
5:8437; 4:8111i h
62:9807; 0:3440i
s-MOPSO [19]
h
5:8437; 4:8917i h
62:7832; 0:3239i
MOPSO [11]
h
5:8791; 4:4836i h
60:3942; 0:3642i
NSGA-II [8]
h
5:8437; 4:8297i h
64:5579; 0:3141i
CSS (present work)
h
5:8697; 4:7989i h
63:6643; 0:2176i
a considered problem. For example, these scenarios can be as follows:
Scenatio A. The rst criterion (objective) is more important: e.g. (w1; w2) = (0:6; 0:4)
Scenario B. The rst criterion (objective) is as im-portant as the second criterion: e.g. (w1; w2) = (0:5; 0:5).
Table 3. Best selected solutions for two-bar truss design problem.
Algorithm
Scenario A Scenario B Scenario C
f1(kN) f2 (mm) R
i f1 (kN) f2 (mm) Ri f1 (kN) f2 (mm) Ri
w1= 0:6 w2= 0:4 w1= 0:5 w2= 0:5 w1 = 0:4 w2= 0:6
CSS
(present work) 0.558 20.2810 1.5325 0.823 13.4183 1.8229 1.159 9.6868 2.0355
CSS-MOPSO [12] 1.189 16.7307 1.8504 1.548 12.7422 2.0962 2.036 9.6144 2.2732
Scenario C. The second criterion (objective) is more important: e.g. (w1; w2) = (0:4; 0:6).
The selected solutions corresponding to each con-sidered scenario are indicated in Figure 11, and in Table 3, the best solutions for dierent scenarios are presented and compared to those of Ref. [12]. By calculating the index Ri =pf1w1 f2w2 for the results
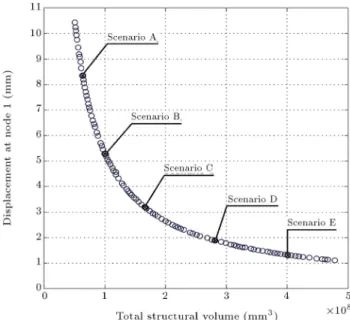
obtained by CSS and Kaveh and Laknejadi [12], the eciency of the proposed algorithm is claried. Example 5. A 56-bar truss structure. This example is a 56-bar space truss studied in [23], with members categorized in three groups, as shown in Figure 13. Joint 1 is loaded with 4 kN (899.24 lb) in the Y -direction and 30 kN (6744.267 lb) in the Z--direction, while the remaining free nodes are loaded with 4 kN (899.24 lb) in the Y -direction and 10 kN (2248.09 lb) in the Z-direction.
The vertical displacements of joints 4, 5, 6, 12, 13 and 14 are restricted to 40 mm (0.158 in), while the displacement of joint 8 in the Y -direction is limited to 20 mm (0.079 in). The modulus of elasticity and the minimum and maximum member-cross sectional areas are taken as 210 kN/mm2 (3.05104 ksi), 200 mm2
(0.31 in2) and 2000 mm2 (3.1 in2), respectively. The
total structural volume, F1(x), and the displacement
at node 1, F2(x), have to be minimized simultaneously.
Objective functions are:
Min 8 < :
F1(x) =P56i=1Aili
F2(x) =
p 2
1X+ 21Y + 1Z2
(19)
The two extreme objective values, obtained in 10 runs of various algorithms and the proposed method, are compared in Table 4. In addition, the Pareto front obtained via the CSS algorithm is shown in Figure 14. The process of decision making and nding the best solution is performed identical to the previous example. In this example, in order to show the wide range of possible solutions, ve dierent scenarios are considered. The results are aggregated in Table 5. The selected solutions corresponding to each considered scenario are provided in Figure 14.
Figure 13. A 56-bar space truss structure.
Example 6. A 272-bar transmission tower. The fth test example is the transmission tower, depicted in Figure 15, together with its geometric characteristics. This example is generated by the authors of this paper. The nodal coordinates and end nodes of each member are provided in Tables 6 and 7, respectively. The design variables considered are the cross-sectional area of the members, divided into twenty eight groups, as shown in Table 8.
Joints 1, 2, 11, 20 and 29 are loaded with 20 kN in the X- and Y -directions and 40 kN in the Z-direction,
while the remaining free nodes are loaded with 5 kN in the X- and Y -directions. The vertical displacement of joints 2, 11, 20 and 29 is restricted to 20 mm, while the displacements in the X- and Y -directions are limited to 100 mm. The modulus of elasticity and the minimum and maximum member-cross sectional areas are taken as 2 108 kN/m2 (3:05 104 ksi),
1000 mm2 and 16000 mm2, respectively. The principal
stress, j, in each element is restricted to the maximum
allowable stress, j = 275000 kN/m2. The total
structural volume, F1(x), and the displacement at
node 1, F2(x), have to be minimized simultaneously.
Table 4. Comparison of the extreme values obtained by dierent methods for the 56-bar truss.
Optimization method Obtained extreme values (mm, mm3)
CSS-MOPSO [12]
h
2:2148; 402923368:6i h
7:5495; 120812690:1i
s-MOPSO [19]
h
2:2137; 402417631:6i h
7:4721; 120151168:8i
MOPSO [11]
h
2:2154; 403070300:4i h
7:0825; 123191518:1i
NSGA-II [8]
h
2:2137; 402403612:4i h
7:4883; 119960278:7i
CSS (present work) h
1:1061; 478422670:1i h
10:4342; 50644453:1i
Objective functions are:
Min 8 > < > :
F1(x) =P272i=1Aili
F2(x) =p21X+ 1Y2 + 1Z2
(20)
The Pareto front obtained via the CSS algorithm is shown in Figure 16. The process of decision making and nding the best solution is performed completely similar to those of previous examples. In this example, in order to show the wide range of possible solutions, nine dierent scenarios are considered. The results are aggregated in Table 9. The selected solutions corresponding to each considered scenario are provided in Figure 16.
Figure 14. The Pareto front of 56-bar space truss structure and the best solutions according to ve dierent scenarios.
Table 5. Dierent possible scenarios for the 56-bar truss with corresponding solutions. Scenario Importance
of criteria
Possible priority weights
Selected solution by MTDM (mm, mm3)
CSS-MOPSO [12] CSS (present work)
f1 (mm) f2(mm3) Ri f1 (mm) f2 (mm3) Ri
A c1>> c2
h
0:9; 0:1 i
6.1144 134900811.2 5.7592 8.3478 63593336.6 6.3808 B c1> c2
h
0:7; 0:3i 4.4740 166100766.2 28.8934 5.2836 100114327.7 28.3857 C c1 c2
h
0:5; 0:5i 3.2959 208951138.7 161.9961 3.2022 165628602.5 151.7560 D c1< c2
h
0:3; 0:7 i
2.5679 267415709.3 1025.5389 1.8809 281480915.0 996.4649 E c1<< c2
h
Figure 15. A 272-bar transmission tower. Table 6. Nodal coordinates of the transmission tower. Node X
(m) Y (m)
Z
(m)Node X(m) Y (m)
Z
(m)Node X(m) Y (m)
Z
(m)Node X(m) Y (m)
Z
(m)Node X(m) Y (m)
Z (m) 1 0 0 20 14 -0.5 -0.5 17 27 1.5 -0.5 15 40 0.5 -0.5 12 53 1.25 1.25 6 2 -3 0 17.5 15 -0.5 0.5 17 28 1.5 0.5 15 41 0.5 0.5 12 54 -1.5 -1.5 4 3 -1.5 -0.5 18 16 0.5 -0.5 17 29 3 0 14.5 42 -0.75 -0.75 10 55 -1.5 1.5 4 4 -1.5 0.5 18 17 0.5 0.5 17 30 -1.5 -0.5 14 43 -0.75 0.75 10 56 1.5 -1.5 4 5 -0.5 -0.5 18 18 1.5 -0.5 17 31 -1.5 0.5 14 44 0.75 -0.75 10 57 1.5 1.5 4 6 -0.5 0.5 18 19 1.5 0.5 17 32 -0.5 -0.5 14 45 0.75 0.75 10 58 -1.75 -1.75 2 7 0.5 -0.5 18 20 -3 0 14.5 33 -0.5 0.5 14 46 -1 -1 8 59 -1.75 1.75 2 8 0.5 0.5 18 21 -1.5 -0.5 15 34 0.5 -0.5 14 47 -1 1 8 60 1.75 -1.75 2 9 1.5 -0.5 18 22 -1.5 0.5 15 35 0.5 0.5 14 48 1 -1 8 61 1.75 1.75 2 10 1.5 0.5 18 23 -0.5 -0.5 15 36 1.5 -0.5 14 49 1 1 8 62 -2 -2 0 11 3 0 17.5 24 -0.5 0.5 15 37 1.5 0.5 14 50 -1.25 -1.25 6 63 -2 2 0 12 -1.5 -0.5 17 25 0.5 -0.5 15 38 -0.5 -0.5 12 51 -1.25 1.25 6 64 2 -2 0 13 -1.5 0.5 17 26 0.5 0.5 15 39 -0.5 0.5 12 52 1.25 -1.25 6 65 2 2 0
7. Conclusions
Optimization problems encountered in practice are seldom mono-objective. In general, there are many conicting objectives to handle. An ecient procedure for solving multi-objective optimization problems using
the Charged System Search algorithm is presented in this study. The algorithm is also applied to six engineering design problems to demonstrate its appli-cability in practical problems. The results obtained amply demonstrate that the presented approach is ecient in converging to the true Pareto fronts and
Table 7. End nodes of the members of 272-bar transmission tower. Mem b er Start p oin t End p oin t Mem b er Start p oin t End p oin t Mem b er Start p oin t End p oin t Mem b er Start p oin t End p oin t Mem b er Start p oin t End p oin t Mem b er Start p oin t End p oin t Mem b er Start p oin t End p oin t Mem b er Start p oin t End p oin t
1 1 5 35 10 19 69 34 32 103 4 15 137 9 19 171 38 42 205 47 48 239 57 56 2 1 6 36 8 17 70 35 37 104 6 13 138 10 18 172 40 44 206 46 49 240 56 54 3 1 7 37 6 15 71 37 36 105 21 24 139 21 31 173 41 45 207 46 50 241 54 57 4 1 8 38 4 13 72 36 34 106 22 23 140 22 30 174 39 43 208 48 52 242 55 56 5 2 3 39 12 13 73 21 30 107 24 25 14 1 23 33 175 38 43 209 49 53 243 54 58 6 2 4 40 13 15 74 23 32 108 23 26 14 2 32 24 176 39 42 210 47 51 244 56 60 7 2 12 41 15 14 75 25 34 109 26 27 1 43 25 35 177 40 45 211 46 52 245 57 61 8 2 13 42 14 12 76 27 36 110 25 28 1 44 26 34 178 41 44 212 48 50 246 55 59 9 11 9 43 15 17 77 28 37 111 31 32 1 45 27 37 179 38 44 213 49 51 247 54 60 10 11 10 44 17 16 78 26 35 112 30 33 1 46 28 36 180 40 42 214 47 53 248 56 58 11 11 18 45 16 14 79 24 33 113 33 34 1 47 14 23 181 41 43 215 46 51 249 57 59 12 11 19 46 17 19 80 22 31 114 32 35 1 48 16 25 182 39 45 216 47 50 250 55 61 13 20 21 47 19 18 81 4 5 115 35 36 1 49 17 26 183 42 43 217 48 53 251 54 59 14 20 22 48 18 16 82 3 6 116 34 37 1 50 15 24 184 43 45 218 49 52 252 55 58 15 20 30 49 38 39 83 6 7 117 21 32 1 51 32 38 185 45 44 219 50 51 253 56 61 16 20 31 50 39 41 84 5 8 118 30 23 15 2 34 40 186 42 44 220 51 53 254 57 60 17 29 27 51 41 40 85 8 9 119 23 34 1 53 35 41 187 43 44 221 53 52 255 58 59 18 29 28 52 40 38 86 7 10 120 32 25 1 54 33 39 188 42 45 222 52 50 256 59 61 19 29 36 53 21 22 87 12 15 121 25 36 1 55 14 25 189 42 46 223 51 52 257 61 60 20 29 37 54 22 24 88 13 14 122 34 27 1 56 16 23 190 44 48 224 50 53 258 60 58 21 3 4 55 24 23 89 15 16 123 28 35 157 17 24 191 4 5 49 225 50 54 259 59 60 22 4 6 56 23 21 90 14 17 124 26 37 158 15 26 192 4 3 47 226 52 56 260 58 61 23 6 5 57 24 26 91 17 18 125 26 33 159 14 24 193 4 2 48 227 53 57 261 58 62 24 5 3 58 26 25 92 16 19 126 24 35 160 15 23 194 4 4 46 228 51 55 262 60 64 25 6 8 59 25 23 93 3 14 127 24 31 161 16 26 195 45 47 229 50 56 263 61 65 26 8 7 60 26 28 94 5 12 128 22 33 162 17 25 196 43 49 230 52 54 264 59 63 27 7 5 61 28 27 95 5 16 129 39 40 163 32 40 197 42 47 231 53 55 265 58 64 28 8 10 62 27 25 96 7 14 130 38 41 164 38 34 198 4 3 46 232 51 57 266 60 62 29 10 9 63 30 31 97 7 18 131 3 13 165 35 39 199 44 49 233 50 55 267 61 63 30 9 7 64 31 33 98 9 16 132 12 4 166 33 41 200 45 48 234 51 54 268 59 65 31 3 12 65 33 32 99 10 17 133 5 15 167 32 39 201 4 6 47 235 52 57 269 58 63 32 5 14 66 32 30 100 8 19 134 14 6 168 33 38 202 4 7 49 236 53 56 270 59 62 33 7 16 67 33 35 101 8 15 135 7 17 169 34 41 203 4 9 48 237 54 55 271 60 65 34 9 18 68 35 34 102 6 17 136 8 16 170 35 40 204 4 8 46 238 55 57 272 61 64
Table 8. Member grouping of the 272-bar transmission tower. Group
number Members
Group
number Members
Group
number Members
Group
number Members
1 M1 M4 8 M175 M182 15 M207 M210 22 M241 M242
2 M5 M20 9 M183 M186 16 M211 M218 23 M243 M246
3 M21 M80 10 M187 M188 17 M219 M222 24 M247 M254
4 M81 146M 11 M189 M192 18 M223 M224 25 M255 M258
5 M147 M154 12 M193 M200 19 M225 M228 26 M259 M260
6 M155 M170 13 M201 M204 20 M229 M236 27 M261 M264
7 M171 M174 14 M205 M206 21 M237 M240 28 M265 M272
Table 9. Dierent possible scenarios for the transmission tower with corresponding solutions. Scenario Possible priority
weights
Selected solutions by
MTDM (m, m3) Ri=
p fw1
1 f2w2
A 0:9; 0:1 0:4571; 0:1102 0.6296
B 0:8; 0:2 0:4793; 0:0947 0.5887
C 0:7; 0:3 0:5067; 0:0763 0.5359
D 0:6; 0:4 0:5646; 0:0606 0.4809
E 0:5; 0:5 0:8278; 0:0504 0.4520
F 0:4; 0:6 1:4683; 0:0439 0.4228
G 0:3; 0:7 2:1702; 0:0398 0.3633
H 0:2; 0:8 3:0858; 0:0384 0.3039
I 0:1; 0:9 4:0674; 0:0377 0.2453
Figure 16. The Pareto front of transmission tower and the best solutions according to nine dierent scenarios.
Figure 17. Comparison between best solutions according to ve dierent scenarios obtained by the present work and CSS-MOPSO for Example 5.
in nding a diverse set of solutions along the Pareto front. Considering Tables 1, 2 and 4, it is obvious that the Pareto front obtained by the present method is more diverse than other methods. After computing the Pareto front, the engineers involved in making design
decisions, express their preferences about dierent criteria (objectives or other independent criteria). By aggregating dierent ideas, the nal solution is selected by an algorithm called MTDM. Comparison of the best solutions, corresponding to ve dierent scenarios obtained by the present work and CSS-MOPSO, is shown in Figure 17 for Example 5.
Acknowledgement
The rst author is grateful to the Iran National Science Foundation for its support.
References
1. Eberhart, R.C. and Kennedy, J. \A new optimizer using particle swarm theory", In: Proc. 6th Int. Sym. Micro Mach. Human Sci., Nagoya, Japan (1995).
2. Dorigo, M., Maniezzo, V. and Colorni, A. \The ant system: Optimization by a colony of cooperating agents", IEEE Trans. Syst. Man Cyber., 26, pp. 29-41 (1996).
3. Erol, O.K. and Eksin, I. \New optimization method: Big Bang-Big Crunch", Adv. Eng. Softw., 37, pp. 106-111 (2006).
4. Lee, K.S. and Geem, Z.W. \A new structural optimiza-tion method based on the harmony search algorithm", Comput. Struct., 82, pp. 781-798 (2004).
5. Kaveh, A. and Talatahari, S. \A novel heuristic optimization method: Charged system search", Acta Mech., 213, pp. 267-289 (2010).
6. Kaveh, A. and Khayatazad, M. \A new meta-heuristic method: Ray optimization", Comput. Struct., 112-113, pp. 283-294 (2012).
7. Kaveh, A. and Farhoudi, N. \A new optimization method: Dolphin echolocation", Adv. Eng. Softw., 59, pp. 53-70 (2013).
8. Deb, K., Pratap, A., Agarwal, S. and Meyarivan, T. \A fast and elitist multi objective genetic algorithm: NSGA-II", IEEE Trans. Evol. Comput., 6, pp. 182-197 (2002).
9. Zitzler, E., Laumanns, M. and Thiele, L. \SPEA2: Im-proving the strength Pareto evolutionary algorithm", Swiss Federal Institute Technology: Zurich, Switzer-land (2001).
10. Knowles, J.D. and Corne, D.W. \Approximating the non-dominated front using the Pareto archived evolu-tion strategy", Evol. Comput., 8, pp. 149-172 (2000).
11. Coello Coello, C.A. and Lechuga, M.S. \MOPSO: A proposal for multiple objective particle swarm opti-mization", Proc. Cong. Evol. Comput., 1, pp. 1051-1056 (2002).
12. Kaveh, A. and Laknejadi, K. \A hybrid multi-objective optimization and decision making procedure for op-timal design of truss structures", Iranian J. Sci. Technol., Trans. Civil Eng., 35, pp. 137-54 (2011).
13. Kaveh, A. and Talatahari, S. \Charged system search for optimal design of planar frame structures", Appl. Soft Comput., 12, pp. 382-393 (2012).
14. Kaveh, A. and Talatahari, S. \Charged system search for optimum grillage system design using LRFS-AISC code planar frame structures", J. Construct. Steel Res., 66(6), pp. 767-771 (2010).
15. Deb, K., Multi Objective Optimization Using Evolu-tionary Algorithms, Chichester, Wiley, U.K (2001).
16. Kaveh, A. and Talatahari, S. \Particle swarm opti-mizer, ant colony strategy and harmony search scheme hybridized for optimization of truss structures", Com-put. Struct., Nos, 5-6, 87, pp. 267-283 (2009).
17. Fishburn, P.C., Utility Theory for Decision Making, Wiley, New York, USA (1970).
18. Parreiras, R.O., Maciel, J.H.R.D. & Vasconcelos, J.A. \Decision making in multi-objective optimization problems", ISE Book Series on Real Word Multi-Objective System Engineering, pp. 1-20 (2005).
19. Mostaghim, S. and Teich, J. \Strategies for nding good local guides in multi objective particle swarm optimization (MOPSO)", In Proc. IEEE Swarm In-telligence Sym., pp. 26-33 (2003).
20. El-Santawy, M.F. and Ahmed, A.N. \A multi-objective chaotic harmony search for structural optimization", Int. J. Comput. Sci., 3, pp. 33-39 (2012).
21. Palli, N., Azram, S., McCluskey, P. and Sundararajan, R. \An interactive multistage -inequality constraint method for multiple objectives decision making", ASME J. Mech. Des., 4, pp. 678-686 (1999).
22. Reddy, M.J. and Nagesh Kumar, D. \An e-cient multi-objective optimization algorithm based on swarm intelligence for engineering design", Eng. Op-tim., 39, pp. 49-68 (2007).
23. Kelesoglu, O. \Fuzzy multi-objective optimization of truss-structures using genetic algorithm", Adv. Eng. Softw., 38, pp. 717-721 (2007).
Biographies
Ali Kaveh was born in 1948, in Tabriz, Iran. He obtained a BS degree in Civil Engineering from Tabriz University in 1969, and MS, DIC and PhD degrees in 1970 and 1974, respectively, in Structures, from Imperial College of Science and Technology, London University, UK. He is currently Professor of Struc-tural Engineering at Iran University of Science and
Technology, Tehran, Iran. Professor Kaveh is au-thor of 365 papers published in international journals and 130 papers presented at international conferences. He has authored 23 books in Farsi and 6 books in English published by Wiley, the American Mechan-ical Society, Research Studies Press and Springer-Verlag.
Mohammad Sajjad Massoudi was born in 1984 in Tehran, Iran. He obtained his BS degree (Civil Engineering) in 2007 and his MS degree (Structural Engineering) in 2010 from Iran University of Science and Technology, Tehran, Iran, where he is currently pursuing a PhD degree program in Structural Engi-neering.