157
Assessment of Selected Chemical Components in Different
Types of Chocolates
Alica Bobková
1, Július Árvay
2, Marek Šnirc
3,
Ľubomír Belej
1, Marek Bobko
3,
Henrieta Brenkusová
1, Tomáš Fekete
11
Slovak University of Agriculture, Faculty of Biotechnology and Food Sciences, Department of Hygiene and Food Safety, Tr. A. Hlinku 2, 949 76 Nitra, Slovakia
2
Slovak University of Agriculture, Faculty of Biotechnology and Food Sciences, Department of Chemistry, Tr. A. Hlinku 2, 949 76 Nitra, Slovakia
3
Slovak University of Agriculture, Faculty of Biotechnology and Food Sciences, Department of Evaluation and Processing of Animal Products, Tr. A. Hlinku 2, 949 76 Nitra, Slovakia
Abstract
The aim of the study was observed selected and compared chemical components in commercial and raw chocolates. HPLC was used to determine Galic acid, Theobromin, Catechin, Caffeine, Epicatechin and Epigallocatechin 3 gallate in 17 commercial chocolates. Result shows very strong inverse correlation between Epigallocatechin 3 gallate and Galic acid. There was also observed strong positive correlation between Theobromin and Caffeine, Epicatechin and Galic acid, Epigallocatechin 3 gallate and Theobromin, Caffeine and Epigallocatechin 3 gallate. The PCA revealed that 78.83 % of the total variation embodied in five variables could be effectively condensed into and explained by first two principal components (PCs), with eigenvalues of 3.00 and 1.72, respectively. The PC1, accounting for 50.05 % of the inertia, contrasted Galic acid and Caffeine, Epigallocatechin 3 gallate and Theobromin whereas PC2, explaining 28.77 % of the inertia, clearly reflected the different content of Epigallocatechin 3 gallate and Epicatechin. The total variability depends on the tested chemical parameters. The tested raw chocolates were characterized in particular by the caffeine parameters Epigallocatechin 3 gallate.
Keywords: Chocolate, HPLC, PCA.
1. Introduction
Cocoa (Theobroma cacao L.) and chocolate products appear to be one of the most promising foods due to their high polyphenol content, which evidently highlights the link with health-promoting properties [1].
Cocoa is regarded to be a rich source of polyphenols, in particular flavanols, also known as flavan-3-ols or catechins. Predominant monomers include (−)-epicatechin and (+)-catechin, whilst these also act as oligomeric counterparts to form longer chain procyanidins. Human intervention
* Corresponding author: Ľubomír Belej, +421 37 641 4603, [email protected]
studies have demonstrated that the consumption of cocoa or chocolate polyphenols can yield significant improvements in certain long-term cardiovascular health outcomes: blood pressure, vascular tone, endothelial function, insulin resistance, glucose tolerance, platelet reactivity and immune and antioxidant defense system [1,3-5].
158 the protective mechanism of cocoa phenolics in heart disease. Other relevant properties include their ability to modulate the immune response and their anti-inflammatory and anticarcinogenic properties [8].
Cocoa and its derivatives (cocoa powder, cocoa liquor and chocolate) are sources of methylxanthines, phenolic compounds such as epicatechin, polyphenols, and anthocyanins, and a great variety of volatile compounds (e.g. 4-methyl-2-phenyl-2-pentenal and 5-methyl-2-phenyl-2-hexenal) which are responsible for the astringent and bitter taste of the cocoa beans. Post-harvest processing, such as fermentation and roasting, is known to affect the polyphenol and methylxanthine concentrations and the antioxidant activity of cocoa beans, thereby influencing the quality of the final product [9]. During the fermentation process the combination of endogenous and exogenous enzyme activities, along with diffusion of metabolites into the cotyledons, allows for the polymerization of polyphenols, which decreases their solubility thus reducing the bitterness and astringency of the beans and assisting with the release of methylxanthines from the beans. During the roasting process, conditions such as time and temperature affect the phenolic stability as well as the characteristics of resulting flavor [10].
2. Materials and methods
Samples
17 chocolate samples were used for analysis. Samples 1A – 13A were prepared as raw and samples 0B, 8B, 9B, 10B were purchased in commercial store.
Chemicals
Single-component standards (theobromine, theophylline, and gallic acid), methanol (HPLC grade) and formic acid (ACS grade) were purchased from Sigma Aldrich (Sigma-Aldrich Chemie GmbH, Steiheim, Germany). Blended standard Green Tea Catechin Mix (GTCM) (contains: caffeine, (+)-catechin, (-)-catechin-3-gallate, (-)-epicatechin, (-)-epicatechin-3-(-)-catechin-3-gallate, )-epigallocatechin-3-gallate, )-gallocatechin, (-)-gallocatechin-3-gallate) was purchased from Cerriliant company (Cerriliant Corp., RR, Texas, USA). Double deionized water (ddH2O) was treated (18.2 MΩ.cm-1) in a Simplicity 185
purification system (Millipore SAS, Molsheim, France).
HPLC analyses
All studied compounds were determined by HPLC Agilent 1260 (Agilent Technologies, Waldbronn, Germany) with quaternary solvent manager coupled with degasser (G1311B), sample manager (G1329B), column manager (G1316A) and DAD detector (G1315C). All analyses were performed on C18 endcapped column with reverse phase Purosphere® (4 mm x 250 mm x 5 µm) (Merck, KGaA, Darmstadt, Germany). Mobile phases consisted of methanol (B) and 0.1% HCOOH in ddH2O (v/v) (C). The gradient elution was as follows: 0-2 min isocratic elution (20% B and 80% C), 2-15 min linear gradient elution (40% B and 60% C), 15-20 min (40% B and 60% C) and 3 minutes postrun. The mobile phase flow was 1 mL min-1 and the sample injection was 3 µL. Column thermostat was set to 25 °C and the samples were kept at 4 °C the sampler manager. The detection wavelength was set at 280 nm, with scanning of the spectrum in the range of 210-400 nm. The spectral data were collected and processed using Agilent OpenLab ChemStation software for LC 3D Systems
All statistical analyses were performed using XLSTAT (Addinsoft, 2016) software.
3. Results and discussion
Wollgast and Anklam [11] reviewed the polyphenol content of cocoa depending on its origin and the manufacturing process of the final product. Three groups of polyphenols can be identified in cocoa beans: catechins, which constitute about 37% of the polyphenol content in the beans, anthocyanidins (about 4%), and proanthocyanidins (about 58%). Of the catechins, (−)-epicatechin is the most abundant (up to 35%), while (+)-catechin, (+)-gallocatechin, and (−)-epigallocatechin are present in smaller quantities. The most sensitive HPLC method for analysis of catechins in green tea using chemiluminescence detection, with a limit of detection of pg ml−1. This level of sensitivity is not required for analysis of major tea polyphenols [12, 13].
159 Epicatechin and Galic acid, Epigallocatechin 3 gallate and Theobromin, Caffeine and Epigallocatechin 3 gallate. There was moderate positive correlation between Epigallocatechin 3 gallate and Catechin. The strength of other
relationships ranged from very weak to strong and was either positive or negative. All of the correlations were significant except for ascorbic acid content and total phenolic content.
Table 1. Pearson correlation coefficients among the variables
Variables Galic acid Theobromin Catechin Caffeine Epicatechin
Epigallocatechin 3 gallate
Galic acid 1 0.1548 -0.1114 -0.3138 0.5437 -0.5238
Theobromin 0.1548 1 0.3908 0.8617 0.3555 0.6950
Catechin -0.1114 0.3908 1 0.3882 -0.1064 0.4937
Caffeine -0.3138 0.8617 0.3882 1 0.0378 0.8827
Epicatechin 0.5437 0.3555 -0.1064 0.0378 1 0.0402
Epigallocatechin 3 gallate -0.5238 0.6950 0.4937 0.8827 0.0402 1
Values in bold are different from 0 with a significance level alpha=0,05
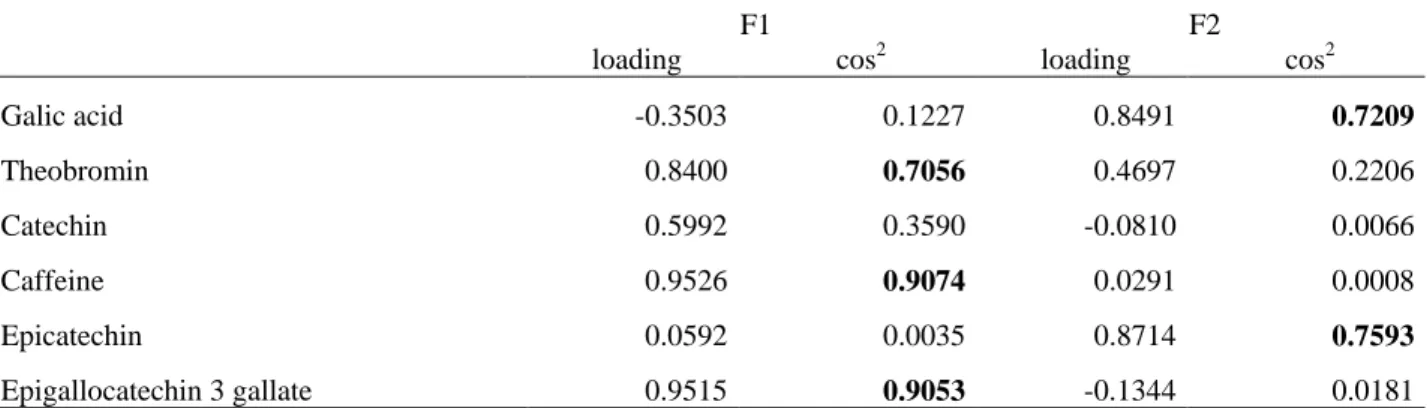
Table 2. Loadings (correlations between variables and PCs) and squared cosines of variables with PC1 and PC2
F1 F2
loading cos2 loading cos2
Galic acid -0.3503 0.1227 0.8491 0.7209
Theobromin 0.8400 0.7056 0.4697 0.2206
Catechin 0.5992 0.3590 -0.0810 0.0066
Caffeine 0.9526 0.9074 0.0291 0.0008
Epicatechin 0.0592 0.0035 0.8714 0.7593
Epigallocatechin 3 gallate 0.9515 0.9053 -0.1344 0.0181
Values in bold correspond for each variable to the factor for which the squared cosine is the largest
Kaiser-Meyer-Olkin (KMO) test of sampling adequacy showed middling suitability of the data for complete model (KMO = 0.49). Bartlett's test of sphericity was significant (chi-square = 86.24, P ≤ 0.0001), indicating that the data was likely factorizable.
The PCA revealed that 78.83 % of the total variation embodied in five variables could be effectively condensed into and explained by first two principal components (PCs), with eigenvalues of 3.00 and 1.72, respectively.
The PC1, accounting for 50.05 % of the inertia, contrasted galic acid and caffeine, epigallocatechin 3 gallate and theobromin whereas PC2, explaining 28.77 % of the inertia, clearly reflected the different content of epigallocatechin 3 gallate and epicatechin (Table 2, Figure 1).
160 Figure 1 shows a 2-D map for PC1 and PC2, in which the variables of individual chemical components are clustered around the centroids (mean vector for group of variables). Table 3 presents factor scores and squared cosines, which are the coordinates and representation qualities, respectively, of the centroids in the 2-D space. Cocoa has more phenolics and higher antioxidant capacity than green tea, black tea, or red wine [8]. Content of caffeine is less than coffee. [2] In fact, Lee et al. [14] found that cocoa contains 611 mg/serving of gallic acid equivalents and 564 mg/serving of epicatechin equivalents. The values for gallic acid equivalents were 1.8, 3.7, and 4.9 higher than those obtained for red wine,
green tea, and black tea, respectively, while the epicatechin equivalents were 3.5, 12.0, and 16.6, respectively, for the same beverages.
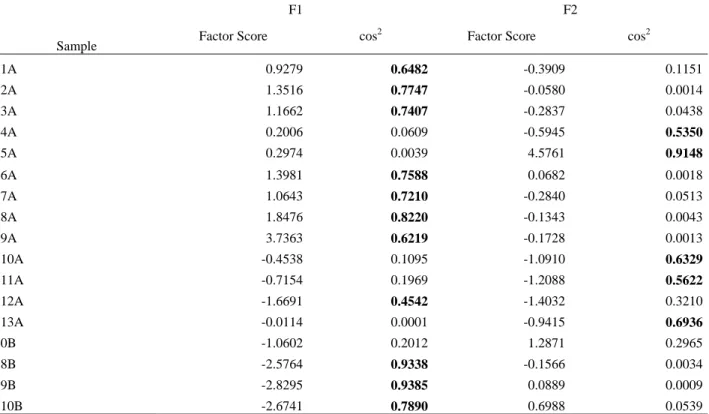
Figure 2 shows a 2-D map for PC1 and PC2, in which the variables of individual chemical components are clustered around the centroids (mean vector for group of variables). Table 3 presents factor scores and squared cosines, which are the coordinates and representation qualities, respectively, of the centroids in the 2-D space. Sample 5A is characterized by epicatin content. Sample 9A most correlates with the Caffeine parameter. All Group B samples are in negative correlation with the parameters Caffeine, Theobromine and Epigallocatechin 3 gallate.
Table 3. Factor scores of centroids for grape varieties in PC1 vs. PC2 dimension and their squared cosines
Sample
F1 F2
Factor Score cos2 Factor Score cos2
1A 0.9279 0.6482 -0.3909 0.1151
2A 1.3516 0.7747 -0.0580 0.0014
3A 1.1662 0.7407 -0.2837 0.0438
4A 0.2006 0.0609 -0.5945 0.5350
5A 0.2974 0.0039 4.5761 0.9148
6A 1.3981 0.7588 0.0682 0.0018
7A 1.0643 0.7210 -0.2840 0.0513
8A 1.8476 0.8220 -0.1343 0.0043
9A 3.7363 0.6219 -0.1728 0.0013
10A -0.4538 0.1095 -1.0910 0.6329
11A -0.7154 0.1969 -1.2088 0.5622
12A -1.6691 0.4542 -1.4032 0.3210
13A -0.0114 0.0001 -0.9415 0.6936
0B -1.0602 0.2012 1.2871 0.2965
8B -2.5764 0.9338 -0.1566 0.0034
9B -2.8295 0.9385 0.0889 0.0009
10B -2.6741 0.7890 0.6988 0.0539
161 Figure 2. Map of PC1 and PC2 with observations.
4. Conclusion
Making new kinds of chocolate in a non-traditional way becomes very popular. The content of individual chemicals in chocolate is influenced by the chocolate production. Total variability between raw preparations and commercially preparations depends on chemical composition. Further research is needed to describe the relationship between different chocolate production methods.
References
1. Alañón M, Castle S, Siswanto P, Cifuentes-Gómez T, Spencer J. Assessment of flavanol stereoisomers and caffeine and theobromine content in commercial chocolates.Food Chemistry. 2016, pp. 177-184. doi:10.1016/j.foodchem.2016.03.116.
2. Bobková A, Šnirc M, Fikselová M. Selected parameters of Arabica coffee quality affected by its geographical origin. Potravinarstvo Slovak Journal of Food Sciences. 2017, pp. 260-265. doi: https://dx.doi.org/10.5219/794
3. Fisher N, Hughes M, Gerhard-Herman M, Hollenberg N. Flavanol-rich cocoa induces nitric-oxide-dependent vasodilation in healthy humans. Journal of Hypertension. 2003, pp. 2281-2286. doi:10.1097/00004872-200312000-00016. 4. Heiss C. Vascular Effects of Cocoa Rich in Flavan-3-ols.JAMA: The Journal of the American Medical
Association. 2003, pp. 1030-1031.
doi:10.1001/jama.290.8.1030.
5. Ostertag L, Kroon P, Wood S et al. Flavan-3-ol-enriched dark chocolate and white chocolate improve acute measures of platelet function in a gender-specific way-a randomized-controlled human intervention trial.Molecular Nutrition & Food Research. 2012, pp. 191-202. doi:10.1002/mnfr.201200283.
6. Schinella G, Mosca S, Cienfuegos-Jovellanos E et al. Antioxidant properties of polyphenol-rich cocoa
products industrially processed.Food Research
International. 2010, pp. 1614-1623.
doi:10.1016/j.foodres.2010.04.032.
7. Hatano T, Miyatake H, Natsume M et al. Proanthocyanidin glycosides and related polyphenols from cacao liquor and their antioxidant
effects.Phytochemistry. 2002, pp. 749-758.
doi:10.1016/s0031-9422(02)00051-1.
8. Andújar I, Recio M, Giner R, Ríos J. Cocoa Polyphenols and Their Potential Benefits for Human Health.Oxidative Medicine and Cellular Longevity. 2012, pp. 1-23. doi:10.1155/2012/906252.
9. Aculey P, Snitkjaer P, Owusu M et al. Ghanaian Cocoa Bean Fermentation Characterized by Spectroscopic and Chromatographic Methods and Chemometrics.Journal of Food Science. 2010, pp. S300-S307. doi:10.1111/j.1750-3841.2010.01710.x. 10. Batista N, de Andrade D, Ramos C, Dias D, Schwan R. Antioxidant capacity of cocoa beans and
chocolate assessed by FTIR.Food Research
International. 2016, pp. 313-319.
doi:10.1016/j.foodres.2016.10.028.
11. Wollgast J, Anklam E. Polyphenols in chocolate: is there a contribution to human health?.Food Research International. 2000, pp. 449-459. doi:10.1016/s0963-9969(00)00069-7.
12. Nakagawa K, Miyazawa T. Chemiluminescence– High-Performance Liquid Chromatographic Determination of Tea Catechin, (−)-Epigallocatechin 3-Gallate, at Picomole Levels in Rat and Human Plasma.Analytical Biochemistry. 1997, pp. 41-49. doi:10.1006/abio.1997.2098.
13. El-Shahawi M, Hamza A, Bahaffi S, Al-Sibaai A, Abduljabbar T. Analysis of some selected catechins and caffeine in green tea by high performance liquid chromatography.Food Chemistry. 2012, pp. 2268-2275. doi:10.1016/j.foodchem.2012.03.039.
14. Lee K, Kim Y, Lee H, Lee C. Cocoa Has More Phenolic Phytochemicals and a Higher Antioxidant
Capacity than Teas and Red Wine.Journal of