Mathematical and Software Engineering, Vol. 2, No. 1 (2016), 19-29 Varεpsilon Ltd, http://varepsilon.com
Comparative Study of Performance of Three
Different Photovoltaic Technologies
Constance Kalu
1, Ezenugu Isaac A.
2, Umoren Mfonobong
Anthony
31,3
Department of Electrical/Electronic and Computer Engineering, University of Uyo, AkwaIbom, Nigeria
2
Department of Electrical Engineering, Imo State University (IMSU), Owerri, Nigeria.
1
[email protected], [email protected], 3
*Corresponding Author: [email protected]
Abstract
In this project, simulation approach is used for the comparative analysis of different photovoltaic (PV) technologies, namely; poly crystalline, mono crystalline and thin film PV. The PVsyst industrial PV system planning software solution was selected to model and simulate the entire PV system. The meteorological data used in the study are compiled from National Aeronautics and Space Administration (NASA) worldwide meteorological database. The meteorological data include 22-year monthly and annual averaged insolation incident on a horizontal surface (kwh/m2/day) and 22-year monthly averaged air temperature. A hypothetical electric load demand data is used for the simulation. According to the results, the thin film PV gave highest performance ratio (PR = 61.8%) and highest energy yield per year of 5516.8 kWh/year. However, in comparing PV generation technologies, conversion efficiency is the most important parameter to be determined. The results showed that the array efficiency of the poly crystalline and mono crystalline are comparable, whereas that of thin film is much lower, 4.10% as against the array efficiency of Poly crystalline (7.76%) and the array efficiency of mono crystalline (7.62%). Also, among the three technologies tested, the poly crystalline required minimum area of 33m2. So, the poly crystalline technology is preferred among the three PV technologies considered in this study.
Keywords: Photovoltaic, Poly Crystalline Silicon, Mono Crystalline Silicon and A-Sih Thin Film, PVSyst, Stand Alone PV System, Unit Cost Of Energy, Loss of Load Probability, Array Efficiency.
1. Introduction
years attracted more attention [9, 10, 11, 12, 13]. Today, different PV technologies have been installed for diverse applications such as power supply for consumer products, for power supply for residential buildings, water pumping and street lighting [14, 15, 16, 17]. Also, large-scale PV power generation plant installations are increasingly being deployed across the globe [18, 19, 20, 21, 2].
As the demand for photovoltaic (PV) energy supply is growing, the PV industry grows with increasing number of different PV technologies. Over the years, commercially, three different PV technologies have dominated the PV market and they include; Monocrystalline, Polycrystalline (or Multicrystalline) and Amorphous PV technologies [18, 23, 24]. The Monocrystalline is the traditional solar panel which has been commercially developed since the 1960's [18]. Monocrystalline panels are made by a single silicon crystal and they have the best space efficiency more than the other PV technologies [25,26]. Also, they are highly efficient, with module’s efficiency of up to 15% [18].
The policrystalline (also known as multicrystalline) panels emerged in commercial quantity in the late 1970’s and have become more popular over time [18]. Polycrystalline modules are made from cells containing lots of small silicon crystals. This makes them cheaper to produce but also slightly less efficient than monocrystalline modules [18, 27, 28, 29].
Thin-Film or Amorphous panels emerged commercially since the 1980's [18]. In low light, thin film panels perform better than others PV technologies [23, 18, 10, 30]. As such, thin film panels have been used in calculators and watches. However, thin film panels take up much more space than the panels of the other PV technologies [18]. Finally, although the efficiency of thin- film panels is only about 10%, they use less material and are cheaper than crystalline modules [18, 24, 31, 30].
In this paper, simulation approach is used for the comparative analysis of different PV technologies. Version 5.21 of PVsyst industrial PV system planning software solution is used to model and simulate the standalone PV (SAPV) system [32, 33, 34, 35, 36]. The PVSyst 5.21 simulation requires the meteorological data at the SAPV installation site, load demand profile and the specifications for the SAPV performance requirements, as well as the PV module specifications and specification of the other SAPV system components. Particularly, the meteorological data used in the study are compiled from National Aeronautics and Space Administration (NASA) worldwide meteorological database. The meteorological dataset includes 22-year monthly and annual averaged insolation incident on a horizontal surface (kwh/m2/day) and 22-year monthly averaged air temperature. Also, the PVSyst is used to conduct the economic analysis of the SAPV system with particular focus on the unit cost of energy generated from the SAPV for each of the PV technologies. As regards the economic analysis, PVSyst uses life cycle cost analysis approach to determine the investment cost and unit cost of the energy generated from SAPV system.
are eventually exported to Microsoft Excel software where all–in-one comparative tables and graphs are generated for the three PV technologies.
2. Methodology
2.1 Mathematical Expression For Determining The PV
Electric Daily and Yearly Energy Output Of PV Module
Generally, when PVSyst is supplied with daily or monthly average global radiation and ambient temperature data, it generates the hourly solar radiation and ambient temperature data. With these hourly data, the PVSyst simulates the daily and yearly energy output of the PV system. The mathematical relationship for estimating the daily energy production ( ) based on the hourly solar irradiance G ) at time t can be calculated as follows:
=
∑2342 ) ) ) 1 + % ! "# )− 25'( )"*+ )'"*,,)'"* - .)'"*/0)'1 (1)
where
= daily energy production of PV modules with total array power
rating of )
)= Total array power rating (kWp) at Standard Test Condition (STC)
5 678)= Peak solar radiation at Standard Test Condition (STC) =1000 w/m2
# )= PV module (cell) temperature at sampling time t
# 678)= PV module (cell) temperature at Standard Test Condition (STC) = 25°C
*+ ) = Dirt de-rate factor (per unit). Typically 0.97 for new installation.
*,,) = Module mismatch factor (per unit)
* - .) = Cable loss factor (per unit). Typically in the range of 0.95 to 0.99.
* /0) = Maximum efficiency of inverter (per unit) %9:,:) = Power temperature coefficient, (%/˚C)
Let per unit power rating of the PV array at STC be :. ;/ ). That is, per unit power is the power rating of each unit of the PV module.
Let the total number of PV module in the array be < ;/
Let the per unit area in =3 of each PV module in the array be > ;/ Let the total area in =3 of all the PV modules in the array be >
< ;/ = " FBGHI ?@ D E)?@ABBAC D E)' (2)
> = < ;/ ) > ;/ ) (3)
The mathematical relationship for estimating the yearly energy production
(EKL MNOPQM)) based on the daily energy production (EKL ROSQM)) can be calculated as follows:
2.2
The Simulation Data and Procedure
A hypothetical load demand profile is used for the comparative analysis. The load demand data is as follows;
• Total Watts/Day : 1250watts
• Number of Hours/Day: 10 hours
• Total WattsHour/Day : 12500Wh/day
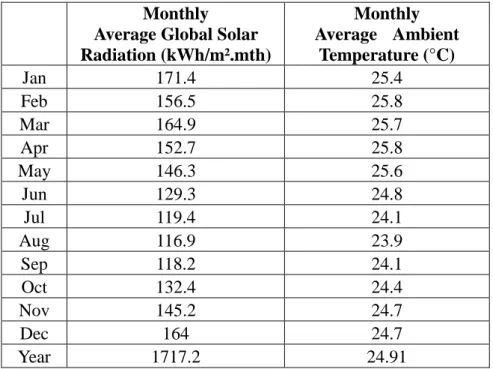
The site used in the study is at the Faculty of Engineering of Imo State University (with Latitude = 5.508331, Longitude = 7.043366). The meteorological data used are (table 1), namely, the monthly average global solar radiation on the horizontal plane and the monthly average ambient temperature.
Table 1 The meteorological data: the Monthly average global solar radiation on
the horizontal plane and the monthly average ambient temperature
Monthly Average Global Solar Radiation (kWh/m².mth)
Monthly Average Ambient
Temperature (°C)
Jan 171.4 25.4
Feb 156.5 25.8
Mar 164.9 25.7
Apr 152.7 25.8
May 146.3 25.6
Jun 129.3 24.8
Jul 119.4 24.1
Aug 116.9 23.9
Sep 118.2 24.1
Oct 132.4 24.4
Nov 145.2 24.7
Dec 164 24.7
Year 1717.2 24.91
The PVSyst is used to simulate in three different instance for the technical and economic performance parameters of a standalone PV system using one of the three PV technologies at each of the instance. During the simulation, the meteorological data from NASA website are downloaded directly into the PVSyst using the PVSyst Tools menu. Optimal tilt angle of 8° is used based on the optimal tilt angle computed from the expression 3.7 + 0.69 (latitude of the site) which gives a value of 7.5° ≈8° for the site. Furthermore, the load demand profile
3. Results and Discussions
3.1
Daily Load Demand Profile
Figure 1 is the cut section of the PVSyst result screenshot showing the daily load demand used in the study. The daily electric load demand is 1250watts that runs for an average of 10 hours per day resulting in daily energy demand of 12500Wh/day.
Figure 1 The User’s Daily Load Demand
3.2
Coordinates (Latitude and Longitude) of the Project Site
The site used in the study is at the Faculty of Engineering of Imo State University (with Latitude = 5.508331, Longitude = 7.043366), as shown in the Google map screenshot of Figure 2.Figure 2 The Google Map Coordinates For PV Installation Site at the Faculty of
Engineering of Imo State University
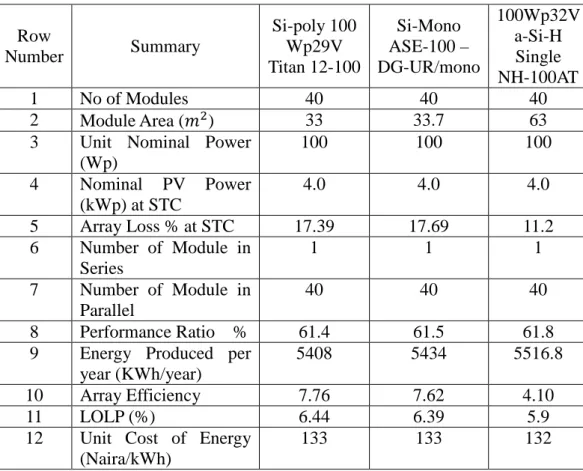
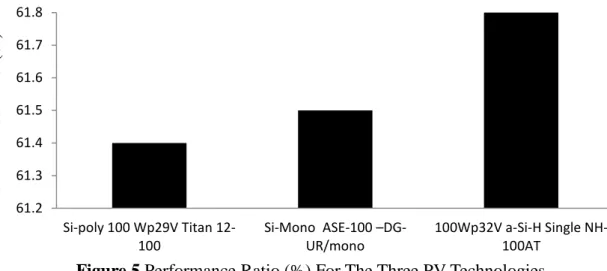
11.2% (row number 5 of Table 2 ) and the lowest loss of load probability(LOLP (%)) of 5.9% (row number 11 of Table 2 ). The thin film technology also has the lowest unit cost of energy of energy of 132 Naira/kWh (row number 12 of Table 2 and Figure 6) and the highest performance ratio of 61.8% (row number 8 of Table 2 and Figure 5). However, the thin film technology suffers from very low Array Efficiency of 4.1% (row number 10 of Table 2 and Figure 4) which resulted in excessive PV module area of 63 =3(row number 2 of Table 2 and Figure 3).
Table 2 Simulation Results For The Three PV Technologies
Row
Number Summary
Si-poly 100 Wp29V Titan 12-100
Si-Mono ASE-100 – DG-UR/mono
100Wp32V a-Si-H Single NH-100AT
1 No of Modules 40 40 40
2 Module Area (=3) 33 33.7 63
3 Unit Nominal Power
(Wp)
100 100 100
4 Nominal PV Power
(kWp) at STC
4.0 4.0 4.0
5 Array Loss % at STC 17.39 17.69 11.2
6 Number of Module in Series
1 1 1
7 Number of Module in Parallel
40 40 40
8 Performance Ratio % 61.4 61.5 61.8
9 Energy Produced per year (KWh/year)
5408 5434 5516.8
10 Array Efficiency 7.76 7.62 4.10
11 LOLP (%) 6.44 6.39 5.9
12 Unit Cost of Energy (Naira/kWh)
133 133 132
33 33.7 63 0 10 20 30 40 50 60 70
Si-poly 100 Wp29V Titan 12-100
Si-Mono ASE-100 –DG-UR/mono
100Wp32V a-Si-H Single NH-100AT M o d u le A re a in S q u ar e M e te rs
Figure 3 Module Area in Square Meters for the Three PV
Technologies 7.76 7.62 4.1 0 1 2 3 4 5 6 7 8 9
Si-poly 100 Wp29V Titan 12-100
Si-Mono ASE-100 –DG-UR/mono
100Wp32V a-Si-H Single NH-100AT A rr ay E ff ic ie n cy ( % )
Figure 4 Array Efficiency (%) for the Three PV Technologies
61.2 61.3 61.4 61.5 61.6 61.7 61.8
Si-poly 100 Wp29V Titan 12-100
Si-Mono ASE-100 –DG-UR/mono
100Wp32V a-Si-H Single NH-100AT P er for m a n ce R at io ( % )
4 Conclusion
In this paper, simulation approach is used for comparative analysis of different PV technologies, namely, poly crystalline PV technology, mono crystalline PV technology and thin film PV technology. Precisely, the PV modules used in the study are Si-poly 100 Wp29V Titan 12-100 for the poly crystalline PV technology, Si-Mono ASE-100 –DG-UR/mono for the mono crystalline PV technology and 100Wp32V a-Si-H Single NH-100AT for the thin film PV technology. Among the three PV technologies studied, the thin film PV technology has the lowest Array Loss % at STC, the lowest loss of load probability (LOLP (%)), lowest unit cost of energy of energy and the highest performance ratio. However, the downside of the thin film PV technology is that is has very low Array Efficiency and corresponding very large area (space) requirement for the PV module installation. On the other hand, the poly crystalline PV technology has very high array efficiency and corresponding very low area (space) requirement for the PV module installation. In all, the poly crystalline PV technology is the preferred PV technology for the PV installation site considered.
References
[1]Coyle, E. D., & Simmons, R. A. (2014). Understanding the global energy crisis (p. 318). Purdue University Press.
[2]Mitigation, C. C. (2011). Renewable Energy Sources and Climate Change Mitigation. IPCC special report on.
[3]Taute, I. R. S. (2014). Low-Carbon Development in Latin America and the Caribbean: Evolution, experiences and challenges, Practical Action Consulting, Latin America, p. 40.
[4]Tampier, M., (2002). Promoting green power in Canada. Pollution-Probe, Toronto, p. 209.
[5]Jaeger, B., & Machry, P. (2014). Energy Transition and Challenges for the 21st Century. IUFGSMUIN Model United Nations, 2, 337-374.
133 133
132
131.5 132 132.5 133 133.5
Si-Mono ASE-100 –DG-UR/mono
Si-poly 100 Wp29V Titan 12-100
100Wp32V a-Si-H Single NH-100AT
U
n
it
c
os
t
of
e
n
er
gy
(N
ai
ra/
K
Wh
)
Figure 6 Unit cost of energy (Naira/KWh) For The Three PV
[6]Van Der Horst, D., & Vermeylen, S. (2008, July). The New Energy Commons: Exploring the Role of Property regimes in the Development of renewable Energy Systems. In 12th Biennial Conference of the International Association for the Study of Commons (pp. 14-18).
[7]European Wind Energy Association. (2009). The economics of wind energy. A report by the European Wind Energy Association.
[8]Bohdanowicz, P., Churie-Kallhauge, A., and Martinac, I. (2001). Energy-efficiency and conservation in hotels–towards sustainable tourism. 4º Simpósio Internacional em Arquitetura da Ásia e Pacífico, Havaí.
[9]Jiang, J. A., Liang, Y. T., Wang, J. C., Su, Y. L., Kuo, K. C., & Shieh, J. C. (2014). A novel analytical model for determining the maximum power point of thin film photovoltaic module. Progress in Photovoltaics: Research and Applications, 22(3), 318-331.
[10]Chu, Y. (2011). Review and comparison of different solar energy technologies. Global Energy Network Institute (GENI), San Diego, CA.
[11]Tan, L., Sun, H., Ye, X., Liu, Y., & Su, J. (2014). Comparing the Evolution of Crystalline Silicon Photovoltaic Cells: Technological Route and National Specialization. Energy Procedia, 61, 1807-1811.
[12]Vidican, G. (2009). Innovation Systems in the Solar Photovoltaic Industry: The Role of Public Research Institutions, 1-12.
[13]Kurtz, S. R. (2009). Opportunities and challenges for development of a mature concentrating photovoltaic power industry. National Renewable Energy Laboratory.
[14]Eronini, N. (2014). The Adoption of Solar Photovoltaic Systems among Industries and Residential houses in Southern Nigeria (Doctoral dissertation, Mid Sweden University).
[15]Parkinson, H., & Lloyd, H. (1997). DTI programme activities in building integrated photovoltaics–opportunities and challenges. Proceedings of the ICBEST, 97, 53-64.
[16]Miles, R. W., Hynes, K. M., & Forbes, I. (2005). Photovoltaic solar cells: An overview of state-of-the-art cell development and environmental issues. Progress in Crystal Growth and Characterization of Materials, 51(1), 1-42.
[17]Partain, L. D. (1995). Solar cell fundamentals. Solar Cells and Their Applications, ed. LD Partain (Wiley, New York, 1995) pp, 1-51.
[18]Anfuso M. and Ruscica S. (2014) The different type of photovoltaic systems and their applications. RenovEnergia’14, Renewable Energies and Energy
Transition. C1.5 (RE 56)-1/3. Available at:
https://2100.org/renovenergia/annexes/Sessions/5.4_Session_C1/C1.5/C1.5_t ext.pdf. Accessed on 16th February 2016.
[19]Grau, T. (2014). Comparison of feed-in tariffs and tenders to remunerate solar power generation, DIW Berlin, p. 31.
[21]Campbell, M., Aschenbrenner, P., Blunden, J., Smeloff, E., & Wright, S. (2008). The drivers of the levelized cost of electricity for utility-scale photovoltaics. White Paper: SunPower Corporation.
[22]Denholm P. and R. Margolis (2006), Very Large Scale Deployment of Grid-Connected Solar PhotoVoltaics in the United States: Challenges and Opportunities. NREL Conference Paper CP-620-39683, April 2006.
[23]Makrides, G., Zinsser, B., Georghiou, G. E., & Norton, M. (2012). Performance of photovoltaics under actual operating conditions. INTECH Open Access Publisher.
[24]Avrutin, V., Izyumskaya, N., & Morkoç, H. (2014). Amorphous and micromorph Si solar cells: current status and outlook. Turkish Journal of Physics, 38(3), 526-542.
[25]Saga, T. (2010). Crystalline and Polycrystalline Silicon PV Technology. NPG Asia mater, 2(3), 96-102.
[26]Glunz, S. W., Preu, R., & Biro, D. (2012). .16: Crystalline Silicon Solar Cells– State-of-the-Art and Future Developments. Comprehensive renewable energy, 1, 353-387.
[27]Aman, M. M., Solangi, K. H., Hossain, M. S., Badarudin, A., Jasmon, G. B., Mokhlis, H., ... & Kazi, S. N. (2015). A review of Safety, Health and Environmental (SHE) issues of solar energy system. Renewable and Sustainable Energy Reviews, 41, 1190-1204.
[28]El-Ghonemy, A. M. K. (2012). Photovoltaic solar energy: review. International Journal of Scientific & Engineering Research, 3(11), 1-43.
[29]Axelsson, K., Ekblom, T., & Olsson, A. (2013). How to supply bus stops with electricity without connecting them to the electricity grid. Bachelor’s degree Thesis.
[30]Jordan, D. C., & Kurtz, S. R. (2013). Photovoltaic degradation rates—an analytical review. Progress in photovoltaics: Research and Applications, 21(1), 12-29.
[31]Yamamoto, K. (2003). Thin-film crystalline silicon solar cells. JSAP Int, 7, 12-19.
[32]PVsyst, S.A. (2011). PV-syst 5.73, Photovoltaic System Software A. Mermoud (Ed), University of Geneva.
[33]PVSyst, S.A. (2014). PVSyst. Download PVSYST, http://www. pvsyst. com.
[34]Karki, P., Adhikary, B., & Sherpa, K. (2012, September). Comparative study of grid-tied photovoltaic (PV) system in Kathmandu and Berlin using PVsyst. In Sustainable Energy Technologies (ICSET), 2012 IEEE Third International Conference on (pp. 196-199). IEEE.
[36]Mermoud, A. (2010). Modeling Systems Losses in PVsyst. Institute of the Environmental Sciences Group of energy–PVsyst, Universitè de Genève.