keratinocytes in the lower layer of the epidermis undergo terminal differentiation and transform into corneocytes (1). During this differentiation process, lipids are synthe-sized, stored in lamellar bodies and, at the interface be-tween the viable epidermis and SC, these lamellar bodies are secreted in the intercellular regions (2). The secreted lipids form an extracellular lipid matrix crucial for a proper skin barrier (3, 4). Three main lipid classes have been iden-tified: cholesterol, fatty acids, and ceramides. The latter constitutes the group of SC lipids that have the most diverse chemical structure. Their building blocks are an array of sphingoid bases and acyl chains chemically linked together by an amide bond, resulting in 16 ceramide subclasses (5). Both chains (the sphingoid base and acyl chain) can vary substantially in carbon chain length. The composition of the SC ceramide fraction (the ceramide profile) has been correlated with and shown to be important for lipid organi-zation and skin barrier function (6–8). In the present study, the effect of a ceramide-containing formulation on skin barrier recovery, ceramide composition, and lipid or-ganization were studied.
Through the processes of cornification and desquama-tion, the SC is continuously rejuvenated (9, 10) and can thereby quickly recover the barrier function after disrup-tion (11). An impaired skin barrier funcdisrup-tion is encoun-tered in several inflammatory skin diseases, one of which is atopic dermatitis (AD). In AD, an inadequate recovery of the impaired skin barrier perpetuates the condition. Nor-malization of the barrier function in AD is crucial to re-duce the penetration of irritants and allergens into the
Abstract Restoring the lipid homeostasis of the stratum corneum (SC) is a common strategy to enhance skin barrier function. Here, we used a ceramide containing vernix case-osa (VC)-based formulation and were able to accelerate bar-rier recovery in healthy volunteers. The recovery was examined over 16 days by monitoring trans-epidermal water loss (TEWL) after barrier disruption by tape-stripping. Four skin sites were used to examine the effects of both treatment and barrier recovery. After 16 days, samples were harvested at these sites to examine the SC ceramide composition and lipid organization. Changes in ceramide profiles were identi-fied using principal component analysis. After barrier recov-ery, the untreated sites showed increased levels of ceramide subclass AS and ceramides with a 34 total carbon-atom chain length, while the mean ceramide chain length was reduced. These changes were diminished by treatment with the stud-ied formulation, which concurrently increased the for-mulated ceramides. Correlations were observed between SC lipid composition, lipid organization, and TEWL, and changes in the ceramide subclass composition suggest changes in the ceramide biosynthesis. These results sug-gest that VC-based formulations enhance skin barrier recov-ery and are attractive candidates to treat skin disorders with impaired barrier properties.—Boiten, W. A., T. Berkers, S. Absalah, J. van Smeden, A. P. M. Lavrijsen, and J. A. Bouwstra.
Applying a vernix caseosa based formulation accelerates skin barrier repair by modulating lipid biosynthesis. J. Lipid Res. 2018. 59: 250–260.
Supplementary key words epidermis • clinical study • mass spectrom
-etry • lipidomics • sphingolipids • lipid organization • barrier recovery • stratum corneum • treatment
Vital functions of the stratum corneum (SC) include preventing excessive water loss from the body and pro-tecting the body from the hostile outside environment by acting as an inside-out and an outside-in barrier, respec-tively. The SC is generated by a dynamic process in which
This research is supported by the Dutch Technology Foundation STW (project number 12400), which is part of the Netherlands Organization for Scientific Research (NWO), and which is partly funded by the Ministry of Economic Affairs. Manuscript received 8 August 2017 and in revised form 8 November 2017. Published, JLR Papers in Press, December 7, 2017
DOI https://doi.org/10.1194/jlr.M079186
Applying a vernix caseosa based formulation accelerates
skin barrier repair by modulating lipid biosynthesis
Walter A. Boiten,1,* Tineke Berkers,1,* Samira Absalah,* Jeroen van Smeden,*
Adriana P. M. Lavrijsen,† and Joke A. Bouwstra2,*
Leiden Academic Centre for Drug Research,* Leiden University, Leiden, The Netherlands; and Department of Dermatology,† Leiden University Medical Centre, Leiden, The Netherlands
Abbreviations: AD, atopic dermatitis; ATR-FTIR, total reflection Fourier transform infrared spectroscopy; AUC, area under the barrier recovery curve; C34, ceramides with a total carbon chain length of 34 carbons; FWHM, full width at half maximum; LMM, linear mixed model; PC, principal component; PCA, principal component analysis; SAXD, small angle X-ray diffraction; SC, stratum corneum; SQ, Squame-Scan value; TEWL, trans-epidermal water loss; VC, vernix caseosa.
1
W.A. Boiten and T. Berkers contributed equally to this work.
2 To whom correspondence should be addressed.
e-mail: [email protected]
The online version of this article (available at http://www.jlr.org) contains a supplement.
at Walaeus Library / BIN 299, on March 28, 2018
www.jlr.org
skin. Application of lipophilic formulations that act as an additional barrier is a common treatment (12–15). An-other approach aims at normalization of ceramide compo-sition (4). Changes in this compocompo-sition were correlated to the reduced skin barrier function in AD (8, 16, 17). Previ-ously, ceramide-containing formulations have been used to study skin barrier repair (18–21) and it was reported that the ratios between the three main SC lipids in a formula-tion was important for short-term recovery (22). Further-more, it was suggested that long-term application could enhance barrier recovery (21). Nonetheless, it is disputed whether ceramides in a formulation actually normalize SC lipid composition or remain on the skin surface (23). It has been shown that the orally administered essential fatty ac-ids were incorporated in the epidermis (24).
How these formulations accelerate barrier recovery is not clearly understood. Therefore, the primary aim of this study was to examine how treatment with a formulation during barrier recovery affects SC lipid composition and subsequently lipid organization. This was done by exam-ining the normal physiological responses in healthy vol-unteers. In this study, we applied a ceramide-containing formulation based on the composition of the vernix case-osa (VC). This is a natural ceramide-containing formula-tion that serves as a protective lipid film covering the fetus in the last trimester of pregnancy and during delivery (25). Previously, it was shown that VC-like formulations were able to significantly accelerate barrier recovery in mice (26, 27). This vernix formulation has the advantage that ceramides can be formulated into it. The formulation is semi-occlusive (28). To examine the effect of the formula-tion on barrier recovery, we used barrier disrupformula-tion by tape-stripping, as this is an effective way to remove the barrier and induce barrier recovery in healthy skin (27, 29–32).
Here, it is shown that treatment with the formulation re-sulted in accelerated barrier recovery of tape-stripped skin compared with untreated tape-stripped skin. In regener-ated untreregener-ated SC, an altered ceramide composition was observed. These alterations correlated to a decrease in skin barrier function. When applying the ceramide-containing formulation, the ceramide composition was modulated to-ward a ceramide composition more closely mimicking that of control skin. Combined, these results indicate that bar-rier disruption induces changes in lipid processing during recovery, related to a decreased barrier function and that these changes in lipid processing can be modulated by application of the VC formulation.
MATERIALS AND METHoDS
Chemicals
The following solvents were used for lipid extraction and analy-sis: Millipore water (18.2 m), HPLC-grade methanol and chloro-form from Lab-Scan (Gliwice, Poland), UPLC-grade isopropanol and ethanol from Biosolve (Valkenswaard, The Netherlands), and HPLC-grade heptane from Actu-All (oss, The Netherlands). The synthetic ceramides listed in supplemental Table S1 were used as calibrators for the LC/MS analysis. Trypsin and trypsin
inhibitor for SC isolation were purchased from Sigma-Aldrich (Zwijndrecht, The Netherlands).
Clinical study design
The clinical study was approved by the Leiden University Medi-cal Center EthiMedi-cal Committee and performed according to the Declaration of Helsinki. All volunteers signed an informed con-sent. Eight female and 7 male Caucasian volunteers, aged 18 to 29 years (mean age 23 years), were recruited and checked by a der-matologist. Volunteers were excluded if they had dermatological disorders or a history of dermatological disorders, suffered from chronic inflammatory diseases, used systemic drug therapies, had abundant hair or unnatural abnormalities on the ventral fore-arms, had a history of drug abuse, or if they were pregnant. All enrolled volunteers completed the clinical study.
Figure 1A depicts the timeline of the study. Before the study commenced, volunteers had a 1 week washout period in which no soaps or cosmetics were applied on the ventral forearms. At time point (td0) a site of 3.5 by 2.5 cm of SC was removed at both ventral
forearms by consecutive tape-stripping using DSquame tape (Cu-derm, Dallas). The tape-stripping continued until the site ap-peared shiny (33) and a trans-epidermal water loss (TEWL) of > 60 g/m2/h was reached (these sites are henceforth referred to as
stripped). TEWL was measured using AquaFlux AF200 (BIoX, London, UK). Thereafter, two fingertip units of a VC-like formu-lation (composition is shown in supplemental Table S2) were applied twice daily for 14 days on one ventral forearm (referred to as treated), followed by a 2 day washout period. Treatment alloca-tion to either left or right arm was alternated between volunteers. Figure 1B depicts the four sites investigated in this study: control (no treatment, no tape-stripping), treated (treated with formu-lation), stripped (tape-stripped at tD0), and stripped+treated
(tape-stripped at TD0 and treated with formulation). At the final
time point (tD16) 21 tape strips, using polyphenylene sulfide tape
(Nichiban, Tokyo, Japan), were harvested at all four sites. The amount of SC on each tape strip was determined by measuring the tape strips with a SquameScan (Heiland Electronic, Wetzlar, Germany). Tape-strip zero was discarded. After every other tape strip, an infrared spectrum of the tape-stripped skin region was made (section 2.5). After tape-stripping, a 4 mm biopsy of both recovered sites was collected, near the site where Nichiban tape strips were harvested, to perform small angle X-ray diffraction (SAXD; see the section by this name below). During the study, TEWL of all sites was monitored at distinct time points; measure-ments were performed before formulation application.
TEWL measurements to determine barrier recovery
To determine barrier recovery of the stripped sites, TEWL was monitored. At each time point depicted in Fig. 1C, TEWL was measured at three different sections of each site (supplemental Figure S1). The barrier recovery percentage was calculated by de-fining the average of three TEWL measurements at the non-stripped sites as 100% barrier and TEWL at the non-stripped sites directly after tape-stripping as 0% barrier. The following equation was used (26):
( )
( )
= ×
time point
0 (time point)
0 time point
Recovery %
(TEWL T – TEWL T )
100 (TEWL T – Average TEWL nonstripped siteT )
For each volunteer, several values were calculated for both the treated and untreated stripped sites: i) the recovery percentage of the site at three sections at each time-point; ii) the mean of the three previous values; iii) the area under the barrier recovery curve (AUC) of the means over time, using a point-to-point linear
at Walaeus Library / BIN 299, on March 28, 2018
www.jlr.org
Downloaded from
.html
fit; iv) using the same fit, the time it took to reach designated recovery percentages between 5 and 100%, with increments of 5%; and v) the difference in time between the stripped and stripped+treated sites at each of the previously mentioned recov-ery percentage. Recovrecov-ery percentages >90% were excluded, as only 5 volunteers reached these values at both stripped sites, bias-ing these data.
Quantification of ceramides by LC/MS
Tape-stripped SC can be used to examine the lipid content by mass spectrometry (34–36). Samples for ceramide analysis by LC/ MS were prepared from tape-strips 5–8 and 17–20, harvested at the four sites on tD16. Samples prepared from tape strips 5–8 and
17–20 were analyzed separately to determine if the SC ceramide composition generated in the initial stage of the recovery process (tapes 5–8) was different from that generated in later stages of the recovery process (tapes 17–20). Tape strips were punched to an area of 2 cm2, extracted, analyzed, and quantified as described in
Boiten et al. (34). Briefly, a modified four-step Bligh and Dyer extraction at 40°C was performed. Extracts were analyzed using an Acquity UPLC H-class (Waters, Milford, MA) connected to an XEVo TQ-S mass spectrometer (Waters). Separation was per-formed on a pva-silica column (5 m particles, 100 × 2.1 mm in-ner diameter; YMC, Kyoto, Japan). Using the calibrators, a response model was build and used to quantify the ceramides in the analyzed samples. All data were corrected for the cumulative SquameScan value (SQ) of the four tape strips comprising the corresponding sample. The data resulted in quantitative SC ce-ramide profiles for each volunteer, at all four sites, and at two depths per site. Ceramides are named according to hydrophilic head group (subclass) and chain length (e.g., NS C42, ceramide subclass NS with a total chain length of 42 carbon atoms) (37). For an overview of subclasses and ceramide structures, see supple-mental Fig. S2.
Quantitative data were used to calculate several parameters. Ceramides EoS C66 and NS C40 (supplied in the formulation) were excluded from these calculations. The following parameters were calculated: i) total amount of the individual subclasses (ng/SQ); ii) total amount of ceramides with a total chain length 34 carbons (ng/SQ); iii) mean carbon chain length:
( )
each ceramide molar amount ceramide carbon chain length
total molar amount all ceramides ×
∑
; andiv) percentage of Eo ceramides, as ng Eo/total ng ceramides;
Lateral organization and conformational ordering of SC lipids
The lateral organization and conformational ordering of the SC lipids were examined by attenuated total reflection Fou-rier transform infrared spectroscopy (ATR-FTIR). FTIR spectra were collected using a Varian 670-IR spectrometer (Agilent Technologies, Inc., Santa Clara, CA) equipped with a mercury-cadmium-telluride detector and an external sample compartment containing an ATR accessory (GladiATR, PIKE Technologies, Madison, WI) with a single reflection diamond. The sample compartment was constantly purged with dry air. Each spec-trum was an average of 150 scans, with a spectral resolution of 2 cm1. Conformational ordering of the lipids was determined
using the center of gravity of the peak of the CH2 symmetric
stretching vibrations at 90% of the peak height. The bandwidth from the second derivative of the CH2 scissoring region was
se-lected as a measure for lateral packing of the lipids and deter-mined as described previously (38, 39). CH2 stretching vibration
peak position values <2850 cm1 indicate an ordered phase,
whereas values above 2852 cm1 indicate a high degree of
disor-dering, being a liquid phase. The second derivative of the CH2
scissoring region was baseline-corrected between the endpoints of the scissoring region (1460–1480 cm1) and the full width
at half maximum (FWHM) was calculated (39). Values of 5 spectra (tape 2–10 and tape 12–20) per site per volunteer were used for the analyses.
SAXD
SC isolated from biopsies harvested at stripped and stripped+ treated sites were examined by SAXD. SAXD was used to deter-mine the SC lipids lamellar organization. To isolate SC for SAXD analysis, biopsies were placed overnight in a 0.1% trypsin solu-tion in PBS at 4°C, followed by 1 h incubasolu-tion at 37°C. The SC was peeled off and washed in 0.1% trypsin inhibitor solution in PBS and twice in Millipore water. Dried SC sheets were stored under argon and over silica gel until use. All SAXD measurements were performed at the European Synchrotron Radiation Facility (Grenoble, France) at station BM26B. SAXD patterns were col-lected on a Pilatus 1M detector at room temperature for 5 min. The sample-to-detector distance was 2 m. Prior to data collection, the SC samples were hydrated over a 27% (w/v) NaBr solution for 24 h at room temperature. The scattering intensity I (arbitrary units) was measured as a function of the scattering vector q (in Fig. 1. Study design. A: Timeline of the clinical study (Time points are indicated as t with days as subscripts). Volunteers were first screened by a dermatologist (tD-7), followed by a 1-week washout period. At tD0 the SC was removed by tape-stripping. The formulation was applied two
times daily for 2 weeks followed by 2 days washout. The activities and measurements are indicated at each time point (tD-7 to tD16). At all
indi-cated time points, TEWL was measured, except for tD-7. B: The studied sites on the ventral forearms. on both arms, one site was tape-stripped;
on one arm, formulation was applied. C: The time points at which TEWL was measured to monitor barrier recovery of the stripped sites.
at Walaeus Library / BIN 299, on March 28, 2018
www.jlr.org
nm1), defined as:
π θ
λ 4 sin( ) q=
, in which is the scattering angle and is the wavelength. From the position of the main peak (re-ferred to as peak 2 with position q2), the spacing (d) of the lipid
lamellae was calculated using d 2π q2
= . As in SC, this peak position
is determined by the structure of the two lamellar phases; a change in the spacing indicates a change in these lamellar phases (8).
Software and statistical analysis
All LC/MS data were processed using MassLynx and Target-Lynx software (V4.1 SCN 843, Waters Inc.). FTIR data were processed and analyzed using Resolutions Pro 4.1 (Agilent Tech-nologies, Inc.). Principal component analysis (PCA) is a com-monly used analysis of lipidomics data sets (40, 41). It is a mathematical dimensional reduction that can effectively visualize variation and the difference between samples in large data sets by reducing all variables to principal components (PCs). PCA was performed using Multibase add-in for Excel (NumericalDynam-ics.Com). For PCA, the quantitative data obtained from the ce-ramide analyses were normalized to the total amount of cerami des in the samples. The four individual sites (control, treated, stripped, and stripped+treated) of each volunteer were defined as “PCA samples”. All quantified ceramides at both depths were defined as variables of that PCA sample (total of 584 variables), thereafter the mean of each ceramide/variable in all PCA samples was cen-tered at zero (subtracting the mean).
Correlation analysis and point-to-points fits were performed us-ing GraphPad Prism (V6.05, Graphpad). Group-wise comparisons were performed using linear mixed models (LMMs) in SPSS (V24 IBM). All measurements within the same subject were treated as repeated measurement. LMMs were used because these models have the advantage that the effect size of individual variables and their interactions can be examined, and they can handle missing data (42). Supplemental Fig. S3 explains how the LMMs were used here. All interactions between fixed variables were included in the first run of a model and when nonsignificants (P > 0.05) were taken out one by one. Significance levels are indicated as followed: * (P < 0.05), ** (P < 0.01), *** (P < 0.005), and **** (P < 0.001).
RESULTS
Barrier recovery in healthy volunteers
To determine the effect of the formulation on barrier recovery, changes in skin barrier over time (measured as TEWL and expressed as recovery percentage) were exam-ined. Figure 2A shows a typical example of barrier recovery percentage as function of time for untreated and treated stripped sites of one volunteer. After 16 days, all volunteers had reached a recovery % >85 at both sites. For each volun-teer, the AUC was calculated of both the untreated and treated stripped sites (Fig. 2B). A larger AUC implies less barrier dysfunction during the 16 days. Treatment with the formulation significant increased the AUC, indicating in-creased recovery.
However, the AUC does not take into account the kinet-ics of the recovery process. To determine whether treat-ment accelerated barrier recovery, differences in time between untreated and treated stripped sites were exam-ined at multiple designated recovery percentages (t in Fig. 2A). Figure 2C depicts the median and interquartile range of t at different recovery percentages for all volun-teers. A median of zero would indicate no change in recov-ery time due to treatment. A positive deviation from zero was observed at almost all recovery percentages with a spike at 25% and a steady increase above 50%. Treatment significantly accelerated barrier recovery ending with a >2 days faster median recovery. For control, both the AUC and the t were tested for correlation to the TEWL di-rectly after tape-stripping (supplemental Table S3). No correlations were observed, indicating that these param-eters were not dependent on the amount of barrier disruption.
Principle component analysis of ceramide profiles
To gain insight into differences between the ceramide profiles of the four different sites, PCA was performed on the quantitative ceramide data. Figure 3A depicts the
Fig. 2. The effect of treatment on barrier recovery. A: The typical elapse of barrier recovery over time for untreated and treated stripped sites for a single volunteer. Points are means (±SD) of three measurements within one site. Lines are point-to-point connections. The dotted line indicated the difference in time (t) between the untreated and treated curve at a designated recovery percentage. B: The AUCs/1000 for all volunteers. Lines connect data points of the same volunteer. A paired t-test showed significant increase at the treated sites. C: The t for all volunteers at recovery percentages between 5 and 90%. The data were nonnormally distributed and are shown as median and inter-quartile range. Deviations from zero were tested with a Wilcoxon signed-rank test.
at Walaeus Library / BIN 299, on March 28, 2018
www.jlr.org
Downloaded from
.html
variable loadings, indicating how strongly each variable (ceramides detected in the samples) correlated to PC1 and PC2. If the value is higher (deviates from center of the graph in x or y position), it has contributed more to the variation explained by PC1 or PC2, respectively. The 10 variables with the highest correlation coefficients are indi-cated in the plot. PC1 and PC2 explained a total inertia (variance) of 66.3%. Figure 3B shows the plot of the PCA samples, depicting the PC1 and PC2 scores of each PCA sample. Samples were assigned to clusters corresponding to the four sites indicated by different colors. Separation between clusters was observed, demonstrating that tion between the ceramide profiles corresponded to varia-tion between samples of different sites. Therefore, changes in ceramide profile due to treatment and tape-stripping can be explained by the variable loadings of the PCs.
Clusters of treated sites were separated from untreated sites as depicted in Fig. 3B. By examining plot 3A it can be seen that this was primarily due to four variables. These variables corresponded to the two formulated ceramides (NS C40 and EoS C66) detected in samples of both depths. The PCA demonstrated that a large part of the variation in the ceramide profiles was due to the two ceramides in the formulation. The increase due to formulation application of these naturally occurring ceramides was examined. Sup-plemental Fig. S4 shows that the amount at treated sites was increased at both tape-stripping depths. An LMM of the logarithm of these amounts confirmed these observations (supplemental Table S4).
Next, separation of clusters corresponding to stripped and nonstripped sites was investigated. Variables correlat-ing strongly to PC2 were primarily responsible for the ob-served separation (supplemental Fig. S5 shows a complete graphic overview of the PC2 loadings). When examining the loadings of PC2, highly positive correlations were ob-served for ceramides of subclass AS and, to a lesser extent, ceramides for subclass NS. Highly negative correlations were observed for ceramides from subclass NP. Changes in ceramide profile were observed between the different sites. In the next section, the results of the PCA were used as leads to investigate whether these changes correlated to changes in barrier function and the recovery process.
Correlations between ceramide profile and barrier function
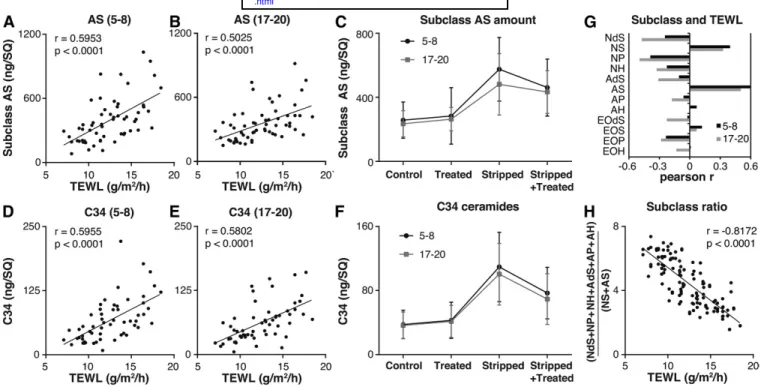
To investigate whether barrier function correlated to changes in SC ceramide profile, changes in ceramides AS
and NS, identified by PCA, were correlated to the TEWL at Td16 (supplemental Fig. S6 shows the TEWL at tD16).
Figure 4A and B depicts these correlations for the total
amount of subclass AS. At both depths, a significant posi-tive correlation between the amount of subclass AS and TEWL was observed. This illustrates that an increase in sub-class AS correlated with reduced skin barrier function. Next, it was examined whether stripping, treatment, SC depth, or the interaction between these conditions had an effect on the amount of subclass AS, using an LMM. The model used stripped, treated, and depth as fixed factors and subject as a random factor. Table 1 depicts the effect sizes obtained with the model. Figure 4C depicts the mean (±SD) of the amount of subclass AS measured at all four sites at both depths. Using the model, it was determined that subclass AS increased significantly at stripped sites. Treatment or depth alone showed no significant effects compared with the control. However, at the stripped site, treatment did have a significant effect. The interaction stripped*treated in Table 1 illustrates this effect. When subjected to strip-ping and treatment, the amount of AS changed by the ef-fect sizes of stripped and treatment; in addition to both effects, the interaction term stripped*treated is added. At stripped+treated sites, treatment significantly reduced the increase in AS observed due to stripping with 81.2 ng/SQ (treatment + stripped*treated). Similar results were ob-tained when examining NS C44 (supplemental Fig. S7 and Table 1). It was decided not to use the total amount of sub-class NS, as this value was influenced by ceramide NS C40 in the formulation. NS C44 was the most abundantly pres-ent of the NS ceramide subclass members and was chosen as a proper representative of subclass NS.
Besides subclasses, ceramide chain lengths, especially ce-ramides with a total carbon chain length of 34 carbons (C34), are known to correlate to barrier dysfunction (17). Here, a significant positive correlation was observed be-tween the total amount of C34 ceramides (sum of the amounts of NdS, NS, NP, NH, AdS, AS, AP, and AH with a total of 34 carbons) and TEWL, at both depths (Fig. 4D, E), demonstrating that higher levels of C34 ceramides corre-lated with reduced barrier function at day 16. A similar LMM as that of subclass AS and NS 44 was built for C34 ceramides (Table 1). The total amount of C34 ceramides at the four sites at two depths was plotted as the mean ± SD in Fig. 4F. By using the model, a significant increase at the stripped sites was observed. Comparable to subclass AS, treatment only significantly affected the stripped+treated Fig. 3. PCA of all SC ceramides and the amount of ceramides NS C40 and EoS C66. A: The PCA loading plot. Inertia per PC is indicted as percent variation. Variables are all ceramides quantified in samples ob-tained from tape-strips 5–8 and 17–20; the latter are indicated with a 2 after the subclass name. B: A plot of the PCA samples (the four sites of all volunteers). The samples were clustered per site.
at Walaeus Library / BIN 299, on March 28, 2018
www.jlr.org
sites. Treatment reduced the increase in C34 ceramides with 31.6 ng/SQ compared with stripped sites.
Next, the correlation of each subclass to TEWL was ex-amined (Fig. 4G: Pearson r for each subclass). This correla-tion underlined the observacorrela-tions with PCA, where subclass NS and AS had a positive correlation and subclass NP a negative correlation to PC2. Both subclasses NS and AS have a distinct synthesis route different from subclasses NP and AP; this suggested a ratio dividing the subclasses as
fol-lows: + + + + +
+
NdS NP NH AdS AP AH
NS AS
. This ratio correlated to TEWL (Fig. 4G) even for the samples of each site inde-pendently. Together, these data showed that i) barrier function correlated to the ratio of ceramide subclasses from different synthesis routes, ii) certain ceramide subgroups
were increased in stripped SC, iii) the amount of these sub-groups correlated to TEWL, and iv) treatment was able to reduce the increase of these ceramide subgroups that cor-relate positively to an increased TEWL (AS, NS 44, and C34 ceramides).
Mean carbon chain length and spacing related to the lamellar phases
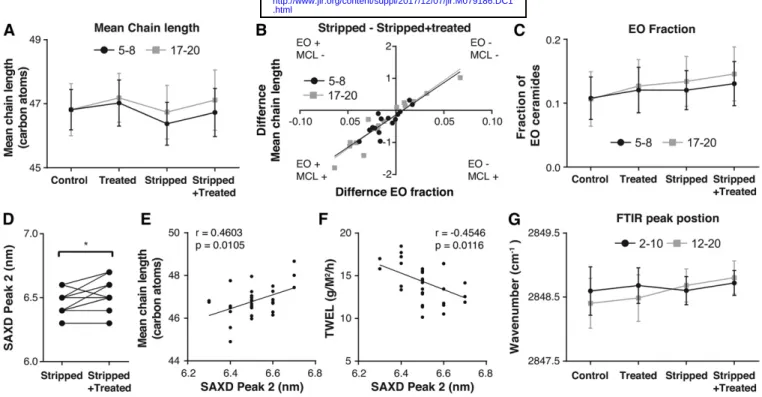
Previous studies have shown that the main ceramide chain length is an important parameter of the SC ceramide fraction (43). For this reason, it was decided to study whether a correlation existed between mean chain length and both the Eo ceramide fraction and lamellar spacing.
Figure 5A shows the mean chain length of the ceramides in
samples prepared from tapes 5–8 and 17–20. A similar Fig. 4. The effect of treatment on ceramide groups correlating to barrier function. A, B: Correlations between TEWL and the amount of subclass AS (ng/SQ). The Pearson r and P are indicated (A: Samples of tape-strips 5–8; B: Samples of tape-strips 17–20). C: The amount subclass AS (ng/SQ) at all sites at depths of both 5–8 and 17–20 tape-strips (mean ± SD). Effect size was determined with an LMM. D, E: Correlations between TEWL and the amount of ceramides with a chain length of 34 carbon atoms (ng/SQ). The Pearson r and P are indi-cated (D: Samples of tape-strips 5–8; E: Samples of tape-strips 17–20). F: The amount of ceramides with a chain length of 34 carbon atoms (ng/SQ) at all sites at depths of both 5–8 and 17–20 tape-strips (mean ±SD). Effect size was determined with a linear mixed model. G: Pearson r of the correlation between TEWL and the total amount of each subclass at all sites at depths of both 5–8 and 17–20 tape-strips. H: The cor-relation between TEWL and ratio of subclasses NdS + NP + NH + AdS + AP + AH
NS + AS
of both depths, excluding NS C40. Pearson r per site were:
control, 0.648; stripped, 0.808; treated,0.729; and stripped+treated, 0.694. All statistical outputs of the LMM are found in Table 1.
TABLE 1. The output of the LMMs per ceramide subgroup
Subclass AS Ceramide NS C44 C34 ceramides
Estimate P Estimate P Estimate P
Intercept (control) 267.1 <0.001 56.6 <0.001 39.4 <0.001
Effect size Stripped +281.5 <0.001 +56.4 <0.001 +68.0 <0.001
Treated +27.3 0.403 +7.2 0.194 +5.6 0.438
Depth 17-20 41.3 0.076 2.1 0.597 5.2 0.297
Interactions Stripped*Treated 108.5 0.020 19.5 0.013 37.2 <0.001
The intercept is the estimated amount at the control site at a depth of the 5–8 tape-strips. Estimates are in ng/SQ. The effect size is the amount in ng/SQ with which the variable changes the intercept. Significance levels of all effect sizes and interaction are given.
at Walaeus Library / BIN 299, on March 28, 2018
www.jlr.org
Downloaded from
.html
LMM as for subclass AS was made (Table 2). This showed that stripping decreased the mean chain length significantly. Treatment was able to increase the mean chain length, re-storing the mean chain length at the stripped+treated sites. The increase in mean chain length of the stripped+treated sites could be due to an increase in the fraction of esteri-fied omega-acyl-ceramide (Eo fraction) (supplemental Fig. S8 shows this correlation per site). Changes in Eo frac-tion due to treatment of the stripped site (stripped
stripped+treated) correlated to changes in the mean chain length due to treatment of the stripped site (Fig. 5B). Treat-ment was able to increase the Eo fraction significantly (Fig. 5C and Table 2 show the Eo fraction and the output of LMM, respectively).
The carbon chain length of the ceramides could influence the spacing of the strong diffraction peak in the diffraction
pattern as measured by SAXD. From the position of the strong diffraction peak in the X-ray diffraction curve (peak 2), the corresponding spacing was calculated (referred to as peak 2 in Fig. 5D). A significant increase in spacing due to treatment was observed and a positive correlation was ob-served between the mean chain length and the spacing (Fig. 5E). When comparing the spacing to TEWL, a corre-lation was observed between an increased TEWL and a de-crease in spacing (Fig. 5F). Stripping and treatment thus affected the mean chain length, which correlated to Eo fraction and the lamellar spacing.
Effects of stripping and treatment on lateral packing
Next to lamellar spacing, lateral packing is important for a proper barrier function. For this reason, the effect of treatment and stripping on lateral packing was also Fig. 5. Mean chain length and lamellar spacing. A: The mean total chain length (carbon atoms) for the four different sites at two depths excluding the ceramides of the formulation in the calculation. Data were compared using an LMM. B: The correlation between changes in fraction Eo ceramides and changes in the mean chain lengths (carbon atoms) at the stripped site due to treatment (amount at the stripped site subtracting the stripped+treated). C: The Eo fraction of the samples at the four different sites at two depths. Data were compared using an LMM. D: The difference between the SAXD peak 2 position in the stripped and stripped+treated sites. The differences were tested with a Wilcoxon matched pairs signed rank test. E: The correlation between the SAXD peak 2 (nm) and TEWL (g/m2/h) at the end of the study.
Pearson r and P are provided. F: The correlation between the SAXD peak 2 (nm) and the mean chain length (carbon atoms) of all cerami-des. Pearson r and P are provided. G. The wavenumber in cm1 of the stretching peak position. Data were compared using an LMM.
TABLE 2. The output of the LLMs for mean chain length, Eo fraction, and stretching peak position.
Mean chain length Eo fraction Wavenumber cm1 Estimate p-value Estimate p-value Estimate p-value
Intercept 46.76 <0.001 0.107 <0.001 2848.60 <0.001
Effect size Stripped 0.37 <0.001 +0.011 0.007 +0.02 0.622
Treated +0.33 <0.001 +0.014 <0.001 +0.09 0.013
Depth +0.08 0.366 +0.003 0.537 0.17 <0.001
Interactions Stripped*depth +0.29 0.021 +0.012 0.043 +0.26 <0.001
The mean chain length and Eo fraction were calculated excluding ceramides NS C44 and EoS C66. The the wavenumber in cm1
of the stretching peak position was calculated using the center of gravity at 90% peak height. As fixed factors stripped, treated, and depth were used. The intercept was the control site at a depth of 5–8 tape-strips or for spectra of tapes 2–10.
at Walaeus Library / BIN 299, on March 28, 2018
www.jlr.org
examined. All skin sites were studied using ATR-FTIR, where both the CH2 symmetric stretching vibrations and the CH2 scissoring vibrations were examined. An LMM was built for the CH2 symmetric stretching peaks. Stripped, treated, and depth were used as fixed factors and subject as random factor (Table 2). A significant increase in peak po-sition was observed due to barrier disruption and treat-ment, suggesting a slight increase in disordering of the lipids. The effects were stronger deeper in the SC. How-ever, the peak position at all sites was located at wavenum-bers between 2848.46 cm1 and 2848.80 cm1, indicating an ordered lateral lipid organization at all sites. A similar LMM was built for the CH2 scissoring peak. We determined the FWHM of the scissoring vibrations. Supplemental Ta-ble S5 depicts the result of this model. At the control site the FWHM was significantly decreased at deeper layers (tape-strips 12–20); yet, the FWHM was 11.3 cm1 or higher, indicative of a large fraction of lipids forming an orthorhombic lateral packing. No deviation from an or-dered structure by treatment or stripping was observed.
DISCUSSIoN
In this study, we showed that a VC-based formulation is able to accelerate the barrier recovery of tape-strip- disrupted healthy human skin and, for the first time, dem-onstrate that formulations can act by normalizing the SC lipid composition. Multiple effects of barrier disruption and treatment on barrier recovery, ceramide composition, and lipid organization were examined (Fig. 6 provides an overview). Using PCA, samples were clustered into groups of treatment and stripping based on changes in ceramide profile. Moreover, correlations of ceramide levels to PC2 had great similarities to correlations between ceramide lev-els and barrier function after barrier recovery. Thus, the loading variables for PC2 were a powerful tool to identify ceramides responsible for profile changes related to bar-rier disruption. At the stripped sites after recovery, multiple changes in the ceramide profiles were observed. Treat-ment partially normalized these changes in SC ceramide composition caused by barrier disruption. These ceramide profile changes correlated to the barrier function, indicat-ing a relation of the changes in these lipids and an acceler-ated barrier recovery process.
When examining barrier recovery, two phases could be distinguished; a first steep increase in barrier recovery per-centage after 3 h followed by second gradually diminishing barrier recovery rate. Treatment increased the level of the first phase, where after 3 h, a recovery of 25% was reached compared with 10% without treatment. However, early effects of formulation on barrier recovery measured by TEWL could be caused by leftover formulation on the skin (27), even though leftover formulation was removed prior to TEWL measurement. The second recovery phase was not affected by residual formulation on the skin surface because the formulation was applied after TEWL measure-ment. During the second phase, treatment had a pro-nounced effect on the barrier recovery rate.
one of the aims of applying the tested formulation was to replenish SC ceramides. Treatment caused significant increase in the formulated ceramide level, even at deeper SC layers. Although a 2-day washout period would have re-moved almost all superficial formulation, it cannot be stated with 100% certainty that the applied ceramides mea-sured with LC/MS were incorporated into the SC. Some formulated ceramides could still be present in folds of the SC. In cultured skin, it was shown that ceramides stay in these folds (23). Although the increase of the formulated ceramides was observed at both depths, tape strips ob-tained lipid material from various depths of SC (44) and, thus, tape strips at both depths can contain material from these folds. Nevertheless, it has been demonstrated that when treating stripped ex vivo SC with deuterated ce-ramides once, small ceramide amounts were incorpo-rated into the SC lipid matrix after regeneration (Topically applied ceramides interact with the stratum corneum lipid matrix in compromised skin.,Pharm. Res, Berkers T., Viss-cher D, Gooris G.S., Bouwstra J.A.). others have shown that dimeric ceramides are able to diffuse into the skin (45). Together with the relatively large increases of the for-mulated ceramides, it is likely that a fraction of the applied ceramides did incorporate into the SC lipid matrix and ac-tively enhanced barrier recovery.
Multiple studies have used SC lipid-containing formula-tions, either for long- or short-term treatment (18–21) and it has been shown that the SC lipids ratio in formulations is Fig. 6. An overview of the effects of barrier disruption and treat-ment. Negative effects are indicated with a sign and positive ef-fects with a + sign. Barrier disruption induces barrier recovery and treatment accelerates this process. Changes in the Eo fraction, mean chain length, and lamellar spacing showed correlations (cor) indicated by the arrows. The changes in lipid composition, organi-zation, and subsequent effects are indicated. The ratio dS + P + H
S is mainly determined by the enzymes human-dihydro-4-desaturate (DES1) and human-sphingolipid-C4-hydroxylase (DES2), responsi-ble for the production of sphingosine and phytosphingosine ceramides from dihydrosphingosine ceramides, respectively. The arrows indicate that barrier disruption changed the lipid synthesis decreasing this ratio and treatment had the opposite effect. The correlation of the TEWL at day 16(d16) to the subclass ratio is indi-cated; however, the amount of C34 and the SAXD Peak 2 position correlated to TEWL as well.
at Walaeus Library / BIN 299, on March 28, 2018
www.jlr.org
Downloaded from
.html
et al. (28) tested the effect of 5 days VC treatment on TEWL and hydration of tape-stripped SC, but they observed no changes in TEWL when comparing with untreated stripped SC. In comparison to our study, the barrier was less exten-sively disrupted. Therefore, incomplete SC removal may lead to a lower efficacy of the formulation to improve bar-rier repair. Here, a detailed description of the recovery process is provided and, for the first time, insights are given into changes in the SC ceramide composition due to treat-ment. Below, a mechanism is suggested on how a VC-based formulation affects ceramide synthesis.
At the stripped (nontreated) sites, two prominent changes were observed in the endogenous ceramides: i) the amounts of S subclass were increased and ii) C34 ceramides were increased. The amounts of these ceramide groups correlated to a decrease in barrier function. However, from these data, it could not yet be deduced whether these increases were causal or contingent with a decreased barrier function. A plausible reasoning is that in a direct response to barrier disruption, the epidermal calcium gradient changed (2) and a subsequent modulation in gene expression occurred (29). These changes in epidermal homeostasis might have affected the SC ceramide processing in two ways.
First, in epidermal lipid biosynthesis, ceramides contain-ing a dihydrosphcontain-ingosine are either converted into sphin-gosine- or phytosphinsphin-gosine-containing ceramide (47, 48) (Fig. 6) (biosynthesis of subclass H ceramides has not yet been reported). When defining the ratio between the sub-classes as dS+P+H
S
, this ratio could only change if either of the two known lipid biosynthesis pathways changed. The present study showed that this ratio was substantially de-creased at the stripped sites, indicating barrier disruption influenced the specific synthesis pathways of subclasses S and P. Importantly, the ratio between the subclasses cor-related strongly to TEWL after barrier recovery, which sug-gests that an optimal ratio is important for an optimal skin barrier repair. Furthermore, this correlation was site independent; thus, at stripped sites with a higher TEWL, synthesis of sphingosine ceramides was preferred over phytosphingosine-containing ceramides. Treatment was able to favorably change the subclass ratio toward a lipid composition that correlated to a more efficient skin barrier recovery by reducing the amount of NS and AS subclasses.
The second change in lipid biosynthesis due to barrier disruption was the increased amount of C34 ceramide. These ceramides are produced from the sphingoid and acyl building blocks [a C16 or C18 acyl chain and a C16 or C18 sphingoid chain (49)] and do not require additional elongation steps (50). Although these C34 ceramides can be produced as a quick first response to mitigate an impaired SC barrier, C34 ceramides are “short” chain ce-ramides, which have been shown to reduce skin barrier function (6, 51).
Altogether, the C34 ceramides and the ratio of ceramide subclasses could function as indicators of reduced barrier function and changes in barrier lipid homeostasis. Here,
amount of C34 ceramides and, by diminishing the amount of NS and AS, able to change the subclass ratio and thus the preceding ceramide synthesis. These changes could be attributed to i) the semi-occlusive effect of the formulation, in which the formulation acted as an additional barrier, or ii) the presence of excess formulated ceramides reducing the response to replenish the ceramides. As a whole, these data show that the formulation partially normalized the lipid biosynthesis and directed the SC toward a more functional lipid homeostasis. The lipid organization was used to verify that changes in ceramide composition were causal to changes in barrier function.
An important characteristic of the SC ceramide fraction is the mean chain length. The chain length was reduced when the barrier function is impaired, for example, in stripped sites and AD (8, 17). Here, treatment was able to restore the mean chain length at stripped sites (excluding the added ceramides). The mean chain length correlated strongly to the fraction of Eo ceramides and treatment was able to increase the Eo fraction. At the treated sites, the spacing was slightly increased, indicating an increase in the repeat distances of the lamellar phases. Further-more, the spacing correlated to the mean chain length and weakly correlated to the Eo fraction (data not shown). Taken together, the data suggest that treatment influenced the lamellar lipid organization through increasing the Eo fraction, thereby increasing the mean change length (Fig. 6).
As far as lateral packing was concerned, our studies showed that a high fraction of lipids formed an orthorhom-bic packing and this was not affected by stripping. For this reason, the fraction of lipids forming an orthorhombic packing could not be increased due to treatment. Changes due to treatment might become more apparent in affected skin of AD patients where the fraction of lipids forming an orthorhombic organization is decreased compared with that in healthy skin (43).
To summarize the effects of the VC based formulation on barrier recovery in healthy SC, it was observed that treat-ment: i) accelerated barrier recovery, ii) changed the lipid synthesis to a more favorable lipid composition by decreas-ing the amount of C34 ceramides and changdecreas-ing the sub-class ratio dS+P+H
S
and increasing the fraction of Eo ceramides, and iii) these changes in lipid composition af-fected the SC lipid organization and correlated to the SC barrier function. Interestingly, similar increases in S sub-class and increases in the fraction of C34 chain length ceramides were observed in AD (8, 17). An essential application of this formulation could be in a particular group of AD patients, where barrier-restoring lipophilic formulations are commonly used (52). Moreover, the treat-ment presented here modulated the alterations in lipid composition observed in AD toward a healthy lipid homeo-stasis.
The authors would like to thank Evonik industries AG for supplying us with the ceramides, Croda International Plc and
at Walaeus Library / BIN 299, on March 28, 2018
www.jlr.org
Galderma SA for the other ingredients used in the formula-tion, and special thanks to Galderma SA for producing the formulation.
REFERENCES
1. Eckhart, L., S. Lippens, E. Tschachler, and W. Declercq. 2013. Cell death by cornification. Biochim. Biophys. Acta.1833: 3471–3480. 2. Feingold, K. R., and P. M. Elias. 2014. Role of lipids in the formation
and maintenance of the cutaneous permeability barrier. Biochim. Biophys. Acta.1841: 280–294.
3. van Smeden, J., M. Janssens, G. S. Gooris, and J. A. Bouwstra. 2014. The important role of stratum corneum lipids for the cutaneous barrier function. Biochim. Biophys. Acta.1841: 295–313.
4. Sahle, F. F., T. Gebre-Mariam, B. Dobner, J. Wohlrab, and R. H. Neubert. 2015. Skin diseases associated with the depletion of stra-tum corneum lipids and strastra-tum corneum lipid substitution ther-apy. Skin Pharmacol. Physiol.28: 42–55.
5. t’Kindt, R., L. Jorge, E. Dumont, P. Couturon, F. David, P. Sandra, and K. Sandra. 2012. Profiling and characterizing skin ceramides using reversed-phase liquid chromatography-quadrupole time-of-flight mass spectrometry. Anal. Chem.84: 403–411.
6. Mojumdar, E. H., Z. Kariman, L. van Kerckhove, G. S. Gooris, and J. A. Bouwstra. 2014. The role of ceramide chain length distribu-tion on the barrier properties of the skin lipid membranes. Biochim. Biophys. Acta.1838: 2473–2483.
7. Stahlberg, S., S. Lange, B. Dobner, and D. Huster. 2016. Probing the Role of Ceramide Headgroup Polarity in Short-Chain Model Skin Barrier Lipid Mixtures by (2)H Solid-State NMR Spectroscopy. Langmuir.32: 2023–2031.
8. Janssens, M., J. van Smeden, G. S. Gooris, W. Bras, G. Portale, P. J. Caspers, R. J. Vreeken, T. Hankemeier, S. Kezic, R. Wolterbeek, et al. 2012. Increase in short-chain ceramides correlates with an al-tered lipid organization and decreased barrier function in atopic eczema patients. J. Lipid Res.53: 2755–2766.
9. Matsui, T., and M. Amagai. 2015. Dissecting the formation, struc-ture and barrier function of the stratum corneum. Int. Immunol.27: 269–280.
10. Rawlings, A. V. 2014. Molecular basis for stratum corneum matura-tion and moisturizamatura-tion. Br. J. Dermatol.171(Suppl 3): 19–28. 11. Tanaka, M., Y. X. Zhen, and H. Tagami. 1997. Normal recovery of
the stratum corneum barrier function following damage induced by tape stripping in patients with atopic dermatitis. Br. J. Dermatol.136: 966–967.
12. Wolf, R., and L. C. Parish. 2013. Barrier-repair prescription mois-turizers: do we really need them? Facts and controversies. Clin. Dermatol.31: 787–791.
13. Hon, K. L., A. K. Leung, and B. Barankin. 2013. Barrier repair therapy in atopic dermatitis: an overview. Am. J. Clin. Dermatol.14: 389–399. 14. Corazza, M., S. Minghetti, A. Bianchi, A. Virgili, and A. Borghi. 2014.
Barrier creams: facts and controversies. Dermatitis.25: 327–333. 15. van Zuuren, E. J., Z. Fedorowicz, R. Christensen, A. Lavrijsen, and
B. W. M. Arents. 2017. Emollients and moisturisers for eczema. Cochrane Database Syst. Rev.2: CD012119.
16. Ito, S., J. Ishikawa, A. Naoe, H. Yoshida, A. Hachiya, T. Fujimura, T. Kitahara, and Y. Takema. 2017. Ceramide synthase 4 is highly expressed in involved skin of patients with atopic dermatitis. J. Eur. Acad. Dermatol. Venereol. 31: 135–141.
17. Ishikawa, J., H. Narita, N. Kondo, M. Hotta, Y. Takagi, Y. Masukawa, T. Kitahara, Y. Takema, S. Koyano, S. Yamazaki, et al. 2010. Changes in the ceramide profile of atopic dermatitis patients. J. Invest. Dermatol.130: 2511–2514.
18. Meckfessel, M. H., and S. Brandt. 2014. The structure, function, and importance of ceramides in skin and their use as therapeutic agents in skin-care products. J. Am. Acad. Dermatol.71: 177–184.
19. Lynde, C. W., and A. Andriessen. 2014. A cohort study on a ce-ramide-containing cleanser and moisturizer used for atopic derma-titis. Cutis.93: 207–213.
20. oh, M. J., J. J. Nam, E. o. Lee, J. W. Kim, and C. S. Park. 2016. A synthetic C16 omega-hydroxyphytoceramide improves skin bar-rier functions from diversely perturbed epidermal conditions. Arch. Dermatol. Res.308: 563–574.
21. Barba, C., J. L. Parra, L. Coderch, and A. Semenzato. 2014. In vivo and in vitro evaluation of topical formulations containing
physi-ological lipid mixture for replacement of skin barrier function. G. Ital. Dermatol. Venereol.149: 347–353.
22. Man, MQ. M., K. R. Feingold, C. R. Thornfeldt, and P. M. Elias. 1996. optimization of physiological lipid mixtures for barrier re-pair. J. Invest. Dermatol.106: 1096–1101.
23. Zhang, Q., C. R. Flach, R. Mendelsohn, G. Mao, A. Pappas, M. C. Mack, R. M. Walters, and M. D. Southall. 2015. Topically applied ceramide accumulates in skin glyphs. Clin. Cosmet. Investig. Dermatol.
8: 329–337.
24. Rhodes, L. E., S. o’Farrell, M. J. Jackson, and P. S. Friedmann. 1994. Dietary fish-oil supplementation in humans reduces UVB-erythemal sensitivity but increases epidermal lipid peroxidation. J. Invest. Dermatol.103: 151–154.
25. Rissmann, R., M. H. oudshoorn, R. Zwier, M. Ponec, J. A. Bouwstra, and W. E. Hennink. 2009. Mimicking vernix caseosa–preparation and characterization of synthetic biofilms. Int. J. Pharm. 372: 59–65.
26. oudshoorn, M. H., R. Rissmann, D. van der Coelen, W. E. Hennink, M. Ponec, and J. A. Bouwstra. 2009. Effect of synthetic vernix bio-films on barrier recovery of damaged mouse skin. Exp. Dermatol.18: 695–703.
27. oudshoorn, M. H., R. Rissmann, D. van der Coelen, W. E. Hennink, M. Ponec, and J. A. Bouwstra. 2009. Development of a murine model to evaluate the effect of vernix caseosa on skin barrier recov-ery. Exp. Dermatol.18: 178–184.
28. Visscher, M. o., N. Barai, A. A. LaRuffa, W. L. Pickens, V. Narendran, and S. B. Hoath. 2011. Epidermal barrier treatments based on ver-nix caseosa. Skin Pharmacol. Physiol.24: 322–329.
29. Sextius, P., C. Marionnet, F. X. Bon, A. L. de La Chapelle, C. Tacheau, M. Lahfa, A. Mauviel, B. A. Bernard, J. Leclaire, F. Bernerd, et al. 2010. Large scale study of epidermal recovery after stratum corneum removal: dynamics of genomic response. Exp. Dermatol.19: 259–268.
30. Bandier, J., B. C. Carlsen, M. A. Rasmussen, L. J. Petersen, and J. D. Johansen. 2015. Skin reaction and regeneration after single sodium lauryl sulfate exposure stratified by filaggrin genotype and atopic dermatitis phenotype. Br. J. Dermatol.172: 1519–1529.
31. o’Connor, R. J., J. ogle, and M. odio. 2016. Induction of epidermal damage by tape stripping to evaluate skin mildness of cleansing regi-mens for the premature epidermal barrier. Int. J. Dermatol.55(Suppl 1): 21–27.
32. Breternitz, M., M. Flach, J. Prassler, P. Elsner, and J. W. Fluhr. 2007. Acute barrier disruption by adhesive tapes is influenced by pres-sure, time and anatomical location: integrity and cohesion assessed by sequential tape stripping. A randomized, controlled study. Br. J. Dermatol.156: 231–240.
33. Pinkus, H. 1951. Examination of the epidermis by the strip method of removing horny layers. I. observations on thickness of the horny layer, and on mitotic activity after stripping. J. Invest. Dermatol.16: 383–386.
34. Boiten, W., S. Absalah, R. Vreeken, J. Bouwstra, and J. van Smeden. 2016. Quantitative analysis of ceramides using a novel lipidomics approach with three dimensional response modelling. Biochim. Biophys. Acta.1861: 1652–1661.
35. Masukawa, Y., H. Narita, H. Sato, A. Naoe, N. Kondo, Y. Sugai, T. oba, R. Homma, J. Ishikawa, Y. Takagi, et al. 2009. Comprehensive quantification of ceramide species in human stratum corneum. J. Lipid Res.50: 1708–1719.
36. van Smeden, J., W. A. Boiten, T. Hankemeier, R. Rissmann, J. A. Bouwstra, and R. J. Vreeken. 2014. Combined LC/MS-platform for analysis of all major stratum corneum lipids, and the profiling of skin substitutes. Biochim. Biophys. Acta.1841: 70–79.
37. Motta, S., M. Monti, S. Sesana, R. Caputo, S. Carelli, and R. Ghidoni. 1993. Ceramide composition of the psoriatic scale. Biochim. Biophys. Acta.1182: 147–151.
38. Boncheva, M., F. Damien, and V. Normand. 2008. Molecular orga-nization of the lipid matrix in intact Stratum corneum using ATR-FTIR spectroscopy. Biochim. Biophys. Acta.1778: 1344–1355. 39. Damien, F., and M. Boncheva. 2010. The extent of orthorhombic
lipid phases in the stratum corneum determines the barrier effi-ciency of human skin in vivo. J. Invest. Dermatol.130: 611–614. 40. Checa, A., C. Bedia, and J. Jaumot. 2015. Lipidomic data analysis:
tutorial, practical guidelines and applications. Anal. Chim. Acta.885: 1–16.
41. Vaz, F. M., M. Pras-Raves, A. H. Bootsma, and A. H. van Kampen. 2015. Principles and practice of lipidomics. J. Inherit. Metab. Dis.38: 41–52.
at Walaeus Library / BIN 299, on March 28, 2018
www.jlr.org
Downloaded from
.html
the analysis of repeated continuous outcome measures in clinical trials. Respirology.19: 155–161.
43. van Smeden, J., M. Janssens, E. C. Kaye, P. J. Caspers, A. P. Lavrijsen, R. J. Vreeken, and J. A. Bouwstra. 2014. The importance of free fatty acid chain length for the skin barrier function in atopic eczema pa-tients. Exp. Dermatol.23: 45–52.
44. van der Molen, R. G., F. Spies, J. M. van ’t Noordende, E. Boelsma, A. M. Mommaas, and H. K. Koerten. 1997. Tape stripping of hu-man stratum corneum yields cell layers that originate from vari-ous depths because of furrows in the skin. Arch. Dermatol. Res.289: 514–518.
45. Neubert, R. H., S. Sonnenberger, B. Dobner, C. W. Gray, Jr., K. N. Barger, K. Sevi-Maxwell, E. Sommer, and J. Wohlrab. 2016. Controlled Penetration of a Novel Dimeric Ceramide into and across the Stratum Corneum Using Microemulsions and Various Types of Semisolid Formulations. Skin Pharmacol. Physiol. 29: 130–134.
46. Yang, L., M. Mao-Qiang, M. Taljebini, P. M. Elias, and K. R. Feingold. 1995. Topical stratum corneum lipids accelerate barrier repair after tape stripping, solvent treatment and some but not all types of de-tergent treatment. Br. J. Dermatol.133: 679–685.
sphingolipid metabolism: from synthesis to breakdown. Adv. Exp. Med. Biol.688: 1–23.
48. Uchida, Y., M. Hara, H. Nishio, E. Sidransky, S. Inoue, F. otsuka, A. Suzuki, P. M. Elias, W. M. Holleran, and S. Hamanaka. 2000. Epidermal sphingomyelins are precursors for selected stratum cor-neum ceramides. J. Lipid Res.41: 2071–2082.
49. Masukawa, Y., H. Narita, E. Shimizu, N. Kondo, Y. Sugai, T. oba, R. Homma, J. Ishikawa, Y. Takagi, T. Kitahara, et al. 2008. Characterization of overall ceramide species in human stratum cor-neum. J. Lipid Res.49: 1466–1476.
50. Kihara, A. 2016. Synthesis and degradation pathways, functions, and pathology of ceramides and epidermal acylceramides. Prog. Lipid Res.63: 50–69.
51. Paloncýová, M., K. Vavrova, Z. Sovova, R. DeVane, M. otyepka, and K. Berka. 2015. Structural Changes in Ceramide Bilayers Rationalize Increased Permeation through Stratum Corneum Models with Shorter Acyl Tails. J. Phys. Chem. B.119: 9811–9819.
52. Giam, Y. C., A. A. Hebert, M. V. Dizon, H. Van Bever, M. Tiongco-Recto, K. H. Kim, H. Soebono, Z. Munasir, I. A. Diana, and D. C. Luk. 2016. A review on the role of moisturizers for atopic dermatitis. Asia Pac. Allergy.6: 120–128.
at Walaeus Library / BIN 299, on March 28, 2018
www.jlr.org