Pedestrians
Passengers
Drivers
Fatalities
Road Accidents
in Namibia
FOREWORD
IT is my pleasure to present our 2009 collision statistical report based on the analysis of collision reports as provided by police stations across the country. The purpose of this report is to present an overview of the road safety situation, risk factors, the impact of road traffic injuries on society and possible ways to prevent or reduce road accidents. This report may therefore serve as a handy decision-making tool in the road transport and health sectors or as an authoritative refer-ence material for research purposes.
Road traffic injuries place a heavy burden on global and national economies and household finances. Many families are driven into poverty by the loss of breadwinners and the added burden of having to care for mem-bers who become disabled as a result of injuries sustained in road traffic accidents. In 2009, Namibia records over 15,000 vehicle crashes, 4,000 injuries and about 300 deaths, and most of the drivers and passengers in-jured, disabled or killed fell in the age range of between 10 and 56 year, while pedestrian fell under 20 age category. Furnished with accurate statistical data, stakeholders in road safety would be able to make informed decisions on road safety management such as enforcement of legislation to control speed, drunk driving, usage of seat belts, wearing of helmets as well as driver and vehicle fitness.
The number of crashes during the period under review generally rose in comparison to the previous year. The Khomas region had the largest number of crashes followed by Erongo, Oshana, Otjozondjupa and Karas. This is attributed to the logic that the chances of a crash occurring should be higher where there are more vehicles. Although a high number of crashes occurred in urban areas due to high traffic volumes, it is the rural areas that are associated with a high number of fatalities due to the impact of the crashes at high speed. This kind of situ -ation is of great concern to us all and requires a strong political will and concerted efforts from all stakeholders, including the government and non-governmental institutions, to develop counter-measures towards attaining a safe road environment.
Significant challenges were experienced during the data gathering process. These included the problem of un -der reporting of casualties, as well incomplete reporting of crash reports. Deficiencies such as lack of proper record keeping, inadequate training, and lack of understanding of the importance of crash reports became pro -foundly evident. Nevertheless the unreliable data was taken into account during the analysis and the NRSC is therefore confident this report fairly represents the situation on the ground.
In conclusion, I would like to advise the reader that the data contained herein should be interpreted within the Namibian context and cognisance should be taken that no corrective factors have been applied to comply with the 30-day period of ‘killed in a crash’ according to the international definition. Hence, data in this report must be seen in the context of a fatality that occurred within 24 hours. Further, analysis and comparison with international collision data take into account Namibia’s socio-economic peculiarities as well as traffic and other relevant data.
Finally, on behalf of the National Road Safety Council (NRSC) and the Secretariat, I would like to extend many thanks to police stations who did their best to ensure that Namibian Road Accident Forms were sent in time to their re -gional headquarters for data capturing. I urge those stations that did not send in their reports, to do so in the future. It is my hope that this report will be a useful tool not only for the transport sector but also for the general public.
TABLE OF CONTENTS
Executive summary ... 5
Introduction ... 8
Road traffic indicators ... 10
Road traffic injuries ... 28
Injury severity of road user groups ... 39
Conclusions and recommendations ... 67
APPENDICES
Appendix I: Country of origin and severity of injury of drivers ... 69Appendix II: Pedestrian crash locations ... 72
Appendix III: Crash location and injury severity (outside town/city) ... 96
Appendix IV: Street location and injury severity ... 102
LIST OF FIGURES AND TABLES
Figure 1, 2: Populations size and chances of dying in a road crash ...12
Figure 3, 4: Vehicles used and chances of dying in a road crash ...13
Figure 5: Annual change in percentage increase/ decrease in fatalities and casualties over the 8-year period (2002 – 2009) ...15
Figure 6: Number of crashes, vehicles involved and injury accidents over eight years (2002 – 2009) ...15
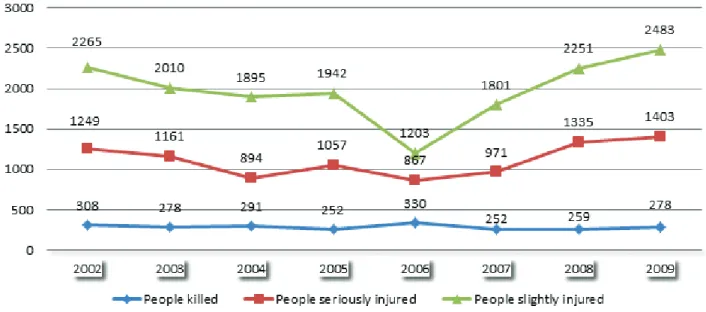
Figure 7: Severity of injury resulting from road crashes over eight years (2002 – 2009) ...16
Figure 8: Number of road crashes by region ...19
Figure 9: Number of injury accidents and fatalities by region ...19
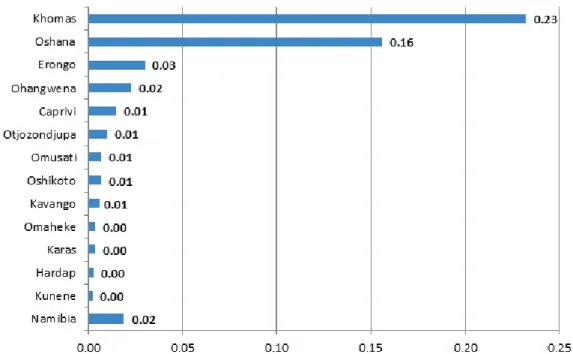
Figure 10: Regional distribution of the rates of death as per number of registered vehicles ...20
Figure 11: Density of crashes per square kilometre ...23
Figure 12: Regional distribution of population, area (in square kilometres) and number of crashes ...24
Figure 13: Type of crash ranked by severity of injury: fatalities, serious and slight injuries ...29
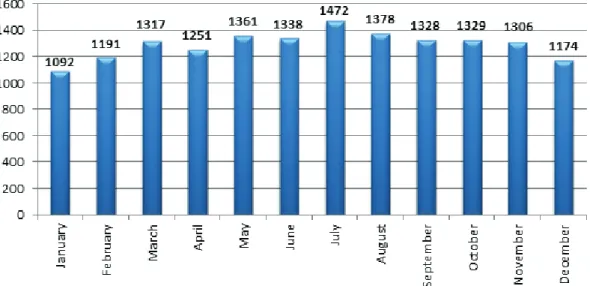
Figure 14: Number of crashes per month ...32
Figure 15: Injury severity by month ...33
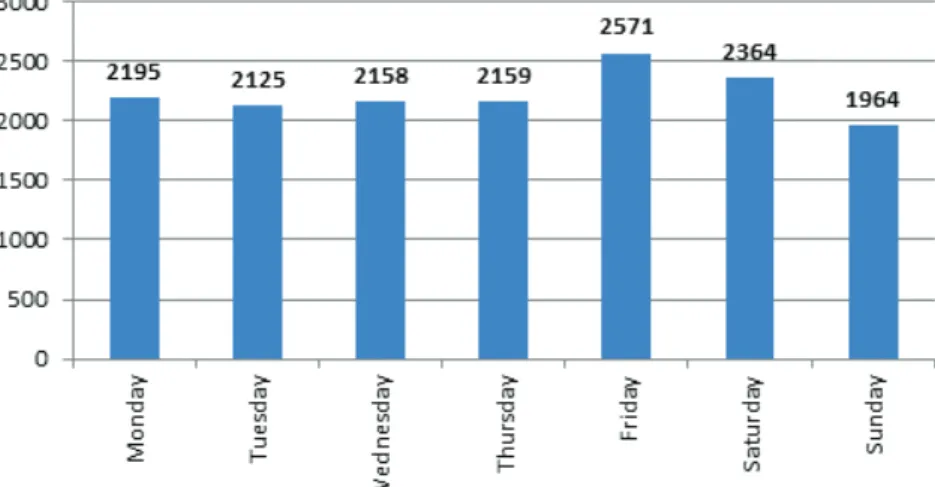
Figure 16: Number of crashes by day of the week ...34
Figure 17: Injury severity by day of the week ...35
Figure 18: Injury severity by time of the day ...36
Figure 19: Number of crashes by time of the day and day of the week ...38
Figure 20: Injury severity according to different road user group (Percentage) ...40
Figure 21: Distribution of injury crashes by gender of road user (Percentage) ...41
Figure 22: Driver injury status by gender ...42
Figure 23: Passenger injury status by gender...42
Figure 24: Pedestrian injury status by gender ...43
Figure 25: Distribution of crashes in which drivers were involved by age category ...44
Figure 26: Distribution of crashes in which passengers were involved by age category ...44
Figure 27: Distribution of crashes in which pedestrians were involved by age category ...45
Figure 28: Driver injury severity by age category ...46
Figure 29: Passenger injury severity by age category ...47
Figure 30: Pedestrian injury severity by age category ...47
Figure 31: Number of driver casualties by selected vehicle types ...49
Figure 32: Cyclist injury severity, 2007 - 2009 ...50
Figure 33: Number of passenger casualties by selected vehicle types ...51
Figure 34: Number of pedestrian casualties by selected vehicle types ...52
Figure 35: Selected driver action by percentage of casualties sustained by road users ...54
Figure 36: Distribution of crashes where drivers were tested for alcohol use ...55
Figure 37: Drivers and passengers who reported the use of seat belts at time of crash ...56
Figure 38: Number of pedestrians killed and injured by time of the day ...58
Figure 39: Position of pedestrian ...59
Figure 40: Location of pedestrian ...59
Table 1: Variations in the road safety situation across years:
Road traffic indicators and measures of exposure to risk for the
years 2002 – 2009 ...11
Table 2: Annual change in number of crashes and outcome of crashes ...14
Table 3: Number and rates in variation by crash counts for regional distribution, 2009 ...18
Table 4: Number of crashes per square kilometre ...22
Table 5: Type of crash by region ...25
Table 6: Regional distribution of accident type ranked by frequency of occurrence ...27
Table 7: Type of crash and severity of injury ...28
Table 8: Number of young people killed or injured by type of road traffic crash...31
Table 9: Crashes and injury severity by month ...32
Table 10: Number of crashes and injury severity by day of the week ...33
Table 11: Injury severity by time of day ...35
Table 12: Number of crashes by time of the day and day of the week ...37
Table 13: Injury severity according to different road user group ...39
Table 14: Distribution of injury crashes by gender of road user ...41
Table 15: Driver injury severity by vehicle type ...48
Table 16: Injury severity of drivers ...49
Table 17: Passenger injury severity by vehicle type ...50
Table 18: Pedestrian injury severity by vehicle type ...52
Table 19: Driver action and casualties sustained by road users ...53
Table 20: Number of road users injured or killed by driver action: Travelling straight ...54
Table 21: Pedestrian severity of injury by time of the day ...57
Table 22: Distribution of pedestrian action by pedestrian location ...61
Table 23: Damages to vehicles ...62
Table 24: Top ten crash locations and crash severity outside town/city ...63
Table 25: Top crash locations outside town/city by number of pedestrians killed or injured ...64
Table 26: Top ten street locations and crash severity inside town/city ...65 Table 27: Top street locations inside town/city by number of pedestrian killed or injured .66
GPS Global Positioning System
LDV Light Delivery Vehicle
NRAF Namibian Road Accident Form
NRSC National Road Safety Council
The National Road Safety Council (NRSC) is tasked with the capturing and processing of the Namibia Road Accident Forms (NRAF) and the subsequent dissemination of the annual road accident statistics that portray the road safety situation in the country. The road accidents statistics contained in this report are based on the information derived from the NRAFs which are completed for each road accident reported at police stations countrywide.
The total number of road crashes registered at various police stations in Namibia and processed by the NRSC for 2009 amounted to 15,537. Compared to the previous year, this presents a substantial increase of 12.4 percent in road accidents over 12 months. Over the span of eight years, the number of crashes has risen on average by 5.5 percent. This upward trend reflects a similar escalation in the number of registered vehicles on the road (3.7 percent) and an overall growth in the number of vehicle kilometres travelled (VKT) (6.1 percent) from 2002 to 2009. [See Table 1] The safety situation on Namibian roads remains precarious as demonstrated by the 11.3 percent increase in the number of injury crashes from 2008 (2,279) to 2009 (2,537). This observation is supported by a comparable 8.3 percent rise in the number of casualties, i.e. number of road users killed, and seriously or slightly injured over the two years (3,845 to 4,164). The steepest increase was noted for the number of slight injuries (from 2,251 to 2,483 or 10.3 percent). The number of fatally injured road users rose by 7.3 percent (from 259 to 278) while serious injuries reported a 5.1 percent escalation (1,335 to 1,403).
Despite considerable fluctuation in the numbers of casualties from year to year, a general upward trend across the eight years (2002 – 2009) was identified. However, if the increasing number of road accidents across the eight years is taken into account, the ratio
EXECUTIVE SUMMARY
of affected road users to the number of road crashes appears to have declined slightly. A regional distribution of the number of road accidents reveals that over half of all crashes occurred in Khomas region (8,590 or 55.3 percent), followed by Erongo (12.2 percent), Oshana (8.7 percent), Otjozondjupa (6.8 percent) and Karas (3.8 percent). These five regions also topped the list in 2008 albeit in a slightly different order with Oshana and Otjozondjupa changing places. The highest number of fatalities per 10,000 people was recorded in Oshana, with four people in 10,000 being at risk of injury. Other regions whose fatality rate stood at two or more people per 10 000 were Erongo, Omaheke, Karas and Hardap. A negative relationship between the number of registered vehicles and the number of fatalities per 1,000 vehicles was observed across the regions. For regions with a low vehicle density such as Caprivi, Ohangwena, Kunene and Omaheke, the number of road deaths per 1,000 registered vehicles was four or more. By contrast, in regions with the highest vehicle density – Khomas, Erongo and Karas – the number of people killed on the roads fell to one per 1,000 registered vehicles.
A problem that presents itself with this road safety indicator is that a decline in fatalities may reflect the growth in the number of registered vehicles rather than measuring real gains in saved lives. Possibly, a more objective measure of exposure to risk is the number of Vehicle Kilometres Travelled (VKT), with the related road traffic indicator measuring the number of fatalities per 10 million VKT.
As observed in the previous two years, head-rear-end crashes continued to be the most frequently occurring road accident in 2009 (3,411 in total). Collisions with animals (1,700) and crashes with objects (1,554) were positioned in second and third place
respectively. Amongst the accident types with particularly severe outcomes were single vehicles that rolled and resulted in the highest number of fatalities (96) and serious injuries (529); crashes with pedestrians (resulting in 73 deaths, 273 serious injuries); and head-on collisions (22 fatalities, 67 serious injuries). Regions where single vehicle overturns were amongst the most frequently occurring accidents were Hardap and Karas, whereas Khomas, Oshana and Erongo recorded the highest number of pedestrians involved in road accidents.
The number of road crashes per month did not vary greatly. Months with the highest number of crashes were May (1,361), June (1,338) July (1,472) and August (1,378), and those with the lowest number of road accidents were December (1,174), January (1,092) and February (1,191). Injury crashes were most prevalent in May (243) and September (230). Although the number of accidents for December was surprisingly low, these accidents resulted in a high number of casualties (366). Months that recorded a high number of deaths amongst road users were May (35), February (30), December (28) and March (27).
Fridays and Saturdays accounted for most of the road crashes (2,571 and 2,364 respectively) with a resultant high incidence of fatalities (104) and serious injuries (494). The highest number of fatalities (54) occurred between 18:01 and 20:00, while the preceding hours between 16:01 and 18:00 were also particularly unsafe (33 fatalities and 197 serious injuries). The safest time to be on the road was at night between 2:01 and 6:00. As has been reported in previous years, there were considerably more male drivers (1,556) involved in road crashes than females (213). Gender statistics amongst passengers were more evenly balanced (743 males versus 531 females), while approximately two thirds of pedestrians involved in crashes were male (302males versus 174 females). Although the actual number of fatal injuries for drivers was higher than that of
shows that a large proportion of fatalities belonged to pedestrians (9.8 percent) instead of drivers (6.2 percent). This finding indicates that there is a higher chance of dying in pedestrian injury crashes compared to vehicle occupant injury crashes.
Over two thirds of driver casualties (1,086 or 68.1 percent) fell within the age category of 17-56 years while 13.8 percent were below the age of 24. Passengers were slightly younger, at 10 -56 years of age. Unlike the age groups for drivers and passengers, half of the pedestrian victims (185 or 43.9 percent) were under the age of 20, an alarmingly high statistic.
The highest number of fatal accidents were recorded for the motor car/station wagon (38 fatalities), followed closely by 37 fatally injured drivers of light delivery vehicles (LDV). Both types of vehicles also accounted for the majority of serious and slight driver injuries. A marked increase in the number of fatal and serious injuries to cyclists, as well as to drivers of minibuses was observed from the previous year. The death toll for drivers of minibuses rose from 2 in 2008 to 7 in 2009, and the number of serious injuries increased from 8 to 13. Two cyclists died in 2008, compared to ten the following year, while the number of serious injuries for this driver group escalated from 18 to 26 over the two years.
The endeavour to produce reliable road accident statistics is negatively affected by the recurring problem of the underreporting of casualties. For one, not all injury accidents may have been reported by the concerned parties. Of those which have been registered at police stations countrywide, inaccurate and incomplete reporting of the crash by police officers and/ or drivers implicated is another source of error. Failure by police stations to submit all NRAF to the regional headquarters for capturing, seriously affects the reliability of the crash data, as forms not captured may well have included road accidents with criminal investigations pending.
the consistent follow-up of seriously injured people admitted to hospital is not fully in place, implying that the number of fatalities could have been underreported.
Of the 24,433 drivers who were involved in road accidents, merely 2,689 or 11.0 percent were tested for alcohol intoxication, a decrease of 4 percent compared to 3,227 tested in 2008. This poor performance extends also to the wearing of seatbelts, where only about 10 percent of accident forms recorded seatbelt usage for 2,333 drivers out of total of 24,433, and for 147 injured passengers out of a total of 1,594 (9.2 percent). This data is entirely inadequate for planning strategies to curb drinking and driving and to promote the wearing of seatbelts as an essential safety measure.
Amongst other contributing factors that have been identified on the NRAF are speeding (as indicated by the vehicles’ skid mark lengths), defective vehicles and inadequate visibility. In addition, driver behaviour such as the driver’s lack of awareness of and compliance with traffic rules and driver fatigue also featured as major risk factors. However, the NRAF does not collect data on these causes.
The proposed remedial measures intended to prevent and reduce road accidents are the following:
• Promote public transport usage by the public to ease the burden of increased traffic volume across the national road network. Traffic congestion, as a result of rapid urbanisation, is experienced in Khomas, Erongo and Oshana. Although there are increased numbers of bus services in these regions, there are limited bus services in the North West where rapid urbanisation has recently been experienced and also where the road infrastructure on national roads has been improved, particularly in
the areas of Kamanjab, Opuwo and Outapi. The development of the road infrastructure by local authorities in the larger urban centres of those regions should make provision for the safe passage of all road users, especially for pedestrians and cyclists.
The proposed public transport service will decrease the public’s use of light delivery vehicles. (LDVs pose a persistent challenge, as is indicated by the high number of driver and passenger casualties resulting from accidents in them.)
• Pedestrian accidents remain a concern as nearly half of the victims of collisions with vehicles are under the age of 20 years. The introduction of compulsory road safety education for lower primary schools and the organising of extensive public campaigns that raise awareness regarding pedestrian safety and responsibilities are recommended.
• Accidents with cyclists have risen sharply over the past two years. Measures that could prevent this rising trend in cyclist crashes include information campaigns to sensitise drivers to the presence of cyclists on the road, promoting the usage of safe helmets, and the construction of safe passageways for cyclists in urban areas and on open roads.
• It is recommended that future reports should complement the road accident statistics derived from the NRAF with statistics from other stakeholders to produce one comprehensive report.
• A proposal for future research into areas of concern raised by the analysis of the accident data should be developed.
With the level of motorisation expected to rapidly increase over the next decade, the benefits of such development are challenged by a related escalation in traffic injury related costs such as providing hospital care and rehabilitation services. Besides this direct drain on the nation’s economy, the devastating loss or serious injury of a family member places considerable financial, social and emotional strain on the affected families. Awareness of the negative economic and social impact of road crashes has triggered global efforts to deal with the current critical road safety situation and has guided coordinated global efforts towards substantive reduction of road crashes. Efforts are being focused on public awareness campaigns and improved traffic law enforcement.
It is in this spirit that the NRSC has undertaken to collate road crashes in the country and analyse this data in order to identify the necessary remedial interventions to improve the situation. As part of this effort, the NRSC has produced separate reports on the road safety situation since 2005. This statistical report gives an account of accidents that took place on the national road network in 2009. Road crashes are reported to the Namibian Police in accordance with the Road Traffic and Transportation Act (Act 22 of 1999), while the Roads Authority manages the traffic counts on national roads to determine the Vehicle
vehicles. The NRSC, established under the National Road Safety Act (Act 9 of 1972), is tasked with the responsibility to promote road safety and disseminate road safety information to all concerned parties.
For the year under review, the NRSC captured data related to 15,537 road crash cases. Head-rear-end crashes were the most frequently occurring road accidents in 2009, followed by collisions with animals and fixed objects, as well as sideswipe crashes between vehicles moving in the same direction. Although these accidents constituted the majority in terms of numbers, accidents that were the most devastating in terms of severity were single vehicle overturns, collisions with pedestrians and head-on crashes. Amongst the suspected causes of these accidents are reckless and drunk driving, speeding, driver fatigue, unsafe roads and unsafe vehicle conditions. At present, these factors are not reflected in the analysis, partly because data on these such as driver fatigue and reckless driving is not being collected. However, a more detailed analysis, which includes factors that have been recorded on the NRAF, is feasible and it is proposed that these should be incorporated into future accident reports. Determining the contribution of these circumstances to the accident event will assist in the planning of mitigating interventions.
It is indisputable that inaccurate and
the data. Although most of the information obtained from the accident forms seemed to be adequate under analysis, concerted efforts need to be undertaken by the police to produce more complete data on each accident: location, age and gender of all road users involved, the number of passengers per vehicle, the severity of injury sustained by pedestrians and passengers, and especially
seatbelt compliance and alcohol testing. Since it is believed that buckling up can save lives and that driving under the influence of alcohol is a major cause of accidents in Namibia, it is not possible to determine whether either of these was a contributing factor towards the accident. Supplementary data on the extent to which alcohol contributed to accidents can be obtained from the National Forensic Science Laboratory.
ROAD TRAFFIC INDICATORS
The overall level of road traffic safety can bemeasured in several different ways. The primary or direct indicators include the (absolute) number of crashes that result in injury and/or fatalities and the number of people who die (fatalities) or are injured (seriously or slightly) as a result of road traffic crash within a given time period, usually a year. These statistics disclose the prevalence and size of the road safety problem and are essential for the planning of remedial measures and allocation of resources at the local level.
To monitor the level of road safety over years or across regions, the primary indicators must be related to one or other measure of exposure to risk in order to make meaningful comparisons and determine trends over time or across regions. These rates are estimated by a ratio of number of road safety outcomes (e.g. accidents, injuries) to the measure of exposure (e.g. population size).The most commonly used risk indicators, which cover different aspects of road safety management, include:
(1) Fatalities per 10,000 registered vehicles, which shows the ratio of fatalities to vehicles and indicates the extent to which road crashes constitute a traffic problem. (2) Fatalities per 100,000 people, which shows
the ratio of the number of road deaths to population and establishes the extent to which road accidents contribute towards the public health problem.
(3) Fatalities per 10 million VKT, which shows the ratio of fatalities to vehicle kilometres travelled and reflects the level of safety of
When changes in these rates are consistently monitored, variations or trends in the level of road safety over years or across regions and locations can be established. Amongst other road safety performance measures that complement these primary performance indicators and rates are:
(1) The number of casualties resulting from road collisions, where at least one of the drivers involved was driving under the influence of alcohol.
(2) The number of car occupants killed or seriously injured who were not wearing a seat belt.
(3) The numbers of pedestrians involved in road crashes.
(4) The number of young people (25 years and less) deceased or injured by a type of road traffic crash.
(5) The number of injury accidents caused by speeding.
(6) The number of casualties resulting from road crashes caused by driver fatigue. Of the six mentioned above, only the third and fourth (number of pedestrians and young people) are discussed in this report. As to the other indicators, the incomplete data on alcohol involvement and seat belt compliance does not allow for a sound analysis of these two performance indicators. The effect of speeding could be incorporated pending the completeness of this information as recorded on the accident form. Since the NRAF does not
Table 1: Variations in the road safety situation across years: Road traffic indicators and measures of exposure to risk for the years 2002 – 2009
Year 2002 2003 2004 2005 2006 2007 2008 2009
Numbers
Crashes 10,915 10,957 10,262 11,146 13,396 13,720 13,825 15,537 Injury crashes 2,125 1,956 1,763 1,834 1,248 2,053 2,279 2,537
Fatalities 308 278 291 252 330 252 259 278 Serious injuries 1,245 1,149 896 1,054 560 971 1,335 1,403 Slight injuries 2,253 1,195 1,861 1,928 1,240 1,801 2,251 2,483 Registered vehicles 180,342 192,321 204,460 218,140 232,348 239,885 213,939 229,806 Vehicle Kilometres
Travelled (VKT) 4,722,048,700 4,795,168,400 5,089,239,800 5,343,794,700 5,747,261,300 5,929,692,400 6,409,643,700 7,141,761, 800
National population 1,860,145 1,891,097 1,923,347 1,956,899 1,991,746 2,027,870 2,065,224 2,103,762
Rates
Crashes/ 1 000
vehicles 60.5 57.0 50.2 51.1 57.7 57.2 64.6 67.6
Crashes/ 10 000
people 58.7 57.9 53.4 57.0 67.3 67.7 66.9 73.9 Injury severity/ 1 000
vehicles 21.1 13.6 14.9 14.8 9.2 12.6 15.8 18.1 Injury severity/
10 000 people 20.5 13.9 15.9 16.5 10.7 14.9 18.6 19.8
Fatalities/ 10 000
vehicles 17.1 14.5 14.2 11.6 14.2 10.5 12.1 12.1
Fatalities/ 100, 000
vehicles 170.8 144.5 142.3 115.5 142.0 105.1 121.1 121.0
Fatalities/ 10 million
VKT 0.65 0.58 0.57 0.47 0.57 0.42 0.40 0.39
Fatalities/
10 000 people 1.7 1.5 1.5 1.3 1.7 1.2 1.3 1.3
Fatalities/ 100 000
people 16.6 14.7 15.1 12.9 16.6 12.4 12.5 13.2 The population figures are projected numbers calculated by the Central Bureau of Statistics, and based on the census population of 2001 (1 830 330): Central Bureau of Statistics, National Planning Commission, Windhoek, January 2006. Calculations for rates: (Number of occurrences/ total population) x given population.
Table 1 displays trends in the road safety situation over the years 2002 to 2009. A steady increase in the number of crashes from year to year (with the exception of 2004) was observed. Greater variation is evident in the number of injury crashes and the fatalities, and serious and slight injuries that resulted from these crashes.
As for the measures of exposure to risk, population size and VKT constantly increased over the years. A sharp decline in the number of registered vehicles occurred in 2008 due to de-registration of vehicles that were not roadworthy resulting in a negative growth rate of 9.8 percent which was offset by a 6.9 percent gain in 2009.
Reviewing trends in the level of road safety over the years in terms of the risk indicators, the ratio of fatalities per 10 000 people has remained the same over the past two years with 1.3 people standing a chance of being killed in a road accident. The risk of a person dying in a road crash however has increased slightly from 12.5 to 13.2 per 100 000 people. Despite the variation in fatality rates over the last eight years, the downward trend depicted in Figure 2 seemingly indicates an overall decline in deaths from road accidents. In terms of absolute numbers, however, nineteen (19) more people died in 2009 as a result of road crashes when compared to 2008.
The fatality rate per 10,000 vehicles, as shown in Figure 3 following, remained constant over the last two years at 12.1, which means that twelve people per 10,000 registered vehicles faced the risk of dying in a road crash in
of vehicles (7.4 percent) from 2008 to 2009. In other words, when the number of occurrences (fatalities) and the measure of exposure (number of vehicles) change at the same rate, the road user’s risk of being killed in a Figure 1: Fatalities/10 000 people,
2002 – 2009
Figure 1, 2: Populations size and chances of dying in a road crash
Figure 2: Fatalities/ 100 000 people, 2002 - 2009
The ratio of fatalities to 10 million VKT for 2009 has marginally decreased when compared to the previous year (0.40 for 2008 and 0.39 for 2009). The current rate of 0.39 implies that less than one person per 10 million VKT was at risk of being killed while travelling on the
national road network. The trend over the years is similar to the one depicted in Figure 2 which showed a more or less steady decline. This leads to the positive inference that the safety level of the Namibian road network has evidently improved over the years.
Figure 3, 4: Vehicles used and chances of dying in a road crash
Figure 4: Fatalities/10 million VKT. 2002 - 2009 Figure 3: Fatalities/10 000 vehicles. 2002 -2009
Considering the overall trend across the eight years (2002 – 2009), it can be concluded that the fatality rates decreased with the rates remaining almost constant over the last three
years. This implies that based on the number of road crashes reported and captured in the database, the level of road safety has improved over the eight-year span.
The year-to-year change in the number of crashes showed a percentage increase from 0.4 percent (2002 – 2003) to 20.2 percent (2005 – 2006), except in 2004 where less road accidents occurred than in the previous year (-6.3 percent). It seems likely that this fluctuation might have occurred as a result of underreporting of crashes (Table 2). A percentage rise of 12.4 percent (1,712 road crashes) was noted between 2008 and 2009. Considering the overall trend across the eight years, the average percentage growth amounted to 5.5 percent per year. The percentage difference in number of crashes between 2002 and 2009 was 42.3 percent, or an increase of 4,622 collisions if expressed in absolute numbers.
Greater variation was observed in the number of fatalities and casualties that resulted from these crashes over the eight years. Inspecting
increase, the numbers of casualties decrease, while the opposite is true for the subsequent annual change.
With regard to the percentage change from 2008 to 2009, an increase in both fatalities and casualties was recorded (7.3 percent and 8.3 percent respectively). A comparison of the figures from 2002 and 2009 disclosed that on average over the eight year span, the fatalities have decreased by 9.7 percent while casualties increased by 8.9 per cent.
Concluding the discussion of trends in rates and percentage changes, it can be said that for fatalities an overall decrease in absolute numbers, percentage changes and rates per 10,000 people was observed from 2002 to 2009. In other words, while the number of people, vehicles and VKT increased over the past eight years, proportionally fewer fatalities occurred which suggests an improvement of
Table 2: Annual change in number of crashes and outcome of crashes
Year Number of crashes Number of fatalities Number of casualties
Total Yearly change Total Yearly change Total Yearly change
Nº % Nº % Nº %
2002 10,915 308 3822
2003 10,957 42 0.4 278 -30 -9.7 3449 -373 -9.8
2004 10,262 -695 -6.3 291 13 4.7 3097 -352 -10.2
2005 11,146 884 8.6 252 -39 -13.4 3251 154 4.8
2006 13,396 2250 20.2 330 78 31.0 2130 -1121 -34.5
2007 13,720 324 2.4 252 -78 -23.6 3024 894 41.9
2008 13,825 105 0.8 259 7 2.8 3845 821 27.1
slight upward trend was experienced over the same period.
Figure 5: Annual change in percentage increase/decrease in fatalities and casualties over the 8-year period (2002 – 2009)
Figure 6: Number of crashes, vehicles involved and injury accidents over eight years (2002 – 2009)
The increasing trend in the number of vehicles involved in crashes and the number of road crashes over the eight years is clearly evident from Figure 6 below. A significant relationship
exists between these two variables: an increase in traffic volume (number of registered vehicles) leading to an increase in the number of road crashes. This inference is especially noticeable after 2005.
Road accidents are classified according to the severity thereof, into one of four categories, namely:
• Fatal accidents: an accident that results in the death of one or more persons (driver, cyclist, passenger or pedestrian). These accidents can include serious or slight injuries.
• Serious (major) accidents: an accident that involves serious injuries to one or more persons. It can also include slight injuries.
• Slight (minor) accidents: an accident in which one or more persons are slightly injured.
• Property damage: an accident which resulted in damage to the vehicle and/ or other property, but in which no person was killed or injured.
Injury accidents refer to those road accidents where at least one person was injured, or killed as a direct result of the accident. The police officer attending the scene determines the affected person’s level of injury at the time of the accident. If the injury level of the victim changes within 30 days of the crash occurrence, this has to be recorded on the NRAF.
With regard to the prevalence of injury accidents, a trend similar to that between vehicles and accidents was also apparent, albeit not as well-defined. While there appeared to be an increase in the number of injury accidents, the variation across the years did not follow a definite pattern. In order to gain a better understanding of the injury crash trend, the severity of the resultant injury was analysed in more detail.
Figure 7 on the previous page, displays the number of victims for the different levels of severity of injury over eight years, and reveals that there were marked differences in the numbers of affected road users. Calculating the average percentage across all eight years and levels of injury shows that 8 percent (281) were fatal and 33 percent (1,117) seriously injured, while 59 percent (1,981) of all injuries included those slightly injured.
The highest number of deaths occurred in 2006 (330). An increase in the number of people killed was reported for 2009 when compared to 2008 (19 deaths). Structures for the consistent follow-up of seriously injured people who were admitted to hospital and who might have succumbed within 30 days are not fully in place, meaning that possible changed injury statuses of victims were not adjusted on the accident form and that the number of lives lost on the roads could have been higher than reported.
The numbers of seriously and slightly injured road users follow similar patterns; a noticeable drop in numbers was reported for the first three years (2002 – 2004), with a slight increase in 2005, followed by a substantial decline in 2006. As from 2007 onwards, the number of seriously and slightly injured road users has been rising steadily.
Examining the ratio of road users killed, or seriously and slightly injured, against the total number of road accidents across the eight year span, revealed a slight downward trend for all three levels of injury. This decrease was most pronounced for the slightly injured victims. In conclusion, it can be said that there was an upward trend in the number of people injured as a direct result of road accidents over the eight years. However, if the increasing number of road accidents across the years is taken into account, the number of road user casualties, in fact, appears to have declined slightly.
Table 3: Number and rates in variation by crash counts for regional distribution, 2009
(55.3 percent), followed by Erongo, Oshana, Otjozondjupa, and Karas in that order, while Omusati was the least affected region (See Figure 8 next page).
Region Accidents Injury
accidents Killed Seriously injured Slightly injured Not Injured Damage only Reg. vehicles Projected population Fatalities / 1 000
registered vehicles
Fatalities/
10 000 people
Caprivi 211 44 10 22 35 283 167 2,310 87,058 4.3 1.1
Erongo 1,896 389 37 190 416 2,942 1,507 29,730 112,813 1.2 3.3
Hardap 298 86 13 53 83 436 212 5,682 71,514 2.3 1.8
Karas 593 139 15 86 116 773 454 11,709 72,645 1.3 2.1
Kavango 291 55 14 29 67 398 236 4,876 257,347 2.9 0.5
Khomas 8,590 895 47 374 847 14,137 7,695 122,537 325,459 0.4 1.4
Kunene 260 65 8 59 64 404 195 1,411 75,632 5.7 1.1
Ohangwena 242 76 12 45 72 416 166 2,348 261,323 5.1 0.5
Omaheke 312 89 20 79 107 398 223 5,766 78,477 3.5 2.5
Omusati 181 54 8 44 42 290 127 3,559 243,657 2.2 0.3
Oshana 1,350 381 62 226 352 2204 969 20,845 176,586 3.0 3.5
Oshikoto 260 62 10 46 53 410 198 4,646 181,304 2.2 0.6
Otjozondjupa 1,053 202 22 150 229 1350 851 14,387 159,947 1.5 1.4
Namibia 15,537 2,537 278 1,403 2,483 24,441 13,000 229,806 2,103,762 1.2 1.3
The regional distribution of crashes as displayed in Table 3 discloses that over half of all road accidents in 2009 happened in Khomas
Figure 8: Number of road crashes by region
Figure 9: Number of injury accidents and fatalities by region
In terms of the number of injury accidents across Namibia, the same regions occupied the top five positions in the same order. Nearly
80 percent of all road crashes with injuries happened in these regions: Khomas, Erongo, Oshana, Otjozondjupa and Karas. By contrast,
the five regions with the lowest number: Kunene, Oshikoto, Kavango, Omusati and Caprivi in that order, together made up only 11 percent of all injury accidents (See Figure 9). Comparing the number of fatalities by region for the year 2009 with those of 2008, Oshana, Erongo, Ohangwena, Kunene, Oshikoto, Otjozondjupa, and Hardap experienced an increase in the number of people killed on the road, with Oshana having lost 14 more lives. Erongo and Ohangwena recorded 9 and 7 more road deaths respectively, down to Hardap with
one more life lost. Fewer deaths from road crashes were reported for Omusati, Khomas, Karas, Caprivi, and Kavango (8, 5, 3, 2 and 1 respectively) while the number of deceased road users remained the same over the two years for Omaheke.
If the level of severity is taken into account however, and the number of fatalities is expressed as a rate per 10 000 population or per 1 000 registered vehicles, a completely different picture emerges as illustrated in Figure 10 below.
The highest number of fatalities per 10 000 people was reported for Oshana with almost four people in 10 000 (3.5) facing the chance of being killed in a road accident, followed by Erongo with three people killed (3.3) and Omaheke (2.5), Karas (2.1) and Hardap (1.8). The relationship between the population density and its fatality rate indicates how the population is affected. The population of Omaheke was highly affected by vehicle accidents as compared to Erongo and Oshana. Since Omaheke is sparsely populated and Erongo and Oshana are highly populated, the inference is that the more densely populated the area is, the lower the impact of vehicle collisions. Conversely, the more sparsely populated the area is, the higher the intensity of the vehicle collision. The population density is elaborated in Table 4 below. Other factors such as the higher degree of urbanisation, the safety level of the road network and traffic volume account for the higher number of road collisions observed in Oshana and Erongo, while a lower degree of urbanisation in Omaheke plays a role in the high number of deaths per population.
Looking at the number of fatalities per 1 000 vehicles, Figure 10 shows that Kunene at 5.7 ranked first as having the highest fatality rate per 1000 registered vehicles, followed by Ohangwena (5.1) and then Caprivi (4.3). Other regions where three or more road users were killed per 1 000 registered vehicles were Oshana (3.0) and Kavango (2.9). Amongst the regions reporting the lowest fatality rates were Karas (1.3), Erongo (1.2) and Khomas (0.4). From these statistics it can be deduced that the number of registered vehicles per region and
the associated fatality rate per 1 000 vehicles were negatively correlated. In other words, for regions with a low number of registered vehicles the fatality rate per 1 000 vehicles was amongst the highest while the opposite is true for those regions with a low fatality rate. In fact, Khomas with the lowest fatality rate had the highest number of registered vehicles of all regions (122,537) whereas Kunene with the highest fatality rate recorded the lowest number of registered vehicles (1,411). What the five regions with the highest fatality rates have in common is that they are amongst the less urbanised areas in Namibia, given that over two thirds of the population in those regions reside in rural areas. Conversely, the regions with low fatality rates per 1 000 vehicles – Karas, Khomas and Erongo – are the three most urbanised regions of Namibia, where more than half of the people live in urban areas (54 percent, 80 percent and 93 percent respectively). It should also be noted that Oshana recorded high fatality rates for both the number of vehicles registered and per population. This is the smallest region of all, but it has a high population density.
The inference that can be drawn from the above observation is that the degree of urbanisation of a region has an effect on the fatality rate. Amongst other factors, the safety level of the road network and speeding could explain this finding. In rural areas, the road network consists primarily of gravel, dirt or sand roads, while tarmac roads are more common in urban areas. Since travel on surfaces other than tarmac is associated with a higher risk of being involved in a fatal accident (such as single vehicle overturn), the finding that fatalities
were higher for regions with a predominantly rural population would seem credible. This inference has implications for road safety
management in terms of increasing the safety of the road network in rural areas.
Table 4 displays the relationship between the number of road crashes and the land area (in square kilometres) across the thirteen regions. Similar to the previous year, the accident rates per square kilometre for Khomas (0.23) and Oshana (0.16) were by far the highest of all regions in Namibia. Amongst the other five
highest ranks were Erongo, Ohangwena and Caprivi (0.03, 0.02 and 0.02 respectively). Regions which registered the lowest number of accidents per square kilometre were Omaheke, Karas, Hardap and Kunene (all 0.00) (See also Figure 11 next page).
Table 4: Number of crashes per square kilometre
Region Accidents Area in
sq.km Acc/Sq.km Reg. vehicles Projected population Population density
Caprivi 211 14,528 0.02 2,310 87,058 6.0
Erongo 1,896 63,579 0.03 29,730 112,813 1.8
Hardap 298 109,651 0.00 5,682 71,514 0.7
Karas 593 161,215 0.00 11,709 72,645 0.5
Kavango 291 48,463 0.00 4,876 257,347 5.3
Khomas 8,590 37,007 0.23 122,537 325,459 8.8
Kunene 260 115,293 0.00 1,411 75,632 0.7
Ohangwena 242 10,703 0.02 2,348 261,323 24.4
Omaheke 312 84,612 0.00 5,766 78,477 0.9
Omusati 181 26,573 0.01 3,559 243,657 9.2
Oshana 1,350 8,653 0.16 20,845 176,586 20.4
Oshikoto 260 38,653 0.01 4,646 181,304 4.7
Otjozondjupa 1,053 105,185 0.01 14,387 159,947 1.5
Figure 11: Density of crashes per square kilometre
Contrasting the number of people living in the region with the land area of the region discloses that overall regions with smaller land areas are more populated than regions whose land size is bigger (See Figure 12 next page). Combining this information with the prevalence of crashes per square kilometre leads to the following inference: regions with smaller land areas and high population densities reported proportionally more accidents than regions where the population is distributed over wider land areas.
Another factor which might have an effect on the number of road crashes per region is the traffic volume or Vehicle Kilometres Travelled (VKT).
The “VKT Summary Network” disseminated by the Roads Authority disaggregates the VKT by type of road (district, main or trunk), but does not include a regional breakdown. Therefore, a comparative analysis of fatality rates per 10 million VKT across the regions cannot be produced. On the national level, VKT increased by 11.4 percent from 2008 to 2009. Fatality rates per 10 million VKT have consistently decreased over the past three years from 0.57 in 2006 to 0.39 in 2009. These statistics lead to the broad conclusion that despite the fact that an increase in traffic volume was experienced over the past eight years, the fatality rate has decreased slightly.
Figure 12: Regional distribution of population, area (in square kilometres) and number of
Table 5: Type of crash by region Caprivi 1.4 211 35 0 16 66 26 1 24 9 5 1 20 5 3 Er ong o 12.2 1,896 440 4 102 72 237 76 180 145 87 101 363 20 69 Har dap 1.9 298 85 1 12 42 35 6 73 11 2 12 17 0 2 Kar as 3.8 593 243 1 26 62 64 10 95 23 2 19 39 4 5 Kav an go 1.9 291 45 0 19 102 60 4 22 9 1 6 16 5 2 Khomas 55.3 8,590 1,826 0 326 417 733 292 210 1,000 322 514 2,526 143 281 Kunene 1.7 260 43 0 3 99 25 0 52 9 3 5 17 4 0 Ohangw ena 1.6 242 19 0 19 34 41 5 40 19 8 15 20 12 10 Omahek e 2.0 312 60 0 4 101 25 2 71 9 4 4 24 2 6 Omusa ti 1.2 181 24 0 6 65 25 2 23 10 2 6 8 7 3 Oshana 8.7 1,350 162 0 127 186 151 49 101 128 41 72 263 41 29 Oshik ot o 1.7 260 43 0 7 86 18 10 37 13 5 11 21 3 6 Otjo zondjupa 6.8 1,053 201 2 17 368 114 12 149 41 18 38 77 6 10 Tot al 100.0 15,537 3,226 8 684 1,700 1,554 469 1,077 1,426 500 804 3,411 252 426
% of t
ot al 100.0 20.8 0.1 4.4 10.9 10.0 3.0 6.9 9.2 3.2 5.2 22.0 1.6 2.7
% of total Total Other unknown Collisions with train Collision with pedestrians
Collision with animals Collision with fixed object
Turn right in face of oncoming traffic Single vehicle overturn Sideswipe: same direction
Approach at angle: both travelling straight Sideswipe: opposite
directions Head-rear-end collision
Head-on collision Approach at angle: one or
Table 5 shows that the type of crash most prevalent in Namibia in 2009 was the head-rear-end collision, which accounted for 22.0 percent (3,411) of all road accidents followed by crashes with animals which made up 10.9 percent 1,700) and collisions with fixed objects that constituted 10.0 percent (1,554). Sideswipe collisions in the same direction, which made up 9.2 percent (1,426) and single vehicle overturns that accounted for 6.9 percent (1,077) were the fourth and fifth most common accidents to occur. Although crashes with pedestrians and head-on crashes were less frequent, with 4.4 percent (684) and 1.6 percent (252) respectively, their impact on the number and severity of injuries sustained by the road users involved was significant. This finding will be discussed in more detail in the next section.When investigating the regional distribution of the type of road crash in terms of frequency of occurrence, the types that ranked amongst the five most frequently occurring across all regions are summarised in Table 6. The road crashes listed under “Other/ Unknown” which constituted 20.8 percent (3,226) of all accidents have not been included in the ranking. A considerable number of these crashes fall under the category “Unknown” either because the collision report was incomplete or the accident type had not been identified and recorded by the police officer. “Other” crashes refer to minor accidents such as a stone hitting the vehicle’s window and parked vehicles that were bumped. Other
more serious accidents included vehicles that caught fire, passengers who fell or jumped from a vehicle, and drivers who lost control over the vehicle.
For Khomas, Erongo and Oshana, regions with bigger urban centres, head-rear-end crashes were the most common. Collisions with animals were the number one accident type for seven predominantly rural regions, where livestock farming is one of the main subsistence sources, and cattle, goats and donkeys often roam freely. The most common wild animals involved in collisions with vehicles were birds that crashed into the windscreens. More serious crashes included crashes with larger wild animals such as antelopes and elephants in Caprivi, Kavango and Otjozondjupa. As for the remaining regions, Hardap and Karas, single vehicle overturn was the most commonly occurring crash.
The second most frequently occurring collisions were crashes against fixed objects for the Caprivi, Erongo, Karas, Kavango and Omusati regions. Objects crashed against were most often pavements and trees. Single vehicle overturn was the second most common crash in Kunene, Ohangwena, Omaheke, Oshikoto and Otjozondjupa, all regions with a predominantly rural population. It is worthwhile to note that 55.0 percent (521) of all single vehicle overturns took place on sand/dirt, salt or gravel roads. (This excludes single vehicle overturns for which the type of road was not specified in the accident form).
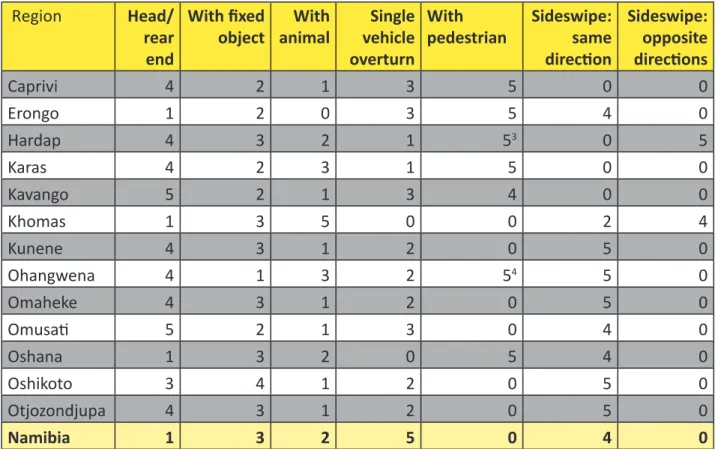
Table 6: Regional distribution of accident type ranked by frequency of occurrence2
Of the types of road crashes mentioned above, single vehicle overturns, crashes with pedestrians, and head-on collissions registered the highest number of fatalities in that order of
all types of crashes. Accidents involving fixed objects or animals generally did not result in fatalities but together they accounted for a substantial number of seriously and slightly injured road users.
2Ranking is established by the frequency of the type of crash, i.e. Rank 1 is allocated to that type of crash which has the highest
number of crash occurrences out of all crashes for the region.
3”With pedestrian” and “Sideswipe: opposite direction” had the same number of occurrences (12) 4”With pedestrian” and “Sideswipe: same direction” had the same number of occurences (19)
Region Head/
rear end
With fixed
object animalWith vehicle Single
overturn
With
pedestrian Sideswipe: same
direction
Sideswipe:
opposite
directions
Caprivi 4 2 1 3 5 0 0
Erongo 1 2 0 3 5 4 0
Hardap 4 3 2 1 53 0 5
Karas 4 2 3 1 5 0 0
Kavango 5 2 1 3 4 0 0
Khomas 1 3 5 0 0 2 4
Kunene 4 3 1 2 0 5 0
Ohangwena 4 1 3 2 54 5 0
Omaheke 4 3 1 2 0 5 0
Omusati 5 2 1 3 0 4 0
Oshana 1 3 2 0 5 4 0
Oshikoto 3 4 1 2 0 5 0
Otjozondjupa 4 3 1 2 0 5 0
ROAD TRAFFIC INJURIES
Road traffic injuries are classied according tothe level of severity, where severity refers to the extent of the injury sustained in an accident
5. This section discusses threee levels on injury: the number of persons killed, seriously injured or slightly injured as a direct result of a trffic accident.
This section discusses three levels of injury: the number of persons killed, seriously injured or slightly injured as a direct result of a traffic accident.
The severity of the injuries sustained by the road users involved is influenced by and interlinks with a number of factors such as the type of crash and extent of the impact of the
crash, which again is related to factors such as the speed of the vehicle(s) at the time of impact, driving while drunk or being under the influence of drugs; not wearing seatbelts, lack of child restraints and crash helmets, lack of vehicle crash protection for vehicle occupants, and driver fatigue.
This section discusses the type of accident and the resulting severity of injuries sustained. Highlighted are also details regarding the month, day of the week and time of the day when the accident occurred in relation to the number and type of injuries. This information assists road traffic management to devise appropriate measures to prevent road accidents.
Table 7: Type of crash and severity of injury
Type of crash Crashes Persons
Killed Serious injury injurySlight Total killed/ injured and injured % killed of total
Approach at angle: both travelling straight 500 0 24 75 99 2.4
Approach at angle: one or both turning 426 7 18 34 59 1.4
Head-on crash 252 22 67 110 199 4.8
Head-rear-end crash 3,411 11 89 244 344 8.3
Sideswipe opposite directions 804 13 48 100 161 3.9
Sideswipe same direction 1,426 4 41 105 150 3.6
Single vehicle overturn 1,077 96 529 753 1378 33.1
Turn right in face of oncoming traffic 469 2 28 87 117 2.8
Crash with animal 1,700 4 63 111 178 4.3
Crash with fixed object 1,554 8 64 125 197 4.7
road users (413) reported under the “Other/ Unknown” category was surprisingly high if one considers that a substantial number of minor accidents (such as a stone hitting the vehicle or a parked car being bumped) are included here. However, these types of accidents constituted 20.8 percent of all accidents reported. It can be assumed that the more serious incidents such as a vehicle catching fire or a passenger falling off the car, contributed most towards the number of killed and injured under this category. Due to the variation in the seriousness of the collision and associated impact on road users, the information gathered under this variable is of limited use in terms of road safety management. More useful would be a splitting of this category into sub-types that distinguish between “Unknown” (for incomplete information), “Other major crashes” and “Other minor crashes”.
Figure 13: Type of crash ranked by severity of injury: fatalities, serious and slight injuries A breakdown of the number of fatalities, serious
and slight injuries by type of crash is presented in Table 7 and Figure 13. Single vehicle overturns caused the highest percentage of injuries sustained of 33.1 percent (1,378). Accidents where pedestrians were hit or run over by a vehicle, constituting 19.9 percent (828), also counted as one of the most serious in terms of lives lost and injuries sustained. Together, single vehicle overturns and accidents with pedestrians made up 52.8 percent of the total number of injuries (169 fatalities; 802 serious injuries; 1,235 slight injuries). Although the percentage of head-on crashes was low at 4.8 percent (252) when compared to other types of crashes, they ranked as the fourth highest in terms of the number of fatalities (22) incurred as a result of the collision.
Sideswipe crashes in the opposite direction ranked fifth in terms of the number of people (13) who succumbed as a result of crashes. Despite the fact that 22.0 percent of all road crashes included head-rear-end crashes, the resultant number of fatalities was lower than for the other type of road crashes discussed above. However, when looking at the number of serious and slight injuries, this type of collision can be described as the sixth most severe type with a high incidence of serious (89) and slight (244) injuries.
Although collisions with animals and fixed objects ranked as the third and fourth most prevalent in terms of number of crashes, their major impact was on serious and slight injuries. Lesser fatalities were recorded for these two types of road crashes than any of the others mentioned so far. Collisions between two vehicles that approach at an angle while both were travelling straight registered the second lowest percentage of injured occupants (1.4
percent) with no fatalities. Crashes with trains caused slight injuries to two drivers and one passenger.
The road safety performance measure that assesses the number of young people (25 years and less) who were killed or injured by type of road traffic crash disclosed that 902 young road users were involved in road crashes. Table 8 on the following page displays the breakdown of the number of young people killed (50), seriously injured (323) and slightly injured (528) by type of road traffic crash. High numbers of casualties (286 or 31.7 percent) were recorded for single vehicle overturn and accidents with pedestrians (269 or 29.8 percent). “Other/ Unknown” crashes accounted for 9.1 percent (82), followed by head-rear-end crashes (63 or 7.0 percent), collisions with fixed objects (48 or 5.3 percent) and head-on crashes (29 or 3.2 percent). Single vehicle overturn and accidents with pedestrians claimed the lives of 38 (76.0 percent) young people and resulted in 222 (68.7 percent) serious injuries.
Table 8: Number of young people killed or injured by type of road traffic crash
Figure 14 (on page 34) shows that for eight months of the year the number of road crashes exceeded 1,300. The month with the highest number of crashes was July (1,472), followed by August, May and June. At the lower frequency end were January, December and February in ascending order. The surprisingly
low number of accidents for December could be attributed to the fact that no accident forms for that month were forwarded to the regional headquarters by five police stations (namely, Eenhana, Narraville, Omaruru, Rundu and Tsumeb) and that some of the road crashes which occurred in December may have only been reported in January the following year.
6The injury status of one pedestrian was not recorded on the accident form
Killed Serious Slight Total
Head/rear end 1 18 44 63
Head on 2 11 16 29
Sideswipe: opposite directions 1 6 19 26
Sideswipe: same direction 1 5 23 29
Turn right in face of oncoming traffic 0 5 12 17
Approach at angle: both travelling straight 0 5 16 21
Approach at angle: one or both turning 2 3 8 13
Single vehicle overturn 16 126 144 286
With fixed object 1 11 36 48
With pedestrian 22 96 150 268
With animal 0 6 13 19
Other/unknown 4 31 47 82
Total 50 323 528 9016
When exploring the level of severity by month, the month of May stood out as recording the highest number of injury accidents (243), and
Figure 14: Number of crashes per month
casualties (418) as elaborated in Table 9 and Figure 15. Increased traffic volume over the school holidays and the four public holidays was most probably the cause for this heavy toll. Table 9: Crashes and injury severity by month
Month Crashes crashesInjury Fatalities Serious Slight Damages only
January 1,092 171 21 91 182 921
February 1,191 200 30 95 193 991
March 1,317 219 27 116 201 1,098
April 1,251 204 19 127 200 1,047
May 1,361 243 35 137 246 1,118
June 1,338 208 14 82 200 1,130
July 1,472 222 19 97 235 1,250
August 1,378 213 18 158 215 1,165
September 1,328 230 21 125 231 1,098
October 1,329 210 21 105 192 1,119
November 1,306 208 25 135 185 1,098
December 1,174 209 28 135 203 965
Although the number of injury accidents for December was in the lower ranges (209), these accidents translated into a substantial number of fatalities (28) and serious injuries (135). Other months that recorded a considerable
number of deceased road users were February (30), March (27) and November (25). As for serious injuries, August was the month reporting the highest number (158).
Figure 15: Injury severity by month
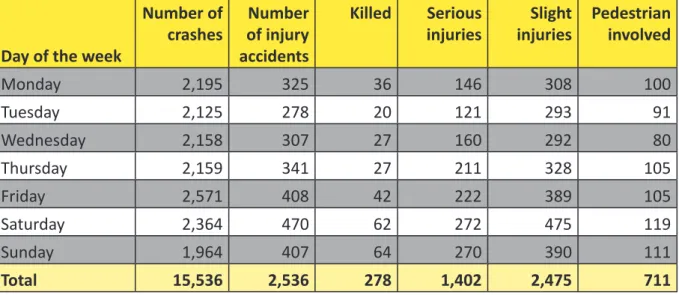
Table 10: Number of crashes and injury severity by day of the week
From the discussion above and the distribution of injury severity by month of previous accident reports, it transpires that March, April, May, August, November and December are the months in which targeted road safety programmes could be effective in reducing the
number of crashes and resultant casualties. However, the great variation in affected months across the years suggests that measures to reduce crashes should run throughout the year and not only during the indicated months and holiday seasons.
Unknown for “Day of the week” = 1 (0.006 percent). Not included in this table: 1 serious injury, 8 slight injuries.
Day of the week
Number of
crashes of injury Number
accidents
Killed Serious
injuries injuriesSlight Pedestrian involved
Monday 2,195 325 36 146 308 100
Tuesday 2,125 278 20 121 293 91
Wednesday 2,158 307 27 160 292 80
Thursday 2,159 341 27 211 328 105
Friday 2,571 408 42 222 389 105
Saturday 2,364 470 62 272 475 119
Sunday 1,964 407 64 270 390 111
As has been reported for previous years, a significant increase in the number of accidents was experienced over the weekend with Friday
identified as the day of the week with the highest risk of travel (2,571 crashes), followed by Saturday with 2364 crashes. (See Table 10 and Figure 16.)
Figure 16: Number of crashes by day of the week
While one would expect this trend to continue for Sunday with weekend travellers returning home, surprisingly this day of the week had the lowest number of accidents (1964). Instead, Monday recorded the third highest number of crashes (2,195). This might be due to a delay in reporting of accidents that happened on Sunday, or because some travellers returned home in the early hours of Monday morning only.
Comparing the injury levels across the days of the week confirms that weekends accounted for most of the injuries. One third of all fatalities, as well as serious and slight injuries, occurred between Saturday and Sunday. (See Figure 17 on page 37). Sunday registered the highest number of deaths.
If the days of the week are subdivided into the weekend (Friday, Saturday and Sunday) and the week, the number of fatally injured road users added up to 60.4 percent (168) for the weekend and 39.6 percent (110) over the week. Likewise, more people (764 or 54.5 percent) were seriously injured over the weekend than during the week where 45.4 percent (638) were injured.
Pedestrian involvement was most pronounced in crashes that took place over the weekend with Saturday recording the highest number (119), followed by Sunday (111), Friday (105), Thursday (105) and Monday (100).Wednesday was the day of the week with the lowest rate of pedestrian involvement.
Figure 17: Injury severity by day of the week
Table 11 and Figure 18 illustrate the relationship between the time of the day and the severity of injury. As was the case for the previous year, the safest time to be on the road in 2009 was between 22:01 at night and 6:00 in the
morning. From early morning onwards injury accidents increased steadily to reach a peak between 16:01 and 18:00. After that, traffic subsided and injury related accidents started to decline to reach their lowest level between 2:01 and 6:00.
Table 11: Injury severity by time of day
Unknown for “Time of the day” = 8 (0.1 percent)
Injuries not included in this table: 3 serious injuries and 8 slight injuries
Time of crash Fatal Serious Slight Total
00:01-2:00 14 91 156 261
2:01-4:00 12 46 54 112
4:01-6:00 7 38 42 87
6:01-8:00 16 105 184 305
8:01-10.00 11 100 184 295
10:01-12:00 25 110 215 350
12:01-14:00 30 158 298 486
14:01-16:00 31 146 305 482
16:01-18:00 33 197 361 591
18:01-20:00 54 207 333 594
20:01-22:00 33 146 242 421
22:01-24:00 12 56 101 169
Figure 18: Injury severity by time of the day
The highest number of fatal crashes occurred between 18:01 and 20:00 (54 people killed). Most serious injury related accidents also took place between 18:01 and 20:00 (207), while those involving slight injuries happened at peak hour traffic between16:01 and 18:00 (361).
Factors contributing to this trend are high traffic volumes coupled with stress and fatigue after a hectic working day, which may lead to careless driving and rude behaviour on the road. Intake of alcohol during that period, to relax after a busy day, might play a role too, as well as the reckless driving behaviour of taxis drivers competing for space and customers.