Electronic Theses and Dissertations Theses, Dissertations, and Major Papers
3-24-2019
Mesomorphic Dyes based on Conformationally Flexible
Mesomorphic Dyes based on Conformationally Flexible
1,3,5-Triazines
1,3,5-Triazines
Hi Taing
University of Windsor
Follow this and additional works at: https://scholar.uwindsor.ca/etd
Recommended Citation Recommended Citation
Taing, Hi, "Mesomorphic Dyes based on Conformationally Flexible 1,3,5-Triazines" (2019). Electronic Theses and Dissertations. 7659.
https://scholar.uwindsor.ca/etd/7659
This online database contains the full-text of PhD dissertations and Masters’ theses of University of Windsor students from 1954 forward. These documents are made available for personal study and research purposes only, in accordance with the Canadian Copyright Act and the Creative Commons license—CC BY-NC-ND (Attribution, Non-Commercial, No Derivative Works). Under this license, works must always be attributed to the copyright holder (original author), cannot be used for any commercial purposes, and may not be altered. Any other use would require the permission of the copyright holder. Students may inquire about withdrawing their dissertation and/or thesis from this database. For additional inquiries, please contact the repository administrator via email
By
Hi Taing
A Dissertation
Submitted to the Faculty of Graduate Studies Through the Department of Chemistry and Biochemistry
In Partial Fulfillment of the Requirements for The Degree of Doctor of Philosophy at the
University of Windsor
Windsor, Ontario, Canada
2019
by
Hi Taing
APPROVED BY:
__________________________________________________ T. Hegmann, External Examiner
Kent State University
__________________________________________________ P. Henshaw
Department of Civil and Environmental Engineering
__________________________________________________ J. Green
Department of Chemistry and Biochemistry
__________________________________________________ C. Macdonald
Department of Chemistry and Biochemistry
__________________________________________________ H. Eichhorn, Advisor
Department of Chemistry and Biochemistry
iii
DECLARATION OF CO-AUTHORSHIP / PREVIOUS
PUBLICATIONS
I. Co-Authorship Declaration
I hereby declare that this dissertation incorporates material that is the result of joint research, as follows:
Chapter 2 of this dissertation is published and co-authored with A. M. Cassar under the supervision of S. H. Eichhorn, and performed in collaboration with M. U. Ocheje under the supervision of S. Rondeau-Gagne, as well as T. H. El-Assad and C. A. Sharabati under the supervision of B. Kaafarani. M. U. Ocheje synthesized the starting material 3,6-di(thiophen-2-yl)pyrrolo[3,4-c]pyrrole-1,4(2H,5H)-dione, T. H. El-Assad and C. A. Sharabati synthesized the starting material 6,6'-dibromo-1,1'-dihexyl-[3,3'-biindoline]-2,2'-dione. All other reported molecules were synthesized by me with the assistance of A. M. Cassar.
Chapter 3 of this dissertation is unpublished and co-authored by J. Roddy under the supervision of S. H. Eichhorn. The synthesis of all reported molecules in this chapter was performed by me with the assistance of J. Roddy.
Chapter 4 of this dissertation is published and co-authored by J. G. Rothera under the supervision of S. H. Eichhorn and performed in collaboration with J. F. Binder under the supervision of C. L. B. Macdonald. The synthesis of all reported molecules in this chapter was performed by me with the assistance of J. G. Rothera. J. F. Binder collected and analyzed the single crystal XRD.
Chapter 5 of this dissertation is unpublished and co-authored by J. G. Rothera under the supervision of S. H. Eichhorn. The synthesis of all reported molecules in this chapter was performed by me with the assistance of J. G. Rothera.
iv
Chapter 7 is unpublished and co-authored by M. Cruz under the supervision of S. H. Eichhorn and performed in collaboration with S. M. Rhyno under the supervision of C. Risko. I performed the synthesis of all reported molecules with the assistance of M. Cruz. S. M. Rhyno collected and analyzed the DFT calculations, and C. Risko contributed to the writing of the DFT discussions.
In Chapters 2, 3, 4, 5, 6, and 7, the collection and anaylsis of UV-Vis and fluorescence spectra, cyclic voltammetry, differential scanning calorimetry (DSC), powder X-Ray diffraction, and DFT calculations were performed by me unless stated otherwise above. In all cases, the key ideas, primary contributions, experimental designs, data analysis, interpretation, and writing were performed by the author with significant input from S. H. Eichhorn.
I am aware of the University of Windsor Senate Policy on Authorship and I certify that I have properly acknowledged the contribution of other researchers to my thesis, and have obtained written permission from each of the co-author(s) to include the above material(s) in my thesis.
v II. Declaration of Previous Publication
This dissertation includes 2 original papers that have been previously published in peer reviewed journals, as follows:
Dissertati on
Chapter
Publication title/full citation Publication
status
Chapter 2 Self-assembly of board-shaped diketopyrrolopyrrole and isoindigo mesogens into columnar π-π stacks (Taing, H.; Cassar, A. M.; Ocheje, M. U.; Rondeau-Gagne, S.; El-Assaad, T. H.; Sharabati, C. A.; Kaafarani, B.; Eichhorn, S. H. ChemPlusChem, ASAP) Copyright Wiley-VCH Verlag GmbH & Co. KGaA. Reproduced with permission.
Published
Chapter 4 1,3,5-Triazine(trithiophenylcarboxylate)Esters Form Metastable Monotropic Nematic Discotic Liquid Crystals (Taing, H.; Rothera, J. G.; Binder, J. F.; Macdonald, C. L. B.; Eichhorn, S. H. Liq. Cryst. 2018, 45 (8), 1147–1154). Reproduced with permission.
Published
I certify that I have obtained written permission from the copyright owner(s) to include the above published material(s) in my dissertation. I certify that the above material describes work completed during my registration as a graduate student at the University of Windsor.
vi
written permission from the copyright owner(s) to include such material(s) in my dissertation.
vii
ABSTRACT
The development of electronic devices based on organic materials has been an extensive effort over the last two decades, in the search for more efficient, cost effective, and bio-compatible alternatives to inorganic semiconductors. Interest in discotic liquid crystals arises from their capacity to combine the high charge carrier mobilities found in crystalline compounds with the solubility, processability and flexibility encountered in amorphous materials.
This dissertation focuses on the development of mesomorphic dyes based on 1,3,5-triazines. The thesis begins with structures possessing a more conventional liquid crystal design (e.g. symmetric disk-shaped molecules with six or more side- chains) and progresses towards the synthesis of liquid crystals with little to no side-chains. The removal of side-chains may help promote 3-D charge transport and alleviate the detrimental effects associated with defects and charge trapping sites that are commonly encountered in discotic liquid crystals. The objective of this thesis is to develop structure property relations for these types of triazine derivatives. It starts with the molecular design, and is followed by the synthesis and characterization of mesomorphism and crystal structures, and finally, important optical and electronic properties that are also relevant to organic electronics.
viii
4) between the thiophene and side-chains afforded the less common discotic nematic phase, although it was metastable. A single crystal structure showed that the carboxylate linking group allowed for coplanar conformations of the side-chains and introduced strong dipole-dipole interactions with neighboring molecules that help stabilize the liquid crystal phase. Much more stable liquid crystal phases were obtained in Chapter 5 when the ester groups were exchanged with cyano acrylate groups that extended the π-system and are more electron withdrawing. Owing to the molecules’ conformational variability, these molecules possess numerous conformers with similar energies and different shapes (e.g. disk-like, rod-like, t-shaped structures). As a result, depending on the length of the side-chains used, different liquid crystalline phases were observed including the discotic nematic (triazines with ethyl, butyl, and octyl chains), smectic A and columnar lamellar phases (triazines with octyl and dodecyl chains). This demonstrates that shorter chains prefer nematic phases due to poor microphase segregation, while longer chains gave higher ordered phases because they are able to interdigitate and nanosegregate more effectively.
ix
DEDICATION
This dissertation is dedicated to my wife, Ally Taing.
x
ACKNOWLEDGEMENTS
This PhD has been a wonderful but challenging experience and it would not have been successful without the support I have received from many people.
First, I would like to thank Dr. S. Holger Eichhorn for his motivation, advice and patient guidance. His optimism and cheerful demeanor has made this PhD experience fun and exciting. He has taught me so much and has always encouraged me to push my limits. I am truly grateful to have him as my supervisor, life mentor and friend.
I also thank Dr. Green for his advice on organic problems and for sparking my interest in organic chemistry. Also, thank you to Dr. Macdonald, Dr. Henshaw and Dr. Hegmann for being a part of my committee and taking the time to critique this thesis. I am also grateful for the help of other researchers and staff at the University of Windsor, Dr. Gagne, Dr. Johnson, Dr. Revington, Dr. Auld, Joe Lichaa, Una, Ronan and Nedhal.
I would like to thank Prof. Sabine Laschat for taking me on as an exchange student at the University of Stuttgart and for showing me some of the beautiful things Germany/Autstria has to offer.
I would not have been able to achieve as much as I did without my team of undergrads, past and present. They have all contributed to my success and I hope I have played a small part in theirs as well. From the in-lab bantering, to soccer games and conferences (parties), they brought the fun and energy to the lab. To Jacob, Junghoon, Adam, Andre, Jake, Sheilan, and Vanessa, thank you for all of the help you have provided me and for your friendship.
xi
A special thank you to Joel, Chad, Kyle, DJ and many others for being amazing
friends and helping me get to where I am today.
None of this would have been possible without my parents, Kiem Taing and Tinh
Lam. They came to Canada with nothing and have worked so hard to ensure that I can
grow up having an easier life. I am so appreciative for everything they have done for me
and for instilling the qualities needed to be successful in life.
Finally, a huge thank you to my beautiful wife, who this dissertation is dedicated
to. She has been there from the very beginning and gave me the confidence needed to
take on this challenging PhD. Thank you Ally for being so patient and loving, and most
importantly, for giving me a reason to smile every day.
xii
TABLE OF CONTENTS
DECLARATION OF CO-AUTHORSHIP / PREVIOUS PUBLICATIONS ... iii
ABSTRACT ... vii
DEDICATION ... ix
ACKNOWLEDGEMENTS ...x
LIST OF TABLES ... xvii
LIST OF FIGURES ... xix
LIST OF SCHEMES... xxxi
LIST OF ABBREVIATIONS/SYMBOLS ... xxxiii
CHAPTER 1: Self-Assembly of Small Molecule Liquid Crystals ...1
1.1 General Introduction ... 1
1.2 Introduction to Liquid Crystals ... 2
1.2.1 Classes of Liquid Crystals ... 2
1.3 Discotic Liquid Crystals ... 3
1.3.1 Design Features ... 4
1.3.2 Discotic Phases ... 6
1.4 Characterization Methods of Liquid Crystals ... 9
1.4.1 Polarized Optical Microscopy ... 9
1.4.2 Differential Scanning Calorimetry ...10
1.4.3 Powder X-Ray Diffraction ...12
1.5 Discotic Liquid Crystals as Organic Semiconductors ...13
1.5.1 Mechanism of Charge Transport ...14
1.5.2 Tuning Charge Transfer Integrals and Reorganization Energies ...15
xiii
1.6 Liquid Crystals based on 1,3,5-Triazines ...21
1.6.1 Synthetic Approaches to 1,3,5-Triazines ...23
1.7 Scope of Thesis ...26
References ...27
CHAPTER 2: Self-assembly of board-shaped diketopyrrolopyrrole and isoindigo mesogens into columnar - stacks ...34
2.1 Introduction ...34
2.2 Results and Discussion...35
2.3 Conclusion...42
2.4 Experimental...43
2.4.1 Materials ...43
2.4.2 Methods ...43
2.4.3 Synthesis and Characterization ...44
2.5 References...49
Supporting Information to Chapter 2 ...53
CHAPTER 3: Synthesis and characterization of 2,4,6-tristhiophenyl-1,3,5-triazines with alkyl, chloro, and carbonitrile groups ...68
3.1 Introduction ...68
3.2 Results and Discussion...70
3.2.1 Synthesis ...70
3.2.2 Thermal Properties ...73
3.2.3 UV-Vis and Aggregation Induced Emission...78
3.2.4 Cyclic Voltammetry and DFT Studies ...80
3.3 Conclusions ...81
3.4 Experimental...81
xiv
3.5 References...92
Supporting Information to Chapter 3 ...97
CHAPTER 4: 1,3,5-Triazine(trithiophenylcarboxylate)esters form metastable monotropic nematic discotic liquid crystals ...113
4.1 Introduction ... 113
4.2 Results and Discussion... 114
4.2.1 Synthesis ... 114
4.2.2 Single Crystal Structure of 3a ... 115
4.2.3 Mesomorphism ... 118
4.2.4 Contact sample of the nematic phase of compound 3e with the crystalline phase of chiral compound 3i... 122
4.3 Conclusion... 123
4.4 Experimental... 124
4.4.1 Materials ... 124
4.4.2 Methods ... 124
4.4.3 Synthesis and Characterization ... 124
4.5 References... 130
Supporting Information to Chapter 4 ... 134
CHAPTER 5: Polymesomorphic 1,3,5-triazines by design ...143
5.1 Introduction ... 143
5.2 Results and Discussion... 145
5.3 Conclusion... 153
5.4 Experimental... 154
5.4.1 Materials ... 154
xv
5.4.3 Synthesis and Characterization ... 155
5.5 References... 162
Supporting Information to Chapter 5 ... 164
CHAPTER 6: Side-chain free conformationally flexible tetracyclic heteroaromatic derivatives of low-symmetry show low melting points and high solubilities ...199
6.1 Introduction ... 199
6.2 Results and Discussion... 201
6.2.1 Synthesis ... 201
6.2.2 Thermal Analysis ... 203
6.2.3 Solubility ... 207
6.2.4 Ground State Conformations ... 208
6.2.5 Crystal Packing Structure ... 209
6.2.6 Optical Properties ... 210
6.2.7 Theoretical Calculations ... 211
6.3 Conclusion... 213
6.4 Experimental... 214
6.4.1 Materials ... 214
6.4.2 Methods ... 214
6.4.3 Synthesis and Characterization ... 215
6.5 References... 219
Supporting Information to Chapter 6 ... 223
CHAPTER 7: Mesomorphic low-symmetry donor-acceptor 1,3,5-triazine dye shows extended absorption due to meta-coupling ...238
7.1 Introduction ... 238
7.2 Results and Discussion... 239
xvi
7.4 Experimental... 248
7.4.1 Materials ... 248
7.4.2 Methods ... 248
7.4.3 Synthesis and Characterization ... 249
7.5 References... 255
Supporting Information to Chapter 7 ... 259
CHAPTER 8: Summary and Future Work ...280
8.1 Summary ... 280
8.2 Future Work ... 281
8.3 References: ... 284
APPENDIX ...285
A1: Copyright Permissions ... 286
A2: NMR Spectra and crystallographic data ... 289
xvii
LIST OF TABLES
Table 1: Phase behaviour of discotic LCs based on 1,3,5-triazines. ... 21
Table 2.1: Red/Ox potentials, HOMO/LUMO energies and experimental and calculated HOMO/LUMO gaps. ... 42
Table SI-2.1: Variable temperature pXRD data of DPP-LC... 54
Table SI-2.2: Variable temperature pXRD data of II-LC. ... 59
Table 3.1: Red/Ox potentials, HOMO/LUMO energies and experimental and calculated HOMO-LUMO gaps. ... 80
Table SI-3.1: Geometry optimized structures and frontier orbital distributions of TT derivatives with ethyl chains. ... 99
Table 5.1: Summary of core and chain volumes and the liquid crystalline phase observed. ... 150
Table SI-5.1: Phase behaviour of compounds 8 with transition temperatures in °C and (enthalpies in kJ/mol). Cr = crystalline phase; SC = soft crystal phase; Collam = lamellar phase with columnar stacking of the cores; N = nematic; I = isotropic liquid. [a]Cold crystallization ... 165
Table SI-5.2: Summary of pXRD data for 8-C2. ... 167
Table SI-5.3:Summary of pXRD data for 8-C4. ... 170
Table SI-5.4: Summary of pXRD data for 8-C4R. ... 172
Table SI-5.5: Summary of pXRD data for 8-C8. ... 174
Table SI-5.6: Summary of pXRD data for 8-C8R. ... 180
Table SI-5.7: Summary of pXRD data for 8-C12. ... 182
Table SI-5.8: Redox potential and estimated LUMO energy of 8-C8. ... 189
xviii
Table SI-5.10: Structure discotic nematic cores reported in literature and comparison of the ratio between the volume of core to total side chain volume... 191
Table 6.1: Transition temperatures and enthalpies of all triazine derivatives. ... 203
Table 6.2: Comparison of the melting points and molecular weights of conformationally flexible symmetric triazines with rigid aromatic systems. ... 207
Table 6.3: Summary of optical and electronic properties of symmetric and low-symmetry triazines derivatives... 212
Table SI-6.1: TD-DFT (B3LYP/6-311G+d) determined frontier orbital distribution, energies, and calculated UV-Vis spectra of of low-symmetry and symmetric triaiznes. ... 225
Table 7.1: Redox potentials and estimated HOMO and LUMO energies... 242
Table SI-7.1: ... 262
Table SI-7.2:
analogs of 3, 4, 7, and 11 (denoted 3b, 4b, 7b, and 11b, respectively) as determined via TDDFT calculations at the PBE0/6-31+G(d,p) level. The ground state geometries of these analogs were optimized via DFT at the PBE0/6-31+G(d,p) level, and minima were confirmed by normal mode analyses. ... 268
Table SI-7.3: Relative rotamer energies (eV), dipole moments (D), and select information pertaining to the S0-S1 as determined at the PBE0/6-31+G(d,p) level. A key representing the nomenclature used in the rotamer naming is given in Figure SI-7.17. ... 271
Table SI-7.4: Bond dissociation energies for removal of hydrogen from hydroxyl group at the PBE0/6-31+G(d,p) level for the structures shown in Figure SI-7.24. . 275
xix
LIST OF FIGURES
Figure 1.1: Schematic illustration of an ionic switch induced by a thermoreversible phase transition between a columnar rectangular and hexagonal phase. Reprinted (adapted) with permission from Ref 9. Copyright (2015) American Chemical Society. ... 1
Figure 1.2: Molecular structure and packing behavior of calamitic vs. discotic LCs. ... 3
Figure 1.3: Examples of cores, connecting groups and side-chains used in discotic LCs. ... 6
Figure 1.4: Types of nematic phases: a) discotic nematic, b) chiral discotic nematic, c) discotic columnar nematic, d) discotic nematic lateral. ... 7
Figure 1.5: Types of columnar phases: d) columnar hexagonal, e) columnar rectangular, f) columnar oblique. ... 8
Figure 1.6: Homeotropic and planar alignment of discotic LCs. ... 9
Figure 1.7: POM image (crossed polarizers) showing gradual crystal growth into nematic LC phase. ... 10
Figure 1.8: Generic DSC curve of a LC on heating and cooling with hysteresis. ... 11
Figure 1.9: Small and wide angle 2-D diffractogram of trimethyl-benzenammonium cation in the columnar rectangular phase at 100 °C (left) and columnar hexagonal phase at 160 °C (right). Reprinted (adapted) with permission from Ref 9. Copyright (2015) American Chemical Society. ... 13
Figure 1.10: The effect of vertical, lateral, and rotational displacement of cofacial dimers on charge transfer integral.51 The starting point refers to cofacial dimers
with a π-stacking distance of 0.34 nm. The percentage value refers to the decrease in charge transfer integral upon changing one molecules position while the other remains static. ... 16
xx
Figure 1.12: Indene and pseudoazulene based side-chain free discotic LCs. ... 19
Figure 1.13: Effect of isomerism on mesomorphism. ... 20
Figure 1.14: Effect of adding/removing or changing polarizable groups on mesomorphism. ... 21
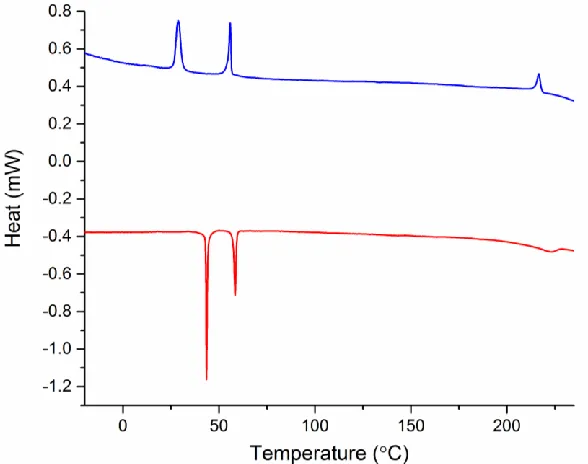
Figure 2.1: Phase behaviour and POM images (crossed polarizers) of DPP-LC and II-LC. DSC onset temperatures in °C and (transition enthalpies in kJ/mol). POM images of DDP-LC at (a) 25 °C in its Cr2 phase and (b) 188 °C in its Colo phase and of II-LC at (c) 38 °C in its Cr1 phase and (d) 180 °C in its Colr phase. Cr = crystalline, Colo/r = oblique/rectangular columnar mesophase, I = isotropic liquid. ... 38
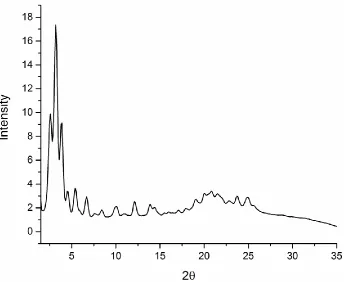
Figure 2.2: Diffraction patterns of crystalline and columnar liquid crystalline phases of DPP-LC and II-LC. The wide-angle diffraction peaks are enlarged along the y-axis because of their much lower intensity compared to the small-angle peaks. ... 39
Figure 2.3: Packing structures of Colo and Colr mesophases of DPP-LC and II-LC, respectively. Molecules are shown with fully extended aliphatic chains. ... 40
Figure 2.4: UV-Vis absorption and emission of DPP-LC and II-LC in CH2Cl2. ... 41
Figure SI-2.1: DSC of DPP-LC at 5 °C/min under N2. Shown are the 2nd heating and 1st cooling runs. No difference was observed for subsequent heating and cooling runs. ... 54
Figure SI-2.2: Diffraction pattern of DPP-LC at -33 °C on cooling (Cr1). ... 57
Figure SI-2.3: Diffraction pattern of DPP-LC at 34 °C on cooling (Cr2). ... 57
Figure SI-2.4: Diffraction pattern of DPP-LC at 180 °C (Colo). ... 58
Figure SI-2.5: Deconvoluted wide angle region of DPP-LC on cooling... 58
Figure SI-2.6: DSC of II-LC at 5 °C/min. Shown are the 2nd heating and 1st cooling runs. No difference was observed for subsequent heating and cooling runs. ... 59
xxi
Figure SI-2.8: Diffraction pattern of II-LC at 45 °C on cooling. (crystalline Col phase Cr2) ... 63
Figure SI-2.9: Diffraction pattern of II-LC at 183 °C. (Colr) ... 63
Figure SI-2.10: Deconvoluted wide angle region of II-LC at 183 °C. ... 63
Figure SI-2.11: Voltammogram of blank sample (CH2Cl2, NBu4PF6) at 100 mV/s. The peak in the left CV graph is attributed to small amounts of water. ... 64
Figure SI-2.12: Voltammogram of DPP-LC (CH2Cl2,NBu4PF6) at 100 mV/s. The peak
at -0.9 eV is attributed to water. ... 64
Figure SI-2.13: Voltammogram of II-LC (CH2Cl2, NBu4PF6) at 100 mV/s. The peak at
-0.9 eV is attributed to water. ... 64
Figure SI-2.14: UV-Vis of DDP-LC and II-LC as thin film on quartz at room temperature. ... 65
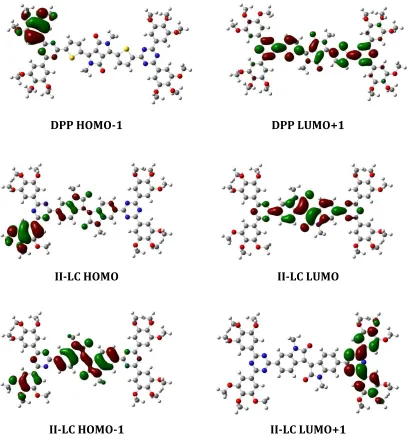
Figure SI-2.15:. HOMO-1, HOMO, LUMO and LUMO+1 Orbitals of DPP-LC and II-LC. ... 66
Figure SI-2.16: Packing structures of Colo and Colr mesophases of DPP-LC and II-LC,
respectively. ... 67
Figure 3.1: Phase transitions temperatures in °C (enthalpies in kJ/mol) of TT based on DSC at 10 °C·min-1. (solid line) 1st heating, (dotted line) 1st cooling, (dashed line)
2nd heating. Cr(m) refers to partial melting of crystalline phase and Cr(c) refers to a
cold crystallization. [a] A glass transition on cooling is observed by POM but not traceable by DSC. POM shows an isotropic material that does not flow when pressed between glass slides. ... 73
Figure 3.2: Structures of triazines and their different conformers: (a) unsubstituted symmetric triazine (b) TT-C4C4, and (c) TT-C4. ... 75
xxii
Figure 3.4: Diffractograms of TT-C8, TT-C4C4, and TT-C8Cl as precipitated at 25 °C and TT-C8CN at 114 °C on cooling from isotropic melt. ... 78
Figure 3.5: (Top) UV-Vis spectra of TT-C4, TT-C4C4, TT-C4Cl, and TT-C4CN in CH2Cl2. (Bottom) Emission spectra of TT-C8, TT-C8C8, TT-C8Cl, and TT-C8CN as
thin-films on quartz slide... 79
Figure SI-3.1: Cyclic voltammogram of CH2Cl2 and tetrabutyl ammonium
hexafluorophosphate at 100 mV/s. ... 97
Figure SI-3.2: Cyclic voltammogram of TT-C4 at 100 mV/s. ... 97
Figure SI-3.3: Cyclic voltammogram of TT-C4C4 at 100 mV/s. ... 98
Figure SI-3.4: Cyclic voltammogram of TT-C6Cl at 100 mV/s. ... 98
Figure SI-3.5: Cyclic voltammogram of TT-C4CN at 100 mV/s... 98
Figure SI-3.6: Rotational barrier of thiophene arm om TT-C2. ... 103
Figure SI-3.7: Rotational barrier of side-chain in TT-C2Cl. ... 104
FigureSI-3.8: DSC curve of TT-C4. ... 105
Figure SI-3.9: DSC curve of TT-C6. ... 105
Figure SI-3.10: DSC curve of TT-C8. ... 106
Figure SI-3.11: DSC curve of TT-C4C4. ... 106
Figure SI-3.12: DSC curve of TT-C8C8. ... 107
Figure SI-3.13: DSC curve of TT-C4Cl. ... 107
Figure SI-3.14: DSC curve of TT-C6Cl. ... 108
Figure SI-3.15: DSC curve of TT-C8Cl. ... 108
Figure SI-3.16: DSC curve of TT-C4CN. ... 109
Figure SI-3.17: DSC curve of TT-C8CN. ... 109
Figure SI-3.18: pXRD pattern of TT-C8 at 25 °C (as precipitated). ... 110
xxiii
Figure SI-3.20: pXRD pattern of TT-C8Cl at 25 °C (as precipitated). ... 111
Figure SI-3.21: pXRD pattern of TT-C8CN at 114 °C (plastic crystal phase). ... 111
Figure SI-3.22: pXRD pattern of TT-C8CN at 75 °C (crystal phase). ... 112
Figure 4.1: Single crystal X-ray structure of 3a. Shown are (a) the molecular structure of 3a, (b) its packing within a layer, (c) its vertical helical column packing, and (d) a view down a helical column with thienyl arms hidden for clarity. ... 117
Figure 4.2: Dipole interactions between two carbonyl groups and between carbonyl and ether groups of molecules in neighbouring columns and adjacent layers. The bottom right molecule is one layer above the top left molecule. ... 117
Figure 4.3: Phase transitions temperatures and enthalpies of 3a – i based on DSC at
[a] 10 ºC·min-1; [b] 2 ºC·min-1; [c] 20 ºC·min-1. ... 119
Figure 4.4: (a) Schlieren textures of 3e at two different magnifications (crossed polarizers, 45 ºC). (b) pXRD patterns of 3e in the isotropic (90 °C), nematic (40 °C) and crystalline phases (23 °C). ... 120
Figure 4.5: (a) Mechanical agitation of the nematic phase of 3e at 40 °C results in a localized crystallization. (b) Heating of this sample to 60 °C clears the nematic phase but not the crystalline domains (c) and enhances the growth of the crystalline domains here shown 5 minutes later. ... 121
Figure 4.6: POM image (crossed polarizers) of a contact sample between 3e and 3i in a liquid crystal cell with parallel homogenous alignment layer at 27 °C. ... 122
Figure SI-4.1: DSC Curve of 3a at 10 °C/min ... 134
Figure SI-4.2: DSC Curve of 3b at 2 °C/min. ... 134
Figure SI-4.3: DSC Curve of 3b at 10 °C/min. ... 135
Figure SI-4.4: DSC Curve of 3b at 20 °C/min. ... 135
Figure SI-4.5: DSC Curve of 3b at 2 °C/min. ... 136
xxiv
Figure SI-4.7: DSC Curve of 3c at 20 °C/min. ... 137
Figure SI-4.8: DSC Curve of 3d at 10 °C/min. ... 137
Figure SI-4.9: DSC Curve of 3e at 10 °C/min. ... 138
Figure SI-4.10: DSC Curve of 3f at 10 °C/min. ... 138
Figure SI-4.11: DSC Curve of 3g at 10 °C/min. ... 139
Figure SI-4.12: DSC Curve of 3h at 10 °C/min. ... 139
Figure SI-4.13: DSC Curve of 3i at 10 °C/min. ... 140
Figure SI-4.14: Variable temperature diffraction pattern of 3e. ... 140
Figure SI-4.15: Diffraction pattern of 3e in nematic and isotropic phase. ... 141
Figure 5.1: Compounds with structural features (i) to (iii) that display discotic nematic mesomorphism. ... 144
Figure 5.2: Phase behaviour of triazines 8 on cooling from the isotropic melt. Enthalpies are reported in the bars in kJ/mol. Some decomposition is observed in 8-C2 at temperatures above ~275 °C. ... 147
Figure 5.3: POM textures (crossed polarizers) of 8-C8 sandwiched between glass slides in (a) nematic, (b) columnar hexagonal and (c) columnar lamellar phase. POM textures of 8-C8 in a liquid crystal cell (Instead LC3.50) with a planar alignment layer in the (d) nematic, (b) smectic, and (f) columnar lamellar phase. ... 148
Figure 5.4: Proposed model for layered packing of 8-C8 and 8-C12 in a rod-like conformation. ... 149
Figure 5.5: Contact sample (crossed polarizers) in a planar alignment cell between 8-C4R and 8-C4 at 230 °C (top) and 8-C8R and 8-C8 at 180 °C (bottom). Images obtained on cooling from the isotropic melt. ... 152
Figure 5.6: Absorption spectra of 8-C8 in CH2Cl2,and the absorption and aggregation
xxv
Figure SI-5.1: DSC Curve of 8-C2 at 10°C/min under N2 (first heating and cooling).
Slow decomposition starts above 280 °C. ... 167
Figure SI-5.2: pXRD patterns of 8-C2 at various temperatures. ... 169
Figure SI-5.3: DSC Curve of 8-C4 at 10 °C/MIN UNDER N2 (2nd heating and 1st
cooling). ... 170
Figure SI-5.4: pXRD pattern of 8-C4 at various temperatures. ... 172
Figure SI-5.5: DSC curve of 8-C4R at 5 °C/min under N2 (2nd heating and 1st cooling).
... 172
Figure SI-5.6: DSC Curve of 8-C8 at 5 °C/min under N2 (2nd heating and 1st cooling).
... 173
Figure SI-5.7: DSC Curve of 8-C8 at 5 °C/min under N2 (2nd heating and 1st cooling).
... 174
Figure SI-5.8: POM images of 8-C8 in an alignment cell (Instec LC3-5.0 m, planar
(homogenous) alignment) at different magnifications. From left to right: nematic, SmA,
and Collamellar... 174
Figure SI-5.9: Possible packing structures of 8-C8. ... 178
Figure SI-5.10: pXRD patterns of 8-C8 at various temperatures. ... 180
Figure SI-5.11: DSC Curve of 8-C8R at 5 °C/min under N2 (2nd heating and 1st
cooling). ... 180
Figure SI-5.12: pXRD of 8-C8R at 30 °C as obtained (SC). The same pattern is obtained on cooling from the isotropic liquid. ... 181
Figure SI-5.13: DSC Curve of 8-C12 at 5 °C/min under N2 (2nd heating and 1st
cooling) ... 182
Figure SI-5.14: Proposed packing structures of 8-C12. ... 185
Figure SI-5.15: pXRD patterns of 8-C12 at various temperatures. ... 186
xxvi
Figure SI-5.17: Static POM images of a contact sample between 8-C4 and 8-C4R in an alignment cell (Instec LC3-5.0 m, planar/homogenous alignment). Samples were heated into the isotropic phase and allowed to mix for 20 minutes. The samples were then slowly cooled and images were captured after 5 minutes at the given temperatures shown above. ... 187
Figure SI-5.18: Static POM images of a contact sample between 8-C8 and 8-C8R in an alignment cell (Instec LC3-5.0 m, planar/homogenous alignment). Samples were heated into the isotropic phase and allowed to mix for 20 minutes. The samples were then slowly cooled and images were captured after 5 minutes at the given temperatures shown above. ... 188
Figure SI-5.19: Absorption spectra of 8-C8 in CH2Cl2. Absorption and emission
spectra of 8-C8 on thin film (red). ... 189
Figure SI-5.20: Optimized structure of 8-C2 and its frontier orbitals and their energy. ... 189
Figure SI-5.21: Geometry optimized core of compound 8 (left) and single crystal structure of triethyl 5,5',5''-(1,3,5-triazine-2,4,6-triyl)tris(thiophene-2-carboxylate) (right). ... 190
Figure SI-5.22: Relative energies of different conformations of 8-C2. ... 197
Figure SI-5.23: Relative energies of conformers and isomers of thiophene cyanoacrylates. ... 198
Figure 6.1: DSC curves of P2T3T at different heating rates; (red) 2 °C/min, (blue) 10 °C/min, (green) 20 °C/min. ... 205
Figure 6.2: DSC curves of P2T3T and P2T2F on cooling at 1 °C min-1 and a 1:1 mol
mixture of P2T3T and P2T2F at 10 °C min-1. ... 206
Figure 6.3: Packing structure of P2T2F. ... 209
Figure 6.4: Packing structure of P2TBT. ... 210
xxvii
Figure 6.6: HOMO and LUMO orbitals and their energies of low-symmetry triazine derivatives. ... 213
Figure SI-6.1: UV-Vis spectra of symmetric triazines 2TTT, 3TTT, and PPP. ... 223
Figure SI-6.2: DFT (B3LYP/6-311G+d) conformational analysis of P2T3T. Rotation of 2-thiophene, 3-thiophene and pyrazole groups. ... 225
Figure SI-6.3: DSC curve of PPP. ... 234
Figure SI-6.4: DSC curve of 2TTT. ... 234
Figure SI-6.5: DSC curve of 3TTT. ... 235
Figure SI-6.6: DSC curve of P2T2T. ... 235
Figure SI-6.7: DSC curve of P2T3T. ... 236
Figure SI-6.8: DSC cruve of P2TBT. ... 236
Figure SI-6.9: DSC curve of P2TC. ... 237
Figure SI-6.10: DSC curve of a 1:1 mol mixture of P2T3T and P2T2F. ... 237
Figure 7.1: UV-vis absorption spectra of compounds 4, 7, and 11 in CH2Cl2 solution
and of 11 as a thin-film on quartz. ... 242
Figure 7.2: TDDFT-derived (PBE0/6-31+G(d,p)) spectra of 11 for a selection of constrained, ground-state optimized rotamers (see SI for all calculated spectra). . 244
Figure 7.3: Bond lengths along the shared portion of the conjugated backbone for molecules 3, 4, 7, and 11. Inset shows bond indexing. ... 245
Figure 7.4: Optical micrographs and transmission X-ray diffraction patterns of compounds 4, 7, and 11 at 25 °C. ... 247
Figure SI-7.1: UV-Vis spectra of 11 in CH2Cl2 at different concentrations. ... 259
Figure SI-7.2: UV-Vis Spectra of 11 in CH2Cl2 at different concentrations with tangent
lines for the calculation of absorbance ratios in Table SI-7.1. ... 259
xxviii
Figure SI-7.4: Normalized UV-Vis spectra of 4, 7, 11 and 1:1 mol mixture of 4 and 7 as thin film on quartz. ... 260
Figure SI-7.5: Normalized UV-Vis spectra of 11 in various solvents at different concentrations and the area under the curve from 460 nm to 670 nm shown. The relative intensity of the absorption of the long wavelength tails remained unchanged. ... 261
Figure SI-7.6: Cyclic voltammograms of solvent + electrolyte, 4, 7 and 11. ... 263
Figure SI-7.7: DSC curves of 3 at 5 °C/min (red and green are the first and second heating runs, blue and purple are the first and second cooling runs, respectively). ... 263
Figure SI-7.8: DSC curves of 4 at 5 °C/min (red and green are the first and second heating runs, blue and purple are the first and second cooling runs, respectively). ... 264
Figure SI-7.9: DSC curves of 7 at 5 °C/min (black and blue are the first and second heating runs, red and green are the first and second cooling runs, respectively). .. 264
Figure SI-7.10: DSC curve of 11 at 5 °C/min (red is cooling, blue is heating). The irreversible melting transition observed by POM and XRD is not seen by DSC because of its broad temperature range and probably low enthalpy. ... 265
Figure SI-7.11: Variable temperature pXRD measurements of 11 on heating. The low intensity reflections observed for the isotropic material between 10 – 30 2-theta are likely caused by slowly formed polymeric material, although the fully polymerized sample is optically isotropic. ... 265
xxix
Figure SI-7.13: Polarized micrograph (polarizers at an angle of 80º) of compound 11 in its isotropic liquid phase at 208 ºC. The compound has converted into an insoluble amorphous material, which is indicative of a polymerization. ... 266
Figure SI-7.14: TDDFT-derived spectra of molecules 3 (top left), 4 (top right), 7 (bottom left), and 11 (bottom right) at the PBE0/6-31+G(d,p) level. ... 267
Figure SI-7.15: Hole (blue) and electron (silver) for the first bright excited state (S0
-S3) of molecule 11 with the transition dipole moment (2.67 Debye) (green) at the
PBE0/6-31+G(d,p) level of theory. ... 268
Figure SI-7.16: Hole (left) and electron (right) distributions for the first bright excited state of each molecule at the PBE0/6-31+G(d,p) level. Molecule, transition, NTO coefficient: (A) 3, S9, 0.86; (B) 4, S4, 0.99; (C) 7, S5, 0.99; (D) 11, S0-S3, 1.00. ... 269
Figure SI-7.17: Torsional barriers for the functional arms of 3, 4, 7, and 11 at the PBE0/6-31+G(d,p) level. Angles for the torsion between the triazine core and the thiophene ring that may be functionalized with the vinyl malononitrile group (A) and the torsion between the triazine core and the thiophene that may be functionalized with the pyrrolidine group (B) begin at 0° with the sulfur in an anti configuration with respect to the pyrazole and finish at 180° in a syn configuration. The torsion angles for the pyrazole group (C) and the cyano group (D) begin in the orientations shown in the insets. Dashed black lines correspond to the fragments that contain only the necessary functional groups for the torsion, solid black lines correspond to 3, blue corresponds to 4, green corresponds to 7, and red corresponds with 11. ... 270
Figure SI-7.17: Key representing the nomenclature used in the rotamer naming Table S3. Different permutations of l, r, u, and d were considered (not all permutations are shown in the key). ... 271
xxx
Figure SI-7.20: TDDFT-derived spectra of 11 derived at the PBE0/6-31+G(d,p) level of theory for a constrained, ground-state optimized where the pyrrolidine group is rotated in 10⁰ increments from 0 – 180⁰. ... 273
Figure SI-7.21: TDDFT-derived spectra of 11 derived at the PBE0/6-31+G(d,p) level of theory for a constrained, ground-state optimized where the pyrrolidine-thiophene group is rotated in 10⁰ increments from 0 – 180⁰. ... 273
Figure SI-7.22: TDDFT-derived spectra of 11 derived at the PBE0/6-31+G(d,p) level of theory for a constrained, ground-state optimized where the vinyl malononitrile group is rotated in 10⁰ increments from 0 – 180⁰. ... 274
Figure SI-7.23: TDDFT-derived spectra of 11 derived at the PBE0/6-31+G(d,p) level of theory for a constrained, ground-state optimized where the vinyl malononitrile-thiophene group is rotated in 10⁰ increments from 0 – 180⁰. ... 274
Figure SI-7.24: Key representing the nomenclature used in the rotamer naming for Table S6. Different permutations of l, r, u, and d were considered (not all permutations are shown in the key). ... 275
Figure SI-7.25: Key representing the nomenclature used in the rotamer naming for Table S5. Different permutations of l, r, u, and d were considered (not all permutations are shown in the key). ... 276
Figure SI-7.26: Spin densities for the low-energy conformations explored in the BDE calculations at the PBE0/6-31+g(d,p) level of theory. ... 278
xxxi
LIST OF SCHEMES
Scheme 1.1: Stepwise nucleophilic substitution of cyanuric chloride. ... 24
Scheme 1.2: Trimerization of aryl/heteroaryl nitriles using triflic acid to generate 2,4,6-substituted 1,3,5-triazines.81 ... 24
Scheme 1.3: Proposed mechanism for the trimerization of nitriles to form low-symmetry triazines using triflic anhydride.86 ... 25
Scheme 1.4: (Top) Symmetric triazine derivatives generated by a three-fold Stille, Suzuki, Sonogashira or Negishi cross coupling reaction between metallated-heterocycle and cyanuric chloride using palladium catalysts. (Bottom) Step-wise Suzuki,87 Sonogashira88 or Negishi89 cross coupling reaction to generate triazines
with two or three different substituents. ... 26
Scheme 2.1: Synthesis of mesomorphic dyes DPP-LC and II-LC. ... 36
Scheme SI-2.1: Synthesis of Stille and Suzuki reagents. ... 53
Scheme 3.1: Synthesis of thiophenestannaness 2, 5, 9 and 11... 70
Scheme 4.1: Synthetic route for the preparation of compounds 3a-i. MW = microwave reaction. ... 115
Scheme 5.1: Synthetic pathway for 8-C8 through a threefold Knoevenagel condensation. ... 145
Scheme 5.2: Synthetic pathway for triazines 8 through a three-fold Stille cross coupling of the stannylated thiophenes alkyl cyano acrylates with cyanuric chloride. ... 146
Scheme SI-5.1: Synthetic pathway of route B for compounds 8. ... 164
Scheme SI-5.2: Synthetic pathway of route A for the preparation of compound 8-C8. ... 165
Scheme 6.1: Synthesis of low symmetry triazine derivatives and structures of symmetric triazines. a) pyrazole, K2CO3, THF, 70 °C, 18 h; b)
xxxii
Cs2CO3, Pd(OAc)2, dioxane/H2O, microwave: 140 °C, 40 m; d)
2-(tributylstannyl)furan, Pd[PPh3]4, toluene, 90 °C, 18 h; e) benzo[b]thien-2-ylboronic
acid, Na2CO3, Pd[PPh3]4, THF/H2O, 70 °C, 6h; f) carbazole, nBuLi, THF, -40 °C – r.t., 4
h. ... 202
Scheme 7.1: Synthesis of low-symmetry triazines 3, 4, 7 and 11. Reaction conditions: a) pyrazole, K2CO3, THF, 90 °C; b) tributyl(thiophen-2-yl)stannane, Pd[PPh3]4,
toluene, 90 °C; c) 1-(5-(tributylstannyl)thiophen-2-yl)pyrrolidine, Pd[PPh3]4,
toluene, 90 °C; d) (5-(1,3-dioxolan-2-yl)thiophen-2-yl)tributylstannane, Pd[PPh3]4,
toluene, 90 °C; e) pTsOH, THF/H2O; f) vinyl malononitrile, NaHCO3, EtOH, 0 °C – 24
xxxiii
LIST OF ABBREVIATIONS/SYMBOLS
Cr Crystalline
DCM Dichloromethane
DMF Dimethylformamide
DMSO Dimethylsulfoxide
DMSO-d6 Deuterated dimethylsulfoxide
DSC Differential Scanning Calorimetry
ESI-ToF Electrospray ionization – Time of flight
EtOAc Ethyl acetate
EtOH Ethanol
FML Fast-motion limit
HRMS High resolution mass spectrometry
I Isotropic liquid
ICT Intramolecular charge transfer
LC Liquid crystal
LCD Liquid crystal display
MeCN Acetonitrile
MeOH Methanol
MP Melting point
MW Microwave
OFET Organic field-effect transistor
OLED Organic light emitting diode
OPV Organic photovoltaic
POM Polarized optical microscopy
XRD X-ray diffraction
pXRD Powder X-Ray diffraction
SC Soft crystalline
SCXRD Single crystal X-ray diffraction
THF Tetrahydrofuran
xxxiv UV-Vis Ultraviolet-visible spectroscopy
1 References begin on page 27
CHAPTER 1:
Self-Assembly of Small Molecule Liquid Crystals
1.1 General Introduction
Inspired by its prominence and vital role in nature, molecular self-assembly has emerged as an attractive approach for the development of new functional materials with unique physical and chemical properties.1 Molecular self-assembly can be
described as an equilibrium process in which molecules spontaneously come together to form stable and well-defined supramolecular structures via enthalpic contributions arising from non-covalent interactions and entropic contributions from more motional fredom.2 Its ubiquity in nature stems from billions of years of
natural selection and evolution, which have led to the complexity that is life today.3
Figure 1.1: Schematic illustration of an ionic switch induced by a thermoreversible phase transition between a columnar rectangular and hexagonal phase. Reprinted (adapted) with permission from Ref 9. Copyright (2015) American Chemical Society.
2 References begin on page 27
bonds, π-π interactions, van der Waals forces and repulsive forces) and ultimately lead to hierarchical self-assembly.3,4 In addition to its structural predictability,
supramolecular chemists benefit from the reversibility and adaptive property of supramolecular materials. These weaker non-covalent interactions provide a dynamic aspect in which bonds can be reversibly destroyed and constructed, which then, opens up the possibility for materials with self-healing and recyclable features.5,6 Furthermore, due to their dynamic nature, supramolecular materials can
respond to external stimuli by adjusting their structure, allowing for the development of smart functional materials (Figure 1.1.).6–9 Hence, many
evolutionary features have popularized self-assembly and supramolecular chemistry.
1.2 Introduction to Liquid Crystals
Liquid crystals (LC) are an archetypal example of self-assembled materials that have found wide-spread applications in the modern world.10–12 Originally discovered
through the double melting of cholesterol benzoates by Friedrich Reinitzer in 1888, LCs now refer to a class of compounds that exhibits an intermediate phase (mesophase) of matter between that of a crystalline solid and an isotropic liquid.13
Consequently, these compounds possess both structural order and fluidity, which together, have fostered their on-going interest in material8,14–16 and biological17,18
science. Notably, LCs has come to dominate the display industry due to the ubiquity of liquid crystal displays (LCDs) in our everyday lives. This technology exploits the dynamic nature of LCs, controlling their supramolecular order through an external electric field, and ultimately allowing for light-modulation to give “on” (bright) or “off” (dark) states. Today, LCs are finding broader applicability as charge transporting materials14 (e.g. light emitting diodes, photovoltaic cells, field effect
transistors), biological interfaces,17 electrolyte materials,19 and separators.8
1.2.1 Classes of Liquid Crystals
3 References begin on page 27
crystallinity in the presence of a solvent and is concentration and temperature dependent. On the other hand, if molecules display liquid crystalline phases by solely varying the temperature, they are referred to as thermotropic LCs. Thermotropic LCs can be further subdivided into two subclasses depending on the molecular shape of their constituent molecules (Figure 1.2). The most common type is the calamitic LC, which consists of rod-shaped molecules whose molecular length is considerably longer than its breadth. Due to its cylindrical shape, this class of materials tends to form layered structures (smectic phases). Disk-shaped molecules, whose molecular length and breadth are nearly equal are referred to as discotic LCs, and these molecules preferentially stack and self-assemble into columnar structures.10 Despite their different classification, calamitic and discotic LCs have
the same chemical make-up in that they are both composed of an aromatic core with flexible alkyl side-chains attached to their periphery. However, the difference lies in the type of rigid core used (e.g. para-linked phenyl groups vs. disk-shaped aromatics) and the position of the side chains (e.g. terminal vs. radially substituted). The topic of this dissertation revolves around discotic LCs as the presence of strong π-stacking interactions and their columnar ordering lead to the formation of molecular wires that can function as organic semiconductors.14
Figure 1.2: Molecular structure and packing behavior of calamitic vs. discotic LCs.
1.3 Discotic Liquid Crystals
2-4 References begin on page 27
dimensional super-lattices through shape-anisotropy and microphase segregation between the rigid core and the flexible side-chains.10,16 The behavior of these
thermotropic molecules in the liquid crystalline phase can be described by a model where the aromatic core and flexible side-chains have different melting temperatures.20 Accordingly, when the crystalline material melts into the LC phase
on heating, the flexible side-chains melt and become conformationally disordered while the aromatic cores remain stacked. This persists until the clearing (phase transition from LC to isotropic liquid) temperature is reached where all long-range self-assembly is lost. Therefore, the crystalline character can be attributed to the interaction between aromatic cores, whereas the liquid character is driven by the conformational disordering (melting) of the flexible side chains.20
1.3.1 Design Features
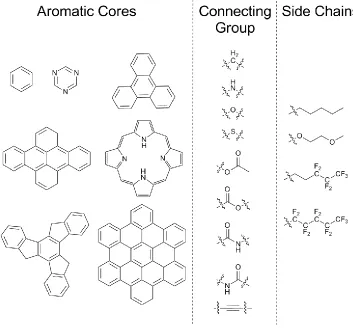
While the general design of discotic LCs is straightforward, there are many factors which dictate whether a molecule will be liquid crystalline or not, as not all disk-shaped molecules with peripheral chains display mesomorphism. However, most effort is required for the fine-tuning of liquid crystalline and electronic properties, which is essential for bringing these materials into the commercial world. The main design features which affect both the phase behavior and electronic properties include the type of aromatic core, the type and number of flexible side-chains, and the connecting group between the core and chains (Figure 1.3).
With well-over a thousand reported discotic LCs in literature, there is a wide array of aromatic cores that has been used, ranging from the smallest core derived from benzene to large polyaromatic hydrocarbons containing 132 atoms.11,21 Larger
cores typically give higher charge carrier mobilities due to increased π-stacking interaction, but often suffer from high melting (crystal to LC transition) temperatures and low solubility.22,23 The symmetry of the core must also be
accounted for as more symmetric structures often exhibit higher melting temperatures in comparison to isomeric molecules with lower symmetry (Carnelleys rule).24,25 Finally, the introduction of heteroatoms into the conjugated
5 References begin on page 27
molecule is a p-type (electron rich hole conductor), n-type (electron deficient electron conductor) or ambipolar (hole and electron conductor) semiconductor.14
The bridge between the rigid aromatic core and the fluid side-chains is referred to as the connecting/linking group and can play a large role in supramolecular organization. Generally, to increase phase stability (broaden LC temperature range) the linker should allow for coplanar conformations of the side-chains with the aromatic core in order to prevent the disruption of π-stacking interactions.14,26 The incorporation of polar groups (e.g. amide groups) can also help
stabilize columnar organization via directed hydrogen bonding interactions between neighboring molecules.27,28 The connecting group also influences the
electronic properties of the aromatic core due to its direct attachment. This can be used to further tune the HOMO and LUMO energy levels of discotic systems.12,14
Finally, the most tailorable component of a LC system is the side-chains (i.e. side-chain engineering) due to its wide variety and ease of attachment. It is often used to influence the molecules packing behavior and to tune melting and clearing temperatures. Longer chains typically decrease the transition temperatures in LC systems, although exceptions to this trend occur depending on the discotic structure (e.g. size of core in comparison to length of chain). Branched alkyl-chains increase steric demand, which typically disturbs the π-stacking interactions (intracolumnar ordering), leading to lower clearing temperatures and phase stability but increases solubility. Glycolic chains have been found to increase LC stability due to its greater flexibility compared to its hydrocarbon analogues.29 The use of perfluorinated and
partially-fluorinated side-chains is also beneficial to LC stability because of improved nanosegregation (fluorophobic effect). This has been shown to increase 1-D charge conduction due to reduced defects within the columns.30,31 Evidently, there
6 References begin on page 27
Figure 1.3: Examples of cores, connecting groups and side-chains used in discotic LCs.
1.3.2 Discotic Phases
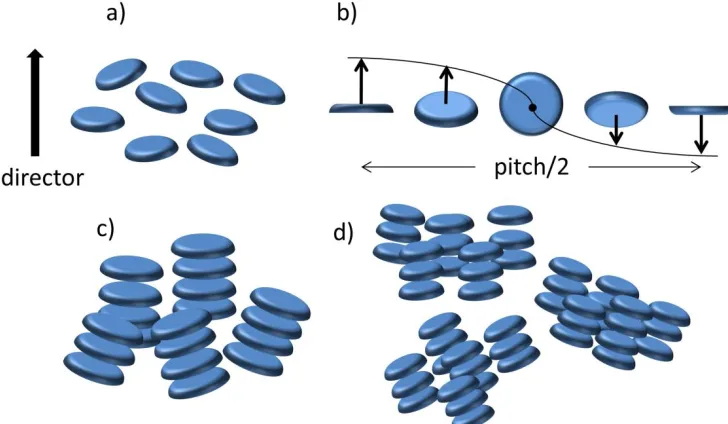
Disoctic LCs can adopt two general mesophase types: the nematic phase and the columnar phase. The discotic nematic phase (ND) possesses only orientational and
no long-range positional order, which makes it the least-ordered discotic LC phase (Figure 1.4). The preferred direction of a discotics orientation is known as the director, which is parallel to the short axis of the discotic molecule. In the discotic nematic phase, the molecules have full translational and rotational freedom around their short axis but on average, the director of the molecules are oriented parallel to one another.32 In comparison to the waxy columnar phase, the nematic phase is the
7 References begin on page 27
columnar nematic (NCol) and the nematic lateral phases (NL).12,32 The chiral nematic
phase, also known as the cholesteric phase, occurs when the molecules are chiral or a chiral dopant is added to give a helical nematic phase, where the director is continuously twisted along the z-axis (Figure 1.4b). The columnar nematic phase, typically observed in charge transfer species, is characterized by short stacks of columns that are ordered in a nematic arrangement (Figure 1.4c). Finally, in the nematic lateral phase, the discotic molecules form supramolecular aggregates that adopt a nematic arrangement (Figure 1.4d). Similar to the columnar nematic phase, this phase has only been observed in mixtures of donor and acceptor compounds and requires strong lateral interactions.12,32,33
Figure 1.4: Types of nematic phases: a) discotic nematic, b) chiral discotic nematic, c) discotic columnar nematic, d) discotic nematic lateral.
Columnar phases are obtained by the 2-D ordering of columns formed by stacked molecules. The various super-lattices adopted by these molecules are classified by their orientation along the stacking direction and the symmetry of the columns in a 2-D lattice (Figure 1.5). The most prominent columnar phase observed is the columnar hexagonal phase (Colh), where the molecules are non-tilted and the
8 References begin on page 27
columnar rectangular phase (Colr) contains several possible symmetry groups
where the columns formed by tilted discs arrange in a rectangular 2D-lattice leading to an ellipsoidal columnar cross-section. Similar to the rectangular phase, the columnar oblique phase (Colob) is formed by tilted columns that are arranged on a
tilted 2D-lattice. Columns formed by helically-stacked molecules render the columnar helical phase (Colh*). The columnar plastic phase (Colp) is similar to other
columnar phases with limited motional freedom. This phase has long-range 3-D crystal-like order, where the columns are ordered in a hexagonal lattice but the individual molecules can freely rotate along the columnar axis. Finally, in the columnar lamellar phase, the molecules stack to form columns that organize into layers. The columns within layers possess translational freedom, while there is no positional relation between columns in different layers.10,12
Figure 1.5: Types of columnar phases: d) columnar hexagonal, e) columnar rectangular, f) columnar oblique.
9 References begin on page 27
adopt an edge-on orientation with regard to the substrate surface. The homeotropic alignment is required for discotic LCs in photovoltaic and light emitting diode devices with sandwiched electrodes, while the planar alignment is needed for field-effect transistors where charge migration occurs between the source and drain electrodes on the same substrate.10,12
Figure 1.6: Homeotropic and planar alignment of discotic LCs.
1.4 Characterization Methods of Liquid Crystals
Thermotropic LCs are generally studied using polarized optical microscopy (POM), differential scanning calorimetry (DSC), and powder X-ray diffraction (pXRD). The combination of these three techniques allows us to better understand the bulk properties of the discotic mesogens including phase transition temperatures and enthalpies, structural packing information, and type of phase.
1.4.1 Polarized Optical Microscopy
One of the most essential techniques used to evaluate the liquid crystalline character of discotic LCs is POM. In general, POM can be used to observe transition temperatures, fluidity, and defect textures which are characteristic of specific LC
phases (Figure 1.7).10 POM experiments rely on the optical
10 References begin on page 27
index of refraction perpendicular to it. In this case, incident light parallel to the optic axis of a discotic LC is not refracted and can be considered optically isotropic. In a POM experiment a sample sandwiched between two glass slides is loaded onto a microscope stage that is equipped with a variable temperature stage. A light source transmits polarized light through the sample, where it refracts and reaches a detector that is cross polarized (i.e. polarization of light source is orthogonal to the detector). Therefore, isotropic materials do not refract the incident light, causing a dark image to be observed. Anisotropic materials refract the incident light depending on the molecular orientation. The structural flaws within a LC generate a defect texture that is characteristic to the type of LC phase obtained.34 What
differentiates LCs from other anisotropic materials (e.g. crystalline solids), other than their texture, is their fluidity. Liquid crystals with low viscosity flow upon melting from the crystalline phase, resulting in the appearance of a birefringent fluid. In addition, pressing on the glass causes a change in the texture, whereas in crystalline solids, either no change is observed or cracks with defined edges form.
Figure 1.7: POM image (crossed polarizers) showing gradual crystal growth into nematic LC phase.
1.4.2 Differential Scanning Calorimetry
DSC is a complementary technique to POM used to evaluate phase transition temperatures and enthalpies of mesomorphic materials. By itself, DSC does not provide any concrete evidence of LC character but the magnitude of the enthalpy change does provide information on the relative change of the degree of ordering at the phase transition between two phases.10 A power-compensating DSC operates by
11 References begin on page 27
of temperature. Its magnitude depends on the difference in heat capacity and contributions from thermal transitions. As the sample is heated and undergoes a phase transition, more or less power is required to ensure the temperatures of the sample and reference remain the same. The amount of power required is dependent on whether the transition is exothermic or endothermic. Exothermic transitions (e.g. isotropic liquid to LC phase or LC phase to crystal phase) result in the release of heat by the sample, and thus, require less power from the DSC instrument to maintain its temperature linearity with the reference. In contrast, endothermic transitions (e.g. crystal to LC phase or LC phase to isotropic liquid) result in the absorption of heat by the sample, and thus, require more power from the instrument to maintain the same temperature as the reference.35,36 The resulting
graph of heat flux versus temperature provides information regarding the amount of heat absorbed or released by the sample throughout the heating and cooling process. The peak position corresponds to the phase transition temperatures and the area under the curve corresponds to the enthalpy of transition. A general DSC curve for a discotic LC displaying one mesophase will contain two peaks corresponding to the crystal to LC transition and the LC to the isotropic liquid transition on heating (Figure 1.8).
12 References begin on page 27
1.4.3 Powder X-Ray Diffraction
Powder X-Ray diffraction (pXRD) is a powerful technique used to probe how molecules pack in the crystalline or liquid crystalline state. X-rays are used due to their wavelength being on the same scale as the spacing between atoms. When a sample is hit with monochromatic X-rays, secondary diffracted X-ray beams are generated which relate to the interplanar spacing of the ordered substance when there is constructive interference. This occurs when Bragg’s Law (Equation 1) is met where n is an integer (order of reflection), λ is the X-ray wavelength, d is the interplanar spacing generating the diffraction, and θ is the diffraction angle.37
Equation 1: 𝑛λ = 2d sin θ
The diffracted beam then hits a 2-D detector, creating a bright spot at a specific angle. Since the powder sample has a statistically infinite amount of randomly oriented microcrystals, a ring of bright spots is generated instead of a single point. The angle between the beam and the ring is 2θ, which can then be converted to the spacing between planes using Bragg’s Law.37 The 2-D pattern can then be converted
to a 1-D diffraction pattern where the intensity is plotted against 2θ. The position and intensity of the peaks provide the structural information relating to the packing of molecules in the bulk material. Diffractograms of LCs are typically split into two different angle regions: the small-angle (0<2θ<15°) and wide-angle regions (2θ>15°). The small-angle region describes the lateral packing (intercolumnar distances) of the molecules, while the wide-angle region contains information about the packing of the side chains and π-stacked cores. Determination of the type of LC phase is performed by indexing the peaks, which have relative ratios typical of a specific phase due to its 2-D lattice geometry. A typical diffractogram of the LC phase shows one, two or three sharp peaks in the small-angle region, correlating to the lateral packing in a Colh, Colr and Colob phase respectively. The wide-angle region
typically contains two broad peaks of weaker intensity, corresponding to the packing of amorphous side-chains and the π-stacking interaction between cores.38
13 References begin on page 27
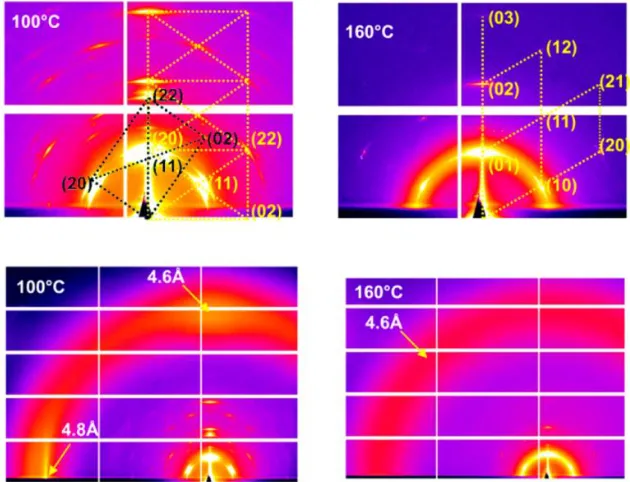
relative orientation of diffracted peaks (Figure 1.9); however, obtaining aligned samples is not always straightforward.
Figure 1.9: Small and wide angle 2-D diffractogram of trimethyl-benzenammonium cation in the columnar rectangular phase at 100 °C (left) and columnar hexagonal phase at 160 °C (right). Reprinted (adapted) with permission from Ref 9. Copyright (2015) American Chemical Society.
1.5 Discotic Liquid Crystals as Organic Semiconductors
Interest in discotic LCs over the last two decades has been primarily driven by their ability to transport charge carriers along the columns.12,14,39,40 This coincides with
the interest in crystalline and amorphous π-conjugated organic small molecules, oligomers, and polymers, as scientists continue the search for new semiconducting materials that rival its well-established inorganic counter-parts based on silicon.41
The advantages of organic semiconductors over inorganic viersions include their solution processability, high flexibility, and potentially lower cost. While charge carrier mobilities exceeding 1 cm2 V-1 s-1 have been achieved in single crystals of
aromatic molecules, controlling their crystal growth and alignment on solid substrates remains a significant challenge.39,42,43 On the other hand, amorphous
14 References begin on page 27
and device flexibility, but come at the cost of low charge carrier mobilities (e.g. 10-7
– 10-3 cm2 V-1 s-1).44 Liquid crystalline organic semiconductors are envisioned as a
possible solution to overcoming the drawbacks associated with crystalline and amorphous materials, as they exhibit characteristics that are unique to both. The crystal-like packing of aromatic cores in well-ordered LC phases allows for high charge carrier mobility, whereas the presence of flexible side-chains and their thermal disorder make them more soluble, easier to align, flexible and soft.39 In
addition, their dynamic nature adds the possibility for self-healing features and smart responsive functionality through the control of external stimuli.8 Charge
carrier mobilities of discotic liquid crystals have reached as high as 0.38 cm2 V-1 s-1
in discotic LCs based on hexabenzocoronene,45 whereas typical values for most
discotic systems are in the range of 10-3 - 10-1 cm2 V-1 s-1.12 There are also some rare
examples of charge transport in high ordered smectic phases of calamatic systems; however, their mobilities are typically lower compared to discotic systems and they are crystalline at room temperature.46 Still, Iino et al. have shown that high charge
carrier mobilities, up to 13.9 cm2 V-1 s-1, can be obtained from very uniform
polycrystalline films of 2-decyl-7-phenyl-benzothienobenzothiophene formed by thermally annealing at the SmE phase temperature.47 This shows that crystalline or
glassy phases of LCs can also be used to achieve high mobilities.
1.5.1 Mechanism of Charge Transport
In their pure form, discotic LCs are insulators but can be made conductive through charge injection, chemical doping, or photo-irradiation. The overlap of π-orbitals in a discotic liquid crystalline phase allows for migration of charge carriers along the stacking axis. This transport process can be described by a phonon-assisted hopping approach, where charge carriers are localized on singly-charged molecules and jump from core to core along the columnar stack. The frequency of charge hopping (kET) between two molecules is estimated through semi-classical Marcus theory
(Equation 2), where T is the temperature, λ is the reorganization energy, t is the transfer integral and h and kB are the Planck and Boltzmann constants
15 References begin on page 27
Equation 2: ket = (4π2/h)t2(4πλkBT)-0.5e^(-λ/4kBT)
This equation demonstrates that charge transport is mainly affected by the reorganization energy and the intermolecular charge transfer integral. The reorganization energy (λ) relates to the geometric fluctuations of adjacent molecules and their surroundings when going from the neutral to the charged state. The charge transfer integral refers to the strength of the electronic interaction (effective overlap and degree of symmetry between the frontier orbitals) between two cores.11,49,50 High charge carrier mobilities are obtained when the
reorganization energy is minimized and charge transfer integral is maximized.
1.5.2 Tuning Charge Transfer Integrals and Reorganization Energies
The understanding of the structure-property relationships that lead to efficient charge transport is vital to developing new materials for organic semiconductors. Consequently, several groups have used cofacial dimers between two aromatic cores to study the molecular and structural factors that influence charge transfer integrals and reorganization energies.
Intuitively speaking, the charge transfer integral should depend on the relative positions of the interacting molecules, as these positions likely define the degree of interaction between their molecular orbitals.48,49,51 Moreover, a
representative description of charge transfer integrals in columnar mesophases of discotic LCs must also include the dynamic properties of these materials. It is known from NMR and dielectric studies that molecular dynamics change depending on the order and fluidity of the columnar mesophase and may range from fast flipping of the discotic molecules within a columnar stack to restricted rotation about the stacking axis. However, all columnar mesophases of DLCs seem to exhibit a rotational motion about the stacking axis, a slipping motion of molecules lateral to the stacking direction, and density undulations along the columnar stacks (i.e. temporary change in stacking distance).52 The influence of these motions on the