THE STUDY OF FULL CONE SPRAY USING INTERFEROMETRIC
PARTICLE IMAGING METHOD
Darina JAŠÍKOVÁx, Michal KOTEK, Tadeáš LENC, Václav KOPECKÝ
Abstract:The spray analysis is a fundamental for many industrial applications. The knowledge of spray distribution, the spray geometry and structures is crucial. Recommended here is the method of simultaneously measuring the droplet size, spray geometry and impact droplet velocity. Referred here is the Interferometry particle sizing technique applied on a full cone nozzle with external feeding. The spray was examined in three stages: close to the nozzle exit, in 0.7m and 1.7m distance far from the nozzle exit and under pressure 1.3, 2.7 and 3.5 bar.
1. I
NTRODUCTIONTheatomization of liquids found its place in many industrial applications such as dye landing, lubrication, coating, injection, moisturizing, humidification, cooling, gas conditioning, and dust control.
Each application has its own specifications on working liquid, accurate flow rate, constant pressure and spray pattern. These conditions impose appropriate requirements on the spraying nozzle. Before the spray nozzle can be used in particular industrial application, as a part of complex system, it needs to be analysed and tested for its spray characteristics.
The inner construction of spraying nozzle has significant influence on the spray geometry. Here we used the vane less full cone nozzle. This geometry leads to narrow spray angle and fine droplet distribution. In this configuration the liquid enters the inner chamber and it is forced through an offset orifice into a swirl chamber. As the liquid leaves the orifice, the droplets follow a trajectory influenced by the orifice shape. The droplet size and spray distribution are predictable and not dependant on the laminar flow. [1], [2]
The atomization is very complex system that includes various steps from primary breakup to secondary one via Kelvin-Helmholtz or Rayleigh-Taylor mechanisms. The degree of droplets atomization depends on their Weber number. This approach is common and general assumption of droplet breakup in every model. The breakup of liquid jets is a subject of fundamental importance in the optimization and industrial spray processescontrol. It can be said that the experimental study is of the same value as the theoretical and numerical simulation. Therefore experimental study is necessary to verify and improve the theoretical model and to determine boundary and initial conditions. [3]
xDarina Jašíková,Faculty of Mechatronics, Informatics and Interdisciplinary Studies, Technical
University of Liberec, Studentska 2, 46017 Liberec, Czech Republic, [email protected]
In recent years many measuring and reporting methods that evaluate a nozzle capacity, spraying pressure, spray angle, and drop size distributionhave been developed.Basically, we differentiate two types of measurements: spatial and flux technique.The spatial technique gives information of droplets in a sampled volume. This type of measurement is sensitive to the number of density in each class size and the number of particles per unit volume. The flux technique analyses individual droplets that pass through the cross-section of a sampling region. These types of measurements are usually based on optical principles that are capable of sensing individual droplets. The most of the optical measurement methods enables to analyse the droplet size distribution, velocity profile, as well as other spray characteristics.
The sprays are usually tested on drop size distribution, spray impact, spray pattern, spray coverage, spray angle, evaporation rate and dwell time.
This article describes the potential of non-invasive and nonintrusive optical based measurement technique for characterization and analysing pressured air sprays. The Interferometry particle imaging method (IPI)enables to measure spray characteristics, droplets velocities and size distribution at once. This method belongs to the type of flux techniques and in association with Particle image velocimetry (PIV) describes the size distribution and velocity flow field.
The second purpose of this article is to evaluate spraying characteristics of this specific kind of spraying nozzle in a time test.
2. E
XPERIMENTAL SETUPAtomization setup
The analysed nozzle system that we used here enables huge range of modification for the purpose of exact industrial application. The nozzle attributes can be influenced by the nozzle diameter, shape, design,pressure adjustment, working liquid characteristics or the inner chamber construction and the external add-ons. The basic adjustment has potential for application, where the droplets of relatively small size are required and the drop impact velocity is small.
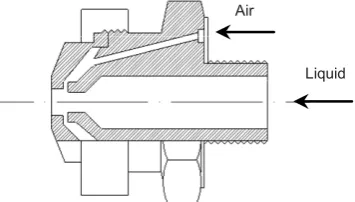
Here we use the full cone spray nozzle. This kind of nozzle produces full cone sprays round pattern that is completely filled with spray drops. The spray is formed by thevane less chamber, which imparts the liquid to the orifice due the controlled turbulence. The turbulence is induced by inner structures and proportions of the chamber. The inner geometry of mixing chamber is shown in figure 1. The spray pattern is taken in the working distance of the atomization process. The working distance depends on the applied pressure or liquid feed rate. In this study we used the external mix, so the liquid
Figure 1: Simplified sketch of the spraying nozzle
Air
is aspirated due the gravity force or the ejector effect to the nozzle. According to fig. 2 the spatial distribution of spray pattern is homogeneous and well sharped.
The full cone spray nozzle consists of 1/8J stainless steel nozzle body and round spray air cap for external mix to produce full cone found spray pattern. This type of nozzle works with maximum air pressure 4bar, feed rate 0.68l/hour and maximum spraying distance 1.8m.
The spray nozzle was joined into the system as an external mix configuration. The external mix system supplied the liquid into the nozzle by liquid siphon. This setup is designed to draw the liquid from a container through the feed line into the air flow, where it is atomized. The second exit of the nozzle was fed by compressed air. The pressure of the incoming air was measured by digital barometer Almemo and controlled by the reduction valve.
Measurement setup
Here we use the Interferometry particle imaging method (IPI). This method is based on the interference of the reflection and refraction of glare points. The technique utilizes the interferometry pattern created from a particle illuminated by a laser sheet. The particles must be transparent, homogeneous and spherical. All these procedural conditions are fulfilled by sprays.
Figure 2: Full cone spray pattern [4]
Figure 3: The experimental setup for external mix atomization
Nozzle
Barometer
Air regulator
The IPI method employs two cameras alignment. This alignment consists of one focused and one defocused camera. The first camera acquires focused images, which are used for particle detection and for velocity measurements. The second camera records defocused images, which are used for size measurements and for validation. By knowing reflection and first-order refraction of the particles this method provides measurements of the particle diameter. Once the particle is out of focus, the interference fringes appear, arising from the two scattered rays. The shape of the defocused image of each glare point depends only on the shape of the aperture, whereas the size of the defocused images depends on the degree of defocusing. As the degree of defocus increases and the spatial resolution of the optical system decreases, the two points merge into one single image with interference fringes. Large particles exhibit more fringes in the defocused image than small particles. The particle size limits of the IPI technique are fixed by the aperture size and the working distance of the camera.
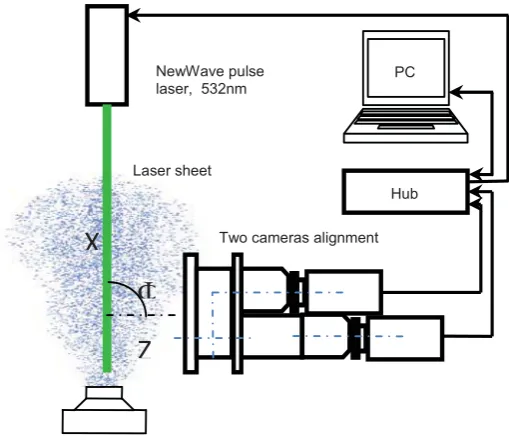
The IPI measurement system consists of NewWave Gemini Nd:YAG pulsed laser of energy in each pulse 120mJ. The duration of one pulse was 10ns. The light sheet used in this study was 3mm thick. The image records were captured by two CCD cameras of the spatial resolution 1280x1024px. The cameras were aligned to observe the same area in the same optical axis, for this arrangement we used special IPI lens fitting adapter. Each camera was fitted with the lens of focal length 60mm; the one for focused image and one for de-focused. The cameras setting was placed under angle I = 90 ° in the distance 670mm of the camera lens to the laser sheet. The aperture diameter was 15mm. The datasets of double images was recorded by IPI system of focused and defocused images were taken. The focused images were cross correlated and validated using the set of validation methods. Defocused images were analysed by Interferometric calculating algorithm. The validation of defocused images is dependent on the saturation density of particles, distance between particles and level of background noise. The optical setup
Figure 4: The measurement setup using IPI technique
NewWave pulse laser, 532nm
PC
Hub
Two cameras alignment Laser sheet
)
X
enables to measure particles in the range from 20 up to 280 micrometres. The figure 4 shows the IPI measurement configuration, synchronization between cameras and laser that is provided by the synchronization hub unit. Here it is also seen the angle I between camera alignment and laser sheet that is dependent on the drop reflection index.
3. R
ESULTSThe effect on the spray geometry have several liquid properties: viscosity, surface tension and density. The surface tension and viscosity represent the forces acting at the interface between two fluids (water, air). During the atomization the break up of continuous liquid body into many small one increase the surface area over the whole liquid, thus the potential energy increases. The potential energy of the system is supplied by shear force acting on the liquid flow. The liquid flow is expressed as a pressure driven liquid flow through a orifice.
In this section is presented a visualization of spray geometry investigated in three areas. The first area was close to the nozzle exit, the second in the distance 0.7m far from the nozzle exit and the third one in 1.7m.In all investigated areas the spray was analysed on the drop size distribution. The applied air pressure was chosen according to the optimal nozzle range.
The spray nozzle was investigated in the pressure air range from 0.7 to 5.0bar. For industrial application the pressure 1.3, 2.7 and 3.5bar is most interesting so the results we bring here were taken, measured and evaluated by these pressures.
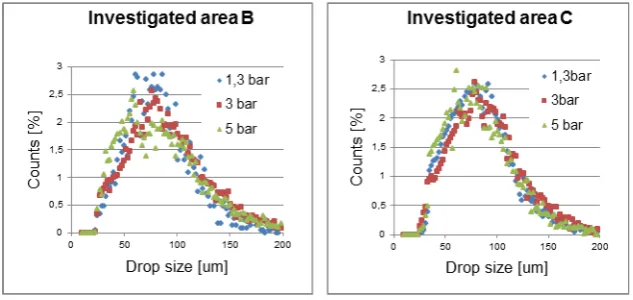
With higher applied pressure, the stream of droplets starts to be oversaturated and the IPI measurements is disabled. This problem was partly solved by changes in optical setup, decreasing of aperture diameter, so we could partly observe the disintegration of particles in this area. The average size of the liquid blobs was in order of submillimeters. The size distribution in areas B, C was investigated in detail. Here the particles are well separated and their velocities rapidly decreased so the secondary atomization is stopped. As we can see in figure 6 the size distribution between area B and C is in range of 10microns. The raising pressure influences significantly the particle counts, not size distribution. The diameter mean value of all pressure modes was around the 70micrometers.
Figure 5: The investigated areas A, B, C of the spray plume
With increasing pressure there were only very small changes in the spray angle. That is achieved by the optimal shape of nozzle’s orifice. As it is seen on visualizations in figure 7, the divergence of main droplet stream is in the limit of 17 degrees. If the stream starts to shift its parameters it is the sign of the nozzle damage or malfunction.
With higher pressure the instabilities in the stream occur. The instabilities are caused by local vorticities in the flow. The PIV method was used to determine the flow field of the carrying air and recognize the turbulences. Some of them are visible on the visualisation in figure 7. The air flow field has the typical shape of submerged jet. About 30mm above the nozzle exit the stream of the liquid disrupt into the filaments. Upper from this area continues the secondary part of liquid bodies’ disintegration into the larger and smaller droplets. Larger bodies are carried close to the central line of the main air stream, where the velocities are higher and the local depression effects.
Figure 8 shows the calculated scalar maps of droplets motion velocity for applied pressure 1.3, 2.7 and 3.5bar. It is significant velocity rise. The maximum velocity of the spray was 75m/s under pressure 3.5bar. In industrial process the common pressure is set on 2.5bar. The velocity of droplets in this regime and area reach the value of 30m/s. (Fig. 8)
Figure 6: The spray size distributions to the air pressure
The results are influenced by the measurement error just above the nozzle orifice. The droplets in this region are joined into one massive bulk of liquid and the motion of this jet cannot be recorded and analysed with PIV procedures. In the distance 15mm above the nozzle exit the jet disrupts and separated liquid blobs are measurable. These initial blobs have 1mm in diameter. According to this diameter, the dynamics of the blob is considerable and the velocity doesn’t correspond to the velocity of air flow.
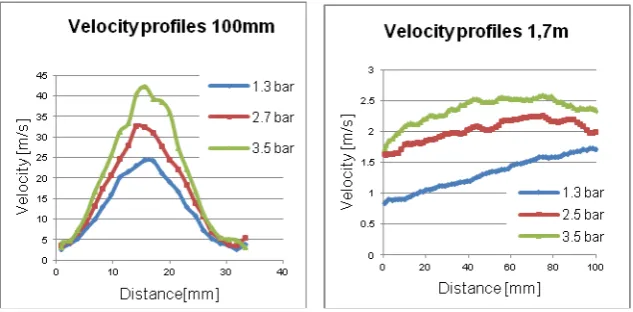
The recorded flow field was evaluated and compared on velocity profiles in 0.1m and 1.7m distance from the nozzle exit. These distances conform to the selected investigated areas A and C (Fig. 5). The highest velocities can be measured close to the nozzle in core of the central stream. During the atomization process the droplets lose their kinetic energy on disintegration, friction force and the part of the energy converts to potential energy according to Navier-Stokes equation.
The curve of velocity profile plot corresponds to the spray visualization in figure 7 and confirms the stable shape of atomizing process under various pressures. The width of the velocity profile declares the spray angle 17degree. Next spray characteristic is droplet an impact velocities at the end of spray plume. The end of the spray plume for the full cone nozzle is in the distance (1.7 ± 0.2) m from the nozzle exits, depending on applied pressure. The nozzle is designed that in the target area C the velocity is rapidly decreased for enabling soft droplet impact. The stream in this area is sensitive to the any disturbances. The experiment was provided in open space and under working condition, so the droplet motion was affected by the external draught, as it is mainly seen on the profile deformation in figure 9.
Figure 9:The velocity profiles in the distance 0.1m and 1.7m from the nozzle exit
4. C
ONCLUSIONIn this article was described and evaluated full cone spray nozzle. This nozzle has a potential for special industrial application thanks to its variability of inner swirl chamber setup, orifice size and connection into the system. It was confirmed and clarified the stable spray angle for various pressures. Droplet size distribution in three investigated area of the spray plume was measured and interpreted. The spray was also characterized by velocity flow field in investigated areas. The behaviour of droplets was explained.
According to the measured characteristics, this kind of nozzle can be used in system with external mixing, where the small droplet impact velocity is required.
A
CKNOWLEDGMENTThe project was realized under support of PTSE 1M06059. This work was partly supported by the Student grant scheme at the TUL.
5. R
EFERENCES[1] Vidusek D., A.: Full cone spray nozzle with external air atomization, 5.072.883 United States Patent, 17. Dec 1991.
[2] Lyons O., F., P., Persoons T., Murray D., B.: Particles sizing and flow measurements in an atomizing mist jet nozzle: A shadowgraphy approach, Brno, 2010. ILASS – Europe 2010, 23rd Annual Conference on Liquid Atomization and Spray Systems, Brno, Czech Republic, September 2010.
[3] Kohnen B. T., Musemic E., Straßburger F., Küpper B., Walzel P.: Measurement of the droplet size distribution of a full cone nozzle,ILASS – Europe 2010, 23rd Annual Conference on Liquid Atomization and Spray Systems, Brno, Czech Republic, September 2010.
![Figure 2: Full cone spray pattern [4]](https://thumb-us.123doks.com/thumbv2/123dok_us/8083177.1348814/3.595.171.426.527.702/figure-full-cone-spray-pattern.webp)