Comparative performance analysis of machine
learning models for breast cancer diagnosis
Ghufran Ullah1, HaiYan2
1School of information management (computer science), north China University of water resources and electric power, Henan, China 2School of information engineering, North China University of water resources and electric power, Henan, China
DOI: 10.29322/IJSRP.10.01.2020.p9742
http://dx.doi.org/10.29322/IJSRP.10.01.2020.p9742
Abstract- Breast cancer tumor is one the tumor discussed,
researched and thought over by many recent time philosopher for it malignant and benign nature through manual and natural language methods. Due to the severity of tumor and increasing rate medical science has accepted this challenge and tried to diagnose it on early stage. Manual methods are not giving the results for mammographic images and statistical reviews for treatment. This study tends to evaluate the performance of seven machine learning classification models such as: Artificial Neural Network (NN), Bayes Network (BN), k-Nearest Neighbors Algorithm (KNN), Decision Tree (DT), Random Forest (RF), Logistic Regression (LR) and Support Vector Machine (SVM) are used to diagnose breast cancer symptoms. The accuracy for the prediction of breast cancer has remained the disputed research area. Many authors previously have worked and found the flaws in natural language, and learning models of classification for breast cancer. Study debates on the accuracy and efficiency of machine learning models by comparing all seven methods using AUC values, K-Fold Cross Validation and F-measure metric. Study used F measure values, cross validation values and AUC (ROC) values for interpreting the results of performance measurement of all seven classification methods, results acquired suggested that all seven methods are better and efficient as compare to the manual methods of diagnosing the breast cancer and Random Forest as the highly recommended and most appropriate methods to yield the perfect results in AUC and Cross validation values for the diagnosing the Datasets of BCCD and WBCD acquired from the papers and used in many modules for analysis.
Index Terms- Breast Cancer, Classification Methods, Accuracy
and Efficiency, Performance measurement
I. INTRODUCTION
reast cancer in women is one of the deadly types of diseases worldwide/globally. For the prediction of survival indicators various researches have been showed that most of the evaluations were mainly performed using basic statistical techniques. According to world health organization in 2018, it is assessed that 627,000 women died from breast cancer that is approximately 15% of all cancer deaths among women [1]. Therefore it requires more scientific methods for diagnosing. Machine learning method; recently have taken part in medical treatment and predictions for the symptoms of cancers and other maleficent diseases. Breast cancer can be categorized Malignant and Benign. This study tends
to calculate the performance of seven machine learning classification models such as: Artificial Neural Network, Bayes Network, k-Nearest Neighbors Algorithm, Decision Tree, Random Forest, Logistic Regression and Support Vector Machine are used to diagnose breast cancer symptoms. The accuracy for the prediction of breast cancer has remained the disputed research area. Many authors previously have worked and found the flaws in natural language and learning models of classification for breast cancer. Study debates on the accuracy and efficiency of machine learning models by comparing all seven methods using AUC values, K-Fold Cross Validation and F-measure metric.
In this study we used two datasets related to breast cancer; Wisconsin Breast Cancer Database (WBCD) and Breast Cancer Coimbra Dataset (BCCD) and WEKA is used for all the simulation and experiments to illustrate the results. This study compares the result and interprets that performance evaluation of seven methods which resulted in Random Forest as the highest ranked method for diagnosing the breast cancer patient as compare to other six methods.
The rest of the content of this paper is organized in following order. In section 2, we discussed related work about machine learning and breast cancer. We discussed research methodology in section 3 and in section 4 we discussed about data analysis and interpretation. In the last section we conclude this paper and present possible future work.
II. LITERATURE REVIEW
Globally, the second most cause of deaths is Breast cancer. In 2018, the most usual occurring distortions were in women’s (almost 22.9% of female cancers). Within them, more than 2 million cases were diagnosed newly. In Western Europe and North America, this disease is common but it’s also increasing in developing countries. The main causes are life expectancy, urbanization, and the implementation of western lifestyles. (Paola De Cicco, 2019) [2] Said five-year survival rate has improved from 63% in 1960 to 90% at present according to the American Cancer Society. Classification plays an important role in data mining and machine learning. Numerous researches have been conducted on the datasets related to breast cancer using data mining techniques and machine learning methods. For nearly 20 years, artificial neural networks and decision trees have been used in cancer discovery and diagnosis. (Cicchetti, 1992)[3]. Machine learning techniques have been used in many applications ranging from identifying and categorizing tumors through CRT images
and X-ray (Liotta, 2007) [4]. More than 1500 papers are published on the subject of machine learning and cancer as stated by latest PubMed statistics. But, many of these papers are related with machine learning methods to classify, to categorize, to detect and to distinguish tumors and other distortions. We can conclude that machine learning is primarily used as assistance for cancer diagnosis and detection (McCarthy, 2004) [5].
The growth of a cancer tumor is linked with its temperature. Many masses are benign that implies the irregular development restricts to a limited, single and growing mass of cells (Gokhale, 2009)[6]. Early stages breast cancer is commonly detect by Mammography. Mammograms are for the most part examined by radiologists to differentiate the early stage of cancer (Domínguez, 2009) [7]. In literature, for breast tumor conclusion in tissue level, multiple commitments were made concerning about the use of example pattern recognition techniques. A model is proposed by tumor (al-shamlan, 2010)[8] and his group for the extraction of feature values to examine the breast cancer mammogram images for the classification of breast. (Yixuan Li, 2018)[9] applied 5 methods to evaluate the performance of SVM, DT, ANN, RF and LR and resulted in identifying that Random Forest provides befitting results in predicting the cased of tumor patients in breast cancer. This study tends to evaluate the performance of seven Machine-learning classification models and diagnose breast cancer symptoms with the comparison of accuracy values of all
methods with RF. (kiyan, 2004)[10] Explain that breast cancer diagnosis can be performed effectively by using statistical neural networks. (Lertworaprachaya, 2014) [11] A new model is proposed for composing decision trees by the use of interval-valued fuzzy membership values.
III. RESEARCH METHODOLOGY
The chapter presents the research design and Datasets used in statistical treatment and performance evaluation of breast cancer patient. It also depicts the data analysis techniques, the data analysis procedure and statistical treatment of data to achieve the objective of the study.
1.1 Description of datasets:
This study uses 2 datasets relevant to Breast Cancer; Breast Cancer Coimbra Dataset (BCCD) and Wisconsin Breast Cancer Database (WBCD). Attributes of both the datasets are different but relevant to the breast cancer patient. First dataset is comprises of 117 entries identity is given as the age of the patient ranging from 34 to 89, frequency distribution is used to understand the classes as per the age group of the subject used in the dataset. Second dataset is comprised of 570 entries given a separate ID for each subject in the dataset. Both datasets are coded according to get the utmost result at similar frequency distribution classes.
Table.1 Characteristics of dataset1
Table.2 characteristics of dataset2
S/No. Characteristics Code Remarks
1 Age A
2 BMI B
3 Glucose G 4 Insulin I
5 Homa H
6 Leptin L 7 Adiponectin AD
8 MCP M
S/No. Characteristics Code Remarks
1.2 Modeling method
Study intends to imply seven machine learning methods which respectively are NN, BN, KNN, DT, RF, LR and SVM. The aim of the study is to select a suitable primary model with maximum prediction accuracy.
For the selection of primary model we combined both the index of F measure metric and accuracy. We used random forest
as a classification model for the prediction of breast cancer either benign or malignant. Ratio of both the datasets are distributed in subsets such 70% to 30%. Study implies 70 percentages as training set and 30 percentages as testing data. Firstly we trained classification model by applying training data and secondly we applied test data on a trained model. Later on we compared the results of prediction accuracy of RF with other models.
Figure.1 proposed model
2. EXPERIMENTS AND INTERPRETATIONS
In this section we will elaborate the comparative analysis on experimental results of seven machine learning models. Dataset BCCD classification has malignant weight of 64 counts and benign weight of 52 counts in total they are 116 count distributed in different classes and sets. It is intended to apply all seven machine learning methods to examine the database.
For the selection of primary model we combined both the index of F-measure metric and accuracy. Accuracy depends on the measurements of classifier and it’s calculated by average of true positive items and false positive items and F-measure matric is measured by harmonic average of recall and precision.
Accuracy can be calculated by percentage of correctly classified occurrences (TP + TN) / (TP + TN + FP + FN), Whereas TN , FN, TP and FP represents true negatives, false negatives, true positives and false positives respectively. F-measure metric can be calculated by harmonic mean of the precision and recall.
A model consider to be more efficient if the value of F-measure will be high, where 0 represents as worst while 1 represent as high efficiency of model. Table3 and table4 shows the accuracy values and F-measure metric values of seven machine learning methods on BCCD, WBCD data. Figure 2 and figure 3 shows the comparison of all seven classification methods by accuracy and F-measure metric on WCCD and WBCD datasets. Machine Learning Models
Artificial Neural Network,
Bayes Network,
k-Nearest Neighbors Algorithm,
Decision Tree,
Random Forest,
Logistic Regression
Support Vector Machine DATA SETS
Breast Cancer Coimbra Dataset (BCCD)
Wisconsin Breast Cancer Database (WBCD) INPUT
Assessment of the methods used in Machine Learning
Models
Data inputs WEKA
K-Fold Cross Validation, F-measure metric, and
AUC Values
Application of Statistical tools
PROCESS
Comparative analysis of Machine Learning Models
Classification mode NN BN KNN DT RF LR SVM
Accuracy 0.600 0.525 0.587 0.686 0.743 0.657 0.714 F-Measure Metric 0.570 0.512 0.556 0.717 0.780 0.616 0.762
Table.3 BCCD Accuracy and F-measure Metric values
Classification mode NN BN KNN DT RF LR SVM
Accuracy 0.956 0.435 0.712 0.961 0.961 0.937 0.951 F-Measure Metric 0.945 0.573 0.594 0.941 0.955 0.938 0.934
Table.4 WBCD Accuracy and F-measure Metric values
Figure.2 accuracy and F-measure metric of seven classification models for BCCD data
Figure.3 Accuracy and F-measure metric of seven classification models for WBCD data
0 0.1 0.2 0.3 0.4 0.5 0.6 0.7 0.8
NN BN KNN DT RF LR SVM
Accuracy
F-measure
0 0.1 0.2 0.3 0.4 0.5 0.6 0.7 0.8 0.9 1
NN BN KNN DT RF LR SVM
Accuracy
Figure 3exhibits the values occurred in table 4 for WBCD data analysis of seven methods of machine learning algorithm which implies that Random forest is the fittest way of predicting the diagnosis patients amongst the seven algorithms although accuracy of Decision Tree algorithm is almost the same in accuracy measurement but for F-measure metric random forest is more efficient therefore overall it is concluded that Random Forest RF is better than other 6 methods NN, BN, KNN, DT, LR and SVM and efficient Natural Artificial Language that can Diagnose the cancer patient of category Malignant and Benign.
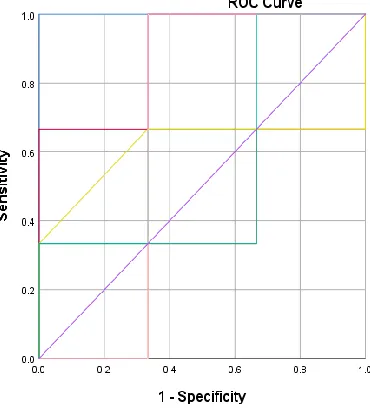
The verification of the performance of ensemble is done by performing predictions on random division of training and test data fifty times. When the first process is completed then ROC curve of every classification is placed in one graph to conclude the results instinctively. Both data’s ROC curve is given in Figure4 and Figure 5. In the ROC curve specificity is taken on x-axis and sensitivity is taken on y-axis. If we check the area under the ROC curve then it’s showing the probability in the case when the true negative instance is lower than the prediction of true positive instance.
[image:5.612.173.358.193.402.2]
Figure.4 ROC curves for BCCD data
All the diagonal points presented in ROC curve of BCCD data set are above .5 and less than 1 that implies that all seven methods are fit for prediction of Breast Cancer Tumor and scale for ratings in difference of seven methods Random Forest is more
accurate than other six methods comparatively that shows in the table of AUC values for BCCD and highlighting the symptoms and prediction of breast cancer tumor has reflected the higher values for Random Forest.
Classification mode NN BN KNN DT RF LR SVM
Accuracy 0.600 0.525 0.587 0.686 0.743 0.657 0.714
Figure.5 ROC curves for WBCD data Figure 5 exhibits the values of ROC curve through AUC
values and identifies the area under curve, it implies that random forest area under curve is greater than other methods of machine learning such as Artificial Neural Network, Bayes Network,
k-Nearest Neighbors Algorithm, Decision Tree, Logistic Regression and Support Vector Machine. AUC values for the curves are given in table 6.
Classification mode NN BN KNN DT RF LR SVM
Accuracy 0.956 0.435 0.712 0.961 0.961 0.937 0.951 Table.6 AUC value of WBCD data
Roc Curves for the both BCCD and WBCD data set indicate the values of AUC in table 5 and 6, implies that amongst all the machine learning languages and classifiers random forest covers diagnosis for breast cancer more efficiently and intelligently. Classes for both the sets are 1 for malignant and 2 for benign. Curves are sectioned with malignant classification and implementation.
IV. CONCLUSION
In this study, seven classifiers applied after converting nominal to numerical values of data set in BCCD and WBCD. Seven methods are Artificial Neural Network, Bayes Network, k-Nearest Neighbors Algorithm, Decision Tree, Random Forest, Logistic Regression and Support Vector Machine. Purpose of implementing machine learning algorithms on datasets was to evaluate the performance of natural language and analyze which method is more efficient in diagnosing the breast cancer. Classes were selected as 1 “Malignant” and 2 “Benign”. Datasets were acquired by authentic source and used in several other studies to identify the case of breast cancer. This study used two datasets BCCD with 116 volunteers and 9 attributes and WBCD with 699 volunteers and 11 attributes to produce results using WEKA tools. Study used Cross validation, F-measure and AUC values to
only serve the cause of humanity but also highlights the importance of technology in Medical science.
Study concluded that machine learning algorithms are efficient way of producing the results of the diagnosis of breast cancer which can also be applied to other medical issues. Study also compares the result and interprets that performance evaluation of seven methods which resulted in Random Forest as the highest ranked method for diagnosing the breast cancer patient. Furthermore, if we apply these machines leaning methods on bigger data then might be possible we can get more accurate and efficient results.
REFERENCES
[1] https://www.who.int/cancer/prevention/diagnosis-screening/breast-cancer/en/
[2] al-shamlan, h. (2010). Mammogrpahy and imgaical data . Medial issues and future concerns , pp 21.
[3] Cicchetti, M. L. (1992). Maltreated children's reports of relatedness to their teachers. New Directions for Child and Adolesence , pp 23.
[4] Domínguez, R. (2009). Multi Modality State-of-the-Art Medical Image Segmentation and regressional Mthods. American Cancer Society, pp 23. [5] Gokhale. (2009). Ultrasound characterization of breast masses. Medicial
Sciences , PP 23.
[8] Liotta, P. a. (2007). Application of Machinec Learning in cancer diagnoiss . Cancer Informatics, pp 7.
[9] McCarthy. (2004). Cancer Stage at Diagnosis and Survival among Persons with Social Security Disability Insurance on Medicare. Heatth Services and Researchs , pp 8.
[10] Paola De Cicco, M. V. (2019). Nutrition and Breast Cancer: A Literature Review on Prevention, Treatment and Recurrence. Nutrients, 15-20. [11] Yixuan Li, Z. C. (2018). Performance Evaluation of Machine Learning
Methods for breast cancer prediction. Applied and Computational, 212-216.
AUTHORS
First Author – Ghufran Ullah, School of information
management (computer science), north China University of water resources and electric power, Henan, China,
Second Author – HaiYan, School of information engineering,