1
Review
1
Cloudy with a chance of insights: Context dependent
2gene regulation and implications for the evolution of
3gene expression
45
Elisa Buchberger1#, Micael Reis1#, Ting-Hsuan Lu1,2, Nico Posnien1*
6
1University Göttingen, Göttingen Center for Molecular Biosciences (GZMB), Dpt. of
7
Developmental Biology, Justus-von-Liebig-Weg 11, 37077 Göttingen, Germany
8
2International Max Planck Research School for Genome Science, Am Fassberg 11, 37077
9
Göttingen, Germany
10
#equal contribution
11
*contact: [email protected]
12
13
Abstract 14
Research in various fields of evolutionary biology has shown that divergence in gene expression is
15
a key driver for phenotypic variation. An exceptional contribution of cis-regulatory evolution has for
16
instance been found to contribute to morphological diversification. In the light of these findings, the
17
analysis of genome-wide expression data has become one of the central tools to link genotype and
18
phenotype information on a more mechanistic level. However, in many studies, especially if general
19
conclusions are drawn from such data, a key feature of gene regulation is often neglected. With our
20
article, we want to raise awareness that gene regulation and thus gene expression is highly context
21
dependent. Genes show tissue- and developmental stage-specific expression. We argue that the
22
regulatory context must be considered when studying evolution of gene expression.
23
24
Keywords 25
gene expression, gene regulation, evolution, allele specific expression, eQTL, RNAseq, ChIPseq,
26
chromatin, ATACseq, genotype-phenotype map
27
28
29
2 Introduction
30
Living organisms are uniquely characterized by their appearance, their function as well as
31
their interaction with the environment. The information about these features is provided in the
32
genome which is packed into the nucleus of each cell (see Figure 1A). Various disciplines of
33
biological and medical research aim at understanding how the genomic information is transformed
34
into organismic functionality. Proteins and peptides are the molecules that accomplish manifold tasks
35
in an organism, such as orchestrating its development [1], providing energy through metabolism
36
[2,3], protection via immune responses [4,5] and processing environmental information in the
37
nervous system [6,7]. Protein and peptide sequences are encoded in gene regions of the genome.
38
Genes are transcribed into ribonucleic acid (RNA) molecules that serve as templates for the
39
translation machinery that eventually synthesizes functional proteins. This process, called gene
40
expression, is thus a fundamental process of every living organism.
41
Since the identification of Deoxyribonucleic acid (DNA) as genetic material in 1944 [8] a
42
major focus in Evolutionary Biology and Quantitative Genetics has been to reveal the connections
43
between differences in DNA sequences and phenotypic variation observed among organisms (i.e. the
44
genotype-phenotype map) [9–12]. If causative genetic variation is identified in protein coding
45
sequences it is straightforward to directly link these differences to changes in protein function [13–
46
16]. However, if causative genetic variation is present in intergenic or intronic (i.e. non-coding)
47
sequences it is less intuitive to infer direct links between the observed difference and phenotypic
48
variation. Since these non-coding regions may contain important regulatory sequences, which
49
interact with DNA-binding proteins as well as non-coding RNAs involved in gene regulation, it is
50
conceivable to connect genetic variation in such regions with differential gene expression. With the
51
advent of efficient and affordable sequencing technologies (next generation sequencing, NGS) it
52
became feasible to study gene expression on a genome wide scale [17]. Since these technologies also
53
provide the opportunity to obtain such data in plant and animal systems beyond well-established
54
genetic models, gene expression has extensively been used as proxy for genetic variation to gain
55
insights into phenotypic evolution [18,19].
56
In this review we will first summarize findings illustrating the importance of gene expression
57
divergence in phenotypic evolution for various traits such as morphology, behavior, physiology and
58
life-history. Next, we will review various mechanisms underlying gene regulation and we will
59
highlight how they facilitate context dependent gene expression. Current approaches aiming at
60
understanding genome-wide patterns of gene expression divergence as well as the underlying
61
molecular mechanisms will be presented. Eventually, we will summarize limitations of current
62
approaches in the light of context dependent gene regulation and we will suggest how various
63
datasets can be integrated to gain comprehensive insights into the evolution of gene expression.
3 Gene expression divergence and phenotypic evolution 65
Changes in gene expression have been linked to many phenotypes studied so far. In the last
66
years, there has been an increase in the number of ecological and evolutionary studies using
67
transcriptomics to understand how environment and different life strategies affect gene expression
68
[20,21]. Most examples found in the literature connecting molecular variation affecting gene
69
expression divergence with phenotypes are based on studying simple morphological traits, such as
70
the evolution of trichome patterns in Drosophila or variation in body coloration. For instance, a clear
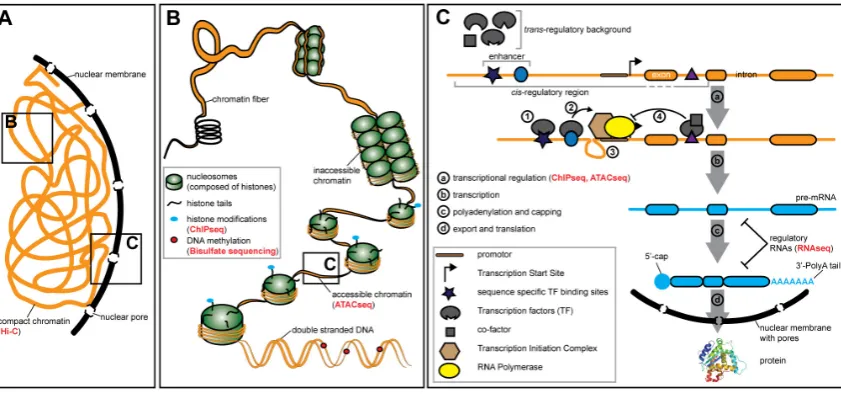
71
link between changes in the regulatory region of the shavenbaby gene and variation in trichome
72
patterns across Drosophila species has been established [22,23]. Similarly, individual nucleotide
73
polymorphisms in the ebony [24] and yellow genes [25] underly natural variation in body and wing
74
pigmentation, respectively, in Drosophila.Divergence in fur coloration in mice has been shown to
75
be regulated by differences in developmental expression of the gene agouti [26,27]. Moreover, the
76
stripe pattern of cichlid fishes is associated with variation in the expression of agouti-related peptide 77
2 (agrp2) [28].
78
Besides these classical traits, also more complex traits are being studied. In Drosophila,the
79
shape of male genitalia evolves rapidly, contributing to speciation processes. Variation in the
80
expression of the tartan gene has recently been shown to contribute to interspecific differences
81
between D. mauritiana and D. simulans [29]. Another study has shown that a single nucleotide
82
change in the cis-regulatory region of scute has pleiotropic effects by affecting both genitalia bristle
83
and sex comb sensory teeth number [30]. Hence, gene expression divergence is a major driver of the
84
evolution of morphological traits.
85
Recently, it has been argued that the molecular architecture of differences in behavioral traits
86
may be simpler than previously anticipated. For instance, a complex behavior such as sociality in
87
bees has been shown to be clearly associated with expression differences of the gene syntaxin1a,
88
since higher expression of this gene is directly correlated with a social life style in bees [31].
89
Similarly, differences in parental care between the promiscuous deer mouse (Peromyscus 90
maniculatus bairdii) and its sister species, the monogamous old-field mouse (P. polionotus 91
subgriseus) has been shown to be influenced by differential expression of the gene vasopressin [32].
92
These examples impressively demonstrate that natural variation in different behavioral traits is
93
associated with divergence in gene expression.
94
Many studies exploring the molecular basis of differences in physiological and life-history
95
traits followed by functional validation have confirmed an underlying polygenic architecture
96
[12,33,34]. Nevertheless, few studies reached the resolution to narrow down genetic variation to the
97
level of individual loci. A recent study in European aspen (Populus tremula) has shown that
98
expression differences of a single gene (PtFT2) are responsible for 65% of the variation in timing of
4
bud set [35]. Other studies similarly identified mutations in cis-regulatory regions causing variation
100
in gene expression which ultimately affects an organism’s physiological response to the environment.
101
For example, a 2 bp deletion in the promoter region of gene ERG28 in Saccharomyces cerevisiae has
102
been shown to result in reduced expression associated with resistance to an antifungal drug [36].
103
Similarly, an indel in the 3’UTR of MtnA that shows signatures of selection, causes a 4-fold
104
difference in gene expression and confers resistance to oxidative stress in natural populationsof D. 105
melanogaster [37].
106
In summary, variation in gene expression is a major driver for phenotypic divergence of
107
morphological and behavioural traits as well as for life history and physiological traits.
108
109
Gene expression and gene regulation are highly context dependent 110
The proper function of an organism relies on the correct expression of genes and the interplay
111
of gene products in each of its organs. Depending on the life span of the organism, each cell in an
112
adult organ must fulfil distinct functions for a long period of time. These functions are ensured by
113
tissue or even cell-specific gene expression. It has, for instance, been shown that the fundamental
114
function of the brain to form a long-term memory based on environmental cues and experiences is
115
associated with cell-type specific changes in gene expression profiles in Drosophila melanogaster 116
[38]. Disturbance of these fundamental functions ultimately leads to diseases and eventually to the
117
death of the respective organism. In humans, cancer formation and progression are strongly linked
118
to changes in the transcriptional profiles in the affected tissue [39]. Therefore, the expression of genes
119
must be tightly regulated to ensure allocation of the correct gene products at the right time in the
120
right cells.
121
While it is broadly accepted that gene expression and thus gene regulation is highly context
122
dependent [40], the underlying molecular mechanisms are being revealed only recently. In the
123
following we will highlight some major molecular mechanisms facilitating context dependent gene
124
regulation. Since a lot of our current understanding about the regulation of gene expression on an
125
organismic scale has been deduced from developmental genetics studies, the following examples will
126
be biased towards this research field. Of course, this does not interfere with the generality of the
127
presented findings.
5
Figure 1. Gene expression is regulated on various levels. (A) The DNA is compressed in the nucleus of the cell. (B) The DNA in the nucleus is compressed by binding of histone proteins. The chromatin contains easily accessible euchromatin regions and highly compact and inaccessible heterochromatin regions. The status of the chromatin is influenced by post-translational histone modifications. Gene expression is modulated by the chromatin state and DNA modifications, such as methylations. (C) Key steps of gene expression (a-d). Transcription factors (TFs) bind to the DNA at specific sequences (1). TF binding activates the Transcription Initiation Complex (2) through conformation changes in (looping) of the DNA (3). TFs can also repress transcription, for instance by binding of a co-factor (4). NGS based methods that can be applied to study certain aspects of gene regulation are mentioned in red in brackets. See Table 1 for an overview of the methods mentioned here.
129
Pre-transcriptional regulation - chromatin states and methylation 130
First regulatory mechanisms are at play on the level of genome organisation. Compressed
131
DNA in the nucleus forms a tertiary structure (Figure 1A) that can be studied in detail by an NGS
132
based chromosome conformation capture method called Hi-C [41] (Table 1). Hi-C applied in various
133
bilaterians revealed one fundamental characteristic of the genome: Some regions of the genome
134
interact consistently more often than other regions [42–44]. These topologically associating domains
135
(TADs) have been shown to influence gene expression. For instance, the famous temporal and spatial
136
collinearity of Hox gene expression in the developing vertebrate limb has been associated with the
137
location of the HoxD cluster in a gene desert that lies between two adjacent TADs [45]. Chromatin
138
interactions between promoter regions and distant regulatory sequences are pervasive in vertebrates.
139
The application of Hi-C in different human primary blood cell types showed that these interactions
140
are highly cell-type specific [46]. How the three-dimensional organization of the genome exactly
141
influences gene regulation has just started to be revealed and represents an active and exciting field
142
of research.
143
Much more detailed knowledge has been accumulated on the level of chromatin organization
144
and its impact on gene expression. The compressed DNA in the nucleus can be subdivided into
145
loosely packed and easily accessible euchromatin and condensed and inaccessible heterochromatin
146
(Figure 1B). Most actively transcribed genes are located in euchromatic regions and their DNA
147
sequence is free of nucleosomes to allow transcription factors to bind. These nucleosome free regions
6
can be detected on a genome wide scale using NGS based methods such as ATACseq (Assay for
149
Transposase-Accessible Chromatin using sequencing) [47] (Table 1). Recent application of
150
ATACseq on single cells originating from 13 different mouse tissues [48] and from three stages of
151
Drosophila embryonic development [49] revealed clear signatures of cell type and stage specific
152
chromatin accessibility states. The chromatin state and thus DNA accessibility is influenced by
153
modifications of histone proteins, the subunits of nucleosomes. A clear link between histone
154
modifications and gene regulation has been established [50,51] and genome wide surveys based on
155
ChIPseq (Chromatin Immunoprecipitation followed by next generation DNA sequencing) [52,53]
156
(Table 1) revealed tissue and cell type specific histone modification patterns [54,55].
157
Chromatin accessibility and genome architecture is also regulated by a variety of non-coding
158
RNA molecules, which are transcribed, but not translated into proteins. Long non-coding RNAs
159
(lncRNAs) localized in the nucleus can directly affect chromatin architecture [56] and they can
160
recruit proteins of the Polycomb Repressive Complex 2 (PRC2) and histone methyltransferases,
161
which are associated with inactive heterochromatin. Intriguingly, the lncRNA-protein interactions
162
are tissue specific since they were observed in mouse placenta cells, but not in liver tissue [57].
163
lncRNAs have also been implicated in transcriptional activation via direct interaction with a protein
164
complex that mediates histone H3 lysine 4 trimethylation, an active histone mark [58].
165
Transcriptional activation is also achieved through direct interaction of lncRNAs with protein
166
complexes that stabilize enhancer-promotor interactions [59]. Micro RNAs (miRNAs), another
167
group of non-coding RNAs, have been shown to directly modulate histone modifications and thus
168
the chromatin accessibility to allow transcription of target genes [60]. Since miRNAs are highly
169
tissue specifically expressed [61–63], these molecules provide an excellent mechanism to facilitate
170
tissue specific chromatin accessibility.
171
Even if DNA is accessible, the transcription of genes can be modulated by DNA methylation,
172
i.e. the addition of a methyl group to cytosines. DNA methylation has been associated with gene
173
repression [64,65] and recent data has shown that transcription factors can integrate methylation
174
patterns to refine gene regulation [66]. Since the methylation is highly dynamic, for instance
175
throughout cellular differentiation [67], it facilitates context dependent gene regulation.
176
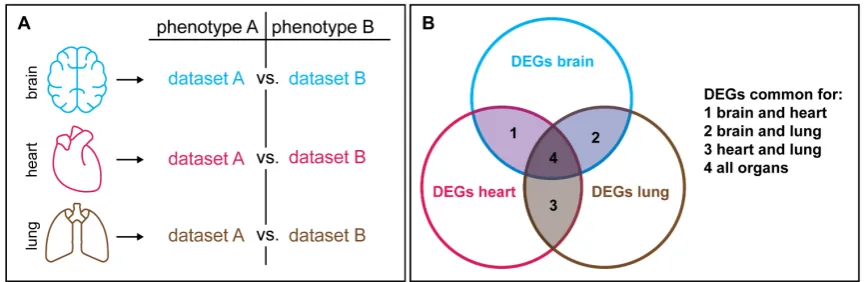
In summary, the extensive diversity of epigenetic modifications, which are further modulated
177
by non-coding RNAs regulate differential DNA accessibility and thus provide a rich cellular
178
repertoire to modulate gene expression pre-transcriptionally.
179
180
Transcriptional regulation – transcription factors and cis-regulatory elements 181
Once the chromatin is accessible for proteins, gene expression is directly regulated by
182
protein-DNA interactions [68,69] (Figure 1C). Transcription factors are proteins with dedicated
7
DNA-binding domains and their sequence specific binding fosters or represses gene expression. A
184
classic example for context-specific gene regulation via transcription factors is the development of
185
different neuronal subtypes in the Drosophila central nervous system. Initially, all neuronal precursor
186
cells, the neuroblasts, contain generic neuronal transcription factors [70]. The unique identity of each
187
neuroblast is further specified by spatial and temporal cues. Different neuronal subtypes are defined
188
by the expression of temporally restricted transcription factors [71] and the regional identity of
189
neuroblasts is regulated by the expression of spatially restricted transcription factors [72]. Therefore,
190
context dependent gene regulation can be achieved on the level of the presence of transcription
191
factors which are expressed cell and time specifically.
192
Besides the transcription factors itself, the nature of the DNA sequences they bind to plays a
193
major role in gene regulation. These cis-regulatory regions can be subdivided based on their location
194
relative to the respective gene locus (Figure 1C). Promoters lie directly upstream of the transcription
195
start site and general transcription factors bind there as part of the transcription initiation complex
196
[73,74]. Enhancers are cis-regulatory sequences that are located further away up- and downstream
197
of the transcription start site. They are composed of distinct sequence motifs that are specifically
198
recognized by certain transcription factors. Transcription factors bound to enhancers facilitate the
199
assembly and activation of the transcription initiation complex at the promoter [75,76]. Please note
200
that cis-regulatory elements do not only have positive effects on gene expression. cis-regulatory
201
elements with a repressive impact on gene expression (i.e. silencers) were described, as well as
202
elements protecting a given gene locus from adjacent regulatory input (i.e. insulators). Although we
203
focus here on enhancers, many of the discussed aspects apply to these elements as well. Enhancers
204
have been shown to be highly modular [77,78]. This is best exemplified by the regulation of the
pair-205
rule gene even skipped(eve) during segmentation in the Drosophila embryo. The seven stripes of eve 206
expression are defined by five enhancers with each of them being responsible for an individual stripe
207
or a pair of stripes [79,80]. During Drosophila eye development, the gene eyes-absent (eya) is
208
expressed in undifferentiated cells that undergo cell division, as well as in differentiating cells that
209
do not divide anymore. Although these cells are present in the same tissue in close proximity, the
210
expression of eya is regulated by different combinations of several enhancers [81]. The modularity
211
and dynamic usage of enhancers have also been shown on a genome-wide scale during Drosophila 212
embryonic development [82]. Therefore, the modular nature of enhancers provides a source for
213
context-dependent activation (and repression) of genes.
214
The interaction of transcription factors and cis-regulatory elements can be further diversified
215
by the interaction of transcription factors with co-factors that modulate for instance their capacity to
216
bind to regulatory regions (Figure 1C). One excellent example for the context dependence of gene
217
regulation achieved via the spatial availability of co-factors has been shown in the developing wing
218
disc of Drosophila. During wing development, the transcription factor Pannier (Pnr) can act as an
8
activator in some regions of the wing imaginal disc, while the presence and binding of its co-factor
220
U-shaped (Ush) transforms it into a transcriptional repressor in adjacent regions [83–85]. The
221
importance of transcriptional co-factors has also been shown on a genome wide scale. For instance,
222
the two transcription factors CLOCK (CLK) and CYCLE (CYC), which are core components of the
223
circadian clock in flies, are broadly expressed. However, the tissue specific response to the circadian
224
clock is defined by the action of co-factors, which modulate the DNA binding capacities of these two
225
transcription factors in a tissue specific manner [86]. The modulation of protein-DNA interactions
226
by co-factors bound to transcription factors thus provides an additional mechanism to ascertain
227
context-dependent gene expression.
228
In summary, the interaction of spatially and temporarily expressed transcription factors, with
229
defined DNA sequences specifies the unique transcriptional landscape of a developing cell or cell
230
groups.
231
232
Post-transcriptional regulation – RNA modifications and regulatory RNA molecules 233
Apart from the regulation of transcription itself, the transcriptional outcome can be
fine-234
tuned on the level of the messenger RNA. For instance, post-transcriptional modifications, such as
235
polyadenylation and capping influence mRNA export, stability and translation efficiency [87–89].
236
Differential splicing of primary transcripts allows enlarging the repertoire of proteins to be translated
237
from a limited number of primary RNAs. Splicing is mediated by a specific protein-complex [90]
238
and it has been shown that tissue and cell type specific patterns of splicing factor expression
239
recapitulate the extent of alternative spliced transcripts present in the respective tissue [91].
240
Post-transcriptional gene regulation is also mediated by regulatory RNA molecules, which
241
can be involved in negative gene regulation via the RNA interference (RNAi) pathway (e.g. miRNA)
242
[92] or they are part of RNA-protein complexes (e.g. lncRNA) where they influence gene regulation
243
on various levels [93]. lncRNAs present in the cytoplasm also influence mRNA stability [94,95] and
244
they can protect mRNA against targeted degradation by trapping miRNAs in a sponge-like
245
mechanisms [96]. Regulatory RNAs play a major role during development [93,97] and their
246
expression has been shown to be cell type specific [98,99]. Context dependent gene regulation can
247
thus be mediated post-transcriptionally by differences in generic RNA modification programs (e.g.
248
splicing) or by the action of regulatory RNA molecules (miRNA, lncRNA).
249
250
251
9
Table 1. Next generation sequencing techniques used for studying gene expression and gene regulation in evolutionary
253
studies. Methods labelled with * require a reference genome.
254
Method Key information
RNAseq Summary: RNA is isolated and reversed transcribed into cDNA for library preparation and sequencing. Practical considerations: The most common protocol uses oligo-dT primers to enrich for polyadenylated RNAs for reverse transcription of processed mRNA [17] and the majority of lncRNAs [100]. Alternative protocols use total RNA and ribosome depletion prior to reverse transcription with random oligos to obtain other RNA molecules (e.g. immature mRNA, miRNA and siRNA) [101]. For small RNA enrichment several commercial kits are available which select for molecule sizes less than 30 nucleotides [102].
Applications: Transcriptome generation for gene annotation including alternative isoforms (paired-end sequencing) and differential gene expression analysis between different samples (e.g. tissues, experimental conditions, populations of the same species or even species showing different phenotypes) [103,19,18,20,21]. RNAseq is also a useful tool for miRNA profiling and annotation [104] as well as differential expression of lncRNAs [105].
Single cell application: [106–108]
ATACseq* Summary: Accessible chromatin regions which are not condensed by histones, are digested with a genetically modified transposase (Tn5). Nucleotide overhangs (tagmentation) are utilized for specific adapter ligation during the library preparation and sequencing [47,109]. This method substituted previous ones such as DNaseseq and FAIREseq, due to its simplicity and effectiveness.
Practical considerations: Usually the protocol should be done with fresh tissue and a defined number of nuclei/cells (e.g 500-50000 for mammalian tissues [109]) that have to be estimated prior to tagmentation. These technical aspects limit the number of samples that can be processed simultaneously. However, protocols were successfully applied to frozen tissue [110].
Applications: ATACseq is commonly used to complement RNAseq data to identify potential regulatory regions (enhancers) [111]. ATACseq can also be used to evaluate chromatin structure dynamics and epigenetic changes by providing information about histone position as well as a complementary approach to ChIPseq to characterize transcription factor and repressor (e.g. CTCF) occupancies [47]. Single cell application: [112,113]
ChIPseq* Summary: DNA bound proteins (e.g. transcription factors, histones) are crosslinked and the chromatin is digested with restriction enzymes. Antibodies specific for the DNA-binding protein are used to isolate Protein-DNA fragments. Upon reversal of the crosslink and dissociation of the DNA libraries for short read sequencing are prepared [52,53].
Practical considerations: This technique relies on previous knowledge about the DNA-binding proteins and available antibodies.
Applications: ChIPseq is commonly used to generate genome wide data on protein-DNA interactions, mainly to determine transcription factor binding sites and their binding dynamics [114]. It has been used also to estimate histone modifications and nucleosome position between different species [54]. Single cell application: [115]
Hi-C* Summary: DNA-binding proteins and chromatin are covalently crosslinked with formaldehyde and digested with a restriction enzyme. The resulting fragments are ligated to create chimeric molecules of DNA which are further isolated for library preparation and sequencing [116].
Practical considerations: Hi-C relies in restriction enzyme recognition sites which can create bias due to their heterogeneous distribution in the genome [117]. Alternative methods used DNase I [118] or micrococcus digestion [119] to overcome that issue.
Applications: Hi-C is commonly used to identify global patterns of 3D genome conformation. Additionally, this method allows exploring how interactions between different chromosomal regions can affect gene regulation. The impact of chromatin topology on gene expression between species has been studied [120,42,121].
Single cell application: [122]
BSseq Summary: DNA is treated with sodium bisulfite to deaminate cytosine bases into uracil (thymine after PCR) while methyl-cytosine bases are not affected [123]. The treated DNA is then digested for library preparation and sequencing [124].
Practical considerations: The deamination reaction usually has high yield, but small variations can create significant bias in the estimation of global methylation patterns [125]. Since cytosine is converted into thymine, the sequence complexity is reduced, and the strands are no longer complementary causing potential problems with the alignments. However, dedicated software has been developed to deal with the challenging BSseq data analysis [reviewed in 126].
Applications: This method is used to obtain genome wide patterns of DNA methylation which is an important epigenetic modification typically associated with gene expression repression [124]. In recent years, this method has been extensively applied to ecological and evolutionary studies [127,125]. Single cell application: [128,129]
255
10 Evolution of gene expression is context dependent 257
Genome wide expression studies have been broadly used to show that the evolution of gene
258
expression is context dependent. A study of six homologous organs in nine mammals and one bird
259
showed that gene expression evolves at different speeds in different tissues as well as in different
260
lineages. While gene expression was more stable in nervous system tissue, it evolved more rapidly
261
in testes. Similarly, this work revealed that gene expression variation was less pronounced in rodents
262
compared to apes [130]. Additionally, it has been shown that genes that are expressed in many
263
tissues, i.e. pleiotropic factors, experience more constraints than tissue specific genes [131,132].
264
Comparative expression studies have also been employed to assess the impact of developmental
265
stages on the evolution of gene regulation. The analysis of expression data from various
266
developmental stages in different vertebrates revealed the pharyngula stage to be most constraint (i.e.
267
most similar) [133,134]. Intriguingly, a similar analysis restricted to the developing brain, instead of
268
entire embryos, identified a stage of high conservation of gene expression much later just before birth
269
[135].
270
Comparative studies in five mammals [136] and twelve Drosophila species [62] revealed
271
that also non-coding RNA molecules evolve in a highly context dependent manner. For instance,
272
high turnover rates have been associated with the underlying molecular mechanisms involved in
273
miRNA maturation [62]. Additionally, novel miRNAs tend to be expressed highly tissue specifically
274
[136,62], suggesting that the evolvability of miRNAs is constraint by the regulatory context.
275
Structural constraints on sequence variability have also been observed for lncRNAs, since they are
276
mostly conserved across vertebrates in 5-prime exonic regions [137].
277
These examples clearly demonstrate that the context in which gene expression variation is
278
studied, such as the type of tissue or developmental stage poses constraints on the overall evolvability
279
of gene expression.
280
281
Evolutionary correlation studies in the light of context dependent gene expression 282
Many studies employ gene expression as intermediate phenotype to link genetic variation to
283
trait divergence. Since high throughput sequencing methods are highly sensitive, even subtle changes
284
in gene expression can be detected. Therefore, these analyses commonly result in large lists of genes
285
that show significant differential expression between phenotype classes. In the following we
286
highlight some characteristics of such gene lists and we will present ideas to improve the
287
identification of meaningful candidate genes in the light of context dependent gene expression.
288
289
11 Impact of tissue-specificity on signal-to-noise ratio 291
Not all identified genes may be directly associated with the trait of interest, but rather
292
represent background noise. If the analyzed tissue or time point has not been chosen as specifically
293
as possible (Table 2), it is more difficult to separate background signal from putative relevant signals.
294
Few studies specifically tested whether complex tissue composition indeed influences the sensitivity
295
to detect gene expression differences. A RNAseq study in Drosophila melanogaster compared
296
genome wide expression of wildtype central nervous system tissue to tissue extracted from transgenic
297
flies after RNA interference (RNAi) mediated cell-type specific downregulation of a ubiquitously
298
expressed gene. Intriguingly, the authors could show that contamination by surrounding tissue was
299
sufficient to hamper the identification of the artificially downregulated gene [138]. This specific
300
example strongly suggests that restricting sequencing efforts to the tissue and time point of interest
301
allows identifying differentially expressed genes as specific as possible.
302
The lack of tissue specificity can partially be accounted for by cell type or tissue enrichment
303
in model organisms that offer a versatile transgenic toolkit (see also Table 2). This approach usually
304
requires the generation of transgenic individuals in which the target cell type or tissue is labeled by
305
artificial fluorescent markers such as green fluorescent protein (GFP). Upon tissue dissociation, the
306
labeled cells can be sorted by fluorescence-activated cell sorting (FACS) and classical bulk-RNAseq
307
can be performed subsequently. This method has been successfully used to identify cell-type specific
308
gene expression profiles [139–141] as well as to reveal candidate genes in evolutionary studies [142].
309
While this approach is restricted to genetically tractable model systems and requires in-depth
310
information about the tissue of interest, recent advances in single cell RNA sequencing (scRNAseq)
311
provide an excellent opportunity to gain cell type specific insights into gene expression of
312
heterogeneous tissues without prior knowledge [106–108] (Table 2). A huge body of work has been
313
published reporting for instance single cell atlases for various organisms such as embryos of
314
Drosophila melanogaster [143], the cnidarian Nematostella vectensis [144], the planarian Schmidtea 315
mediterranea [145] or the marine annelid Platynereis dumerilii [146]. Also, organ specific single
316
cell atlases are being generated these days: In Drosophila for instance, new biological insights into
317
the cell diversity, cell specific gene expression and gene regulation have been gained for entire aging
318
brains [147], but also for parts of the brain such as the optic lobes [148] and the mid-brain [149].
319
Eventually, scRNAseq also allows to gain new major insights into developmental processes, such as
320
cell lineage specification [150], regulation of cell differentiation [151], molecular underpinnings of
321
pluripotency [152] and the reconstruction of cell specific gene regulatory networks [153,154]. In
322
summary, scRNAseq represents an exciting new method to study context dependent gene expression
323
and regulation in complex tissues.
324
325
12 Table 2. Comparison of different RNA sequencing methods.
327
bulkRNAseq of whole individuals
bulkRNAseq with prior selection
scRNAseq
What can I do?
Gain cell type specific gene expression - +/- +
Identify overall gene expression profile + - -
What do I need?
Prior knowledge about the tissue or cells of interest - + -
Transgenic organisms/fluorescently labeled cells - + -
Specific technique to obtain tissue/ cells - +/- +
328
Integration of information on biological functions helps identifying meaningful candidate genes 329
While many genes show context dependent expression, housekeeping genes, which fulfil
330
generic tasks in each cell are often stably expressed across different tissues.Comparative approaches
331
can be used to exclude generic differentially expressed genes by analyzing which transcripts are
332
consistently differentially expressed across different tissues or time points and can therefore be
333
removed from candidate gene lists (Figure 2).
334
It is also helpful to have some prior knowledge about molecular pathways and processes that
335
are involved in regulating the trait of interest. Variation in physiological traits may be associated
336
with hormonal signals or enzymatic reactions, while morphological divergence is often linked to
337
differences in underlying developmental processes. The growing Gene Ontology (GO) database
338
coordinated by the Gene Ontology Consortium [155,156] provides an excellent basis for integrating
339
differential gene expression and molecular functions. This tool allows to structure and categorize a
340
list of candidate genes if no prior molecular or cellular knowledge for the trait of interest is available,
341
by testing, whether a list of candidates is enriched in GO terms with a particular molecular or cellular
342
function. Similarly, gene set enrichment analysis (GSEA) [157–160] can be employed to reveal if
343
specific molecular or developmental pathways are involved in the development of the trait of interest
344
[161]. Hence, the implementation of biological knowledge helps finding patterns in an otherwise
345
unstructured dataset and helps to restrict the number of meaningful candidates.
346
13
Figure 2. Generic factors that across different tissue can be excluded in correlation studies. (A) If specific candidate genes that are differentially expressed between phenotype A and B are supposed to be revealed, one can generate a comparable dataset for additional tissues. (B) Each pairwise comparison will reveal a certain number of differentially expressed genes (DEGs). The DEGs that are common in two (1-3) or all organs (4) are most likely generic factors that may be less informative for follow-up analyses.
Towards an integrative approach to establish genotype-phenotype associations 348
Another important source of reduction of candidate genes in correlative studies is the
349
generation of complementary datasets. Quantitative genetics approaches, such as genome wide
350
association studies (GWAS) or quantitative trait loci (QTL) mapping can be applied to identify
351
candidate loci that show association between phenotypic divergence and genomic variation. This
352
data can be extremely helpful to overlap with candidate gene lists obtained from differential gene
353
expression studies. This combinatorial approach has been successfully applied to reveal candidate
354
genes involved in different nest building behaviors among the two mouse species Peromyscus 355
polionotus and P. maniculatus. The 498 candidate genes in a QTL region associated with behavioral
356
differences were reduced to 23 genes that were differentially expressed in the brain region
357
responsible for the studied behavior. Only nine of these 23 genes showed signatures of cis-regulatory
358
divergence, suggesting that these were excellent candidate genes. Subsequent functional validation
359
tests confirmed the involvement of one of the candidates in the respective behavioral differences
360
[32]. Similar combinations of QTL mapping and genome wide differential expression analyses have
361
been applied to identify key candidate genes responsible for variation in salt tolerance in rice (Oryza 362
rufipogon) [162] and flowering time in rape (Brassica napus) [163].
363
Also, population genetics data that provides genome wide insights into signatures of
364
selection may be meaningful to overlap with expression data. This has been successfully used in
365
domestication studies. The combination of two datasets revealed one gene that was differentially
366
expressed between wild and domestic duck brains and showed signs of selection. This gene is a
367
strong candidate that may explain phenotypic differences associated with duck domestication [164].
368
These examples show that the combination of independent datasets providing information about
369
different levels of the genotype-phenotype map are thus powerful ways to link genetic variation to
370
phenotypic divergence.
371
14 Evolution of gene regulation mechanisms 373
The accumulation of comparative gene expression data triggered a strong interest in
374
unravelling the molecular and evolutionary mechanisms underlying divergence in gene expression.
375
Most of our current mechanistic understanding of gene expression divergence is based on work in
376
genetic model systems that are tractable for genetic crosses. Two main methods have been employed
377
extensively in recent years, i.e. expression QTL (eQTL) mapping and allele-specific expression
378
studies (ASE). In the following, we summarize the key concepts of the two approaches, and we
379
discuss limitations and chances in the light of context dependent gene expression and regulation.
380
381
eQTL and ASE studies to reveal mechanisms underlying evolution of gene expression and gene 382
regulation 383
eQTL studies are basically QTL or GWAS studies aiming at identifying causative loci
384
responsible for gene expression variation. Conceptionally, this method assumes that the level of gene
385
expression can be treated as a quantitative trait [165–167]. Therefore, normal QTL or association
386
mapping methodology can be applied to reveal genomic variants for genome wide expression
387
divergence. A typical outcome of such studies is the identification of genomic variants that are either
388
located close to the gene that shows expression divergence (local QTLs; also referred to as cis-QTLs)
389
or far away (distant QTLs; also referred to as trans-QTLs). It is important to note here that the
390
distinction is purely based on the location of the variant with respect to the studied gene and that cis 391
and trans in this context does not refer to any mechanism involved (see below). eQTL studies already
392
successfully revealed some fundamental principles underlying gene expression divergence. Various
393
studies have shown that gene expression is indeed highly variable across individuals and heritability
394
estimates support the contribution of a genetic component [168].
395
While eQTL studies reveal genomic loci or individual SNPs associated with expression
396
difference, ASE studies in F1 hybrids represent a powerful approach to gain mechanistic insights
397
into differential gene expression [169]. The analysis of gene expression between homozygous parents
398
(closely related species or populations of the same species) and the allele specific expression in their
399
heterozygous F1 offspring allows distinguishing whether a gene is differentially expressed due to
400
changes in its own regulatory region (cis-regulatory divergence) or due to changes somewhere else
401
in the genome (trans-regulatory divergence) [170,171]. cis-regulatory divergence is inferred if two
402
different alleles of a given gene have a major impact on its allele-specific expression in the
403
homogenous trans-regulatory background of the F1 hybrid. trans-regulatory divergence is inferred
404
if a gene is differentially expressed between two parental individuals, but the contribution of the two
405
alleles in the hybrid background is the same. ASE studies in various organisms contributed to
406
exciting general insights into mechanisms underlying gene expression divergence. The most
15
consistent observation is that cis-regulatory divergence seems to be prevalent in intra- as well as
408
interspecific comparisons [172–175]. Exceptions have been observed for instance for comparisons
409
between the cosmopolitan fly species D. melanogaster and the closely related specialist species D. 410
sechellia [176]. Nevertheless, in all mentioned ASE studies, a major impact of a combination of cis-
411
and trans-divergence has been observed, strongly supporting the notion that gene regulation is
412
complex and thus can evolve in complex patterns.
413
414
Limitations of eQTL and ASE studies 415
Although eQTL and ASE studies revealed fundamental concepts underlying gene expression
416
variation, a comprehensive molecular understanding is still lacking. An intrinsic limitation of eQTL
417
studies for instance is to ascribe a specific regulatory mechanism (see Figure 1) to the identified
418
genetic variants. While it is conceivable that variation close to the gene locus (i.e. cis-QTLs) may
419
affect expression of the gene due to differences in promotor by modification of transcription
factor-420
DNA binding, it is much more complicated to assign regulatory mechanisms to trans-QTLs.
421
Similarly, ASE studies alone do not allow identifying specific genetic variants. However, one of the
422
most likely explanation for cis-divergence effects is sequence variation in the regulatory region (i.e.
423
promoters or enhancers) of the differentially expressed gene. Indeed, in putative regulatory regions
424
of genes showing cis-regulatory divergence increased levels of sequence divergence have been found
425
in yeast [177], Arabidopsis thaliana [178], maize [179] and Drosophila [176,180]. A combination
426
of ASE and SNP data obtained from lymphoblastoid cell lines from the 1,000 Genomes Project
427
further strongly suggests that genetic variation is a common explanation for allele-specific gene
428
expression [181]. As for eQTL studies, it is much more complicated to define trans-regulatory
429
divergence mechanistically since these effects can result from various factors, such as expression or
430
coding differences of transcription factors, the presence of transcriptional co-factors or the
431
differential expression of regulatory RNA molecules.
432
In addition to the complication to assign regulatory mechanisms, eQTL studies have shown
433
that the level of heritability is relatively low and the effect size of identified associated genomic
434
variants is normally small [182]. These observations strongly suggest that gene expression
435
divergence is affected by various other factors, such as epigenetic modifications or environmental
436
cues. Therefore, a much better integration of complementary datasets is needed. We argue that the
437
combination of eQTL and ASE studies with comparative datasets aiming at identifying open
438
chromatin regions, epigenetic features or regulatory RNAs has the potential to identify new
439
molecular mechanisms driving the evolution of gene expression.
440
441
16
From eQTLs and ASE to mechanisms – natural variation in regulatory traits 443
Understanding the evolution of gene expression on a mechanistic level requires revealing
444
how natural variation at the different levels of gene regulation (see Figure 1) influences gene
445
expression. Exceptional insights into the impact of genetic variation associated with different
446
regulatory traits, such as chromatin architecture, chromatin accessibility, histone modifications as
447
well as alternative splicing on gene expression and the resulting protein composition have been
448
gained by studying lymphoblastoid cell lines as part of the HapMap2 [183] and 1000 Genomes
449
Project [181]. These cell lines were established from hundreds of individuals and subjected to
450
genome sequencing, providing a solid basis for association studies for various regulatory traits in
451
combination with expression variation and eQTLs.
452
eQTL studies revealed SNPs affecting all levels of gene regulation including genome
453
organization [184], chromatin accessibility [185], histone modifications, RNA-Polymerase II
454
occupancy and eventually gene expression [186,187]. An exciting link has been established between
455
variation in transcription factor binding affinity and differences in histone modifications. Genetic
456
variants that confer higher transcription factor binding affinity are also associated with an increase
457
in active histone marks [186]. This observation has been functionally validated for the RE1-silencing
458
transcription factor (REST) during neural differentiation in mouse. It has been shown that REST
459
recruits the repressive histone mark H3K27me3 which is depleted upon loss of REST function or
460
loss of the REST binding motifs. Intriguingly, the artificial insertion of REST binding motifs is
461
sufficient to recruit ectopic H3K27me3 [188], supporting a tight causal link between transcription
462
factor binding and histone modifications. In the light of recent findings that the rate of gain and loss
463
of active enhancer elements in five closely related Drosophila species is relatively high [189], it is
464
conceivable that natural genetic variation may very quickly affect gene expression on various levels
465
ranging from transcription factor binding to histone modification and chromatin accessibility.
466
Since about 65% of the eQTLs (i.e. variation in gene expression) are associated with histone
467
modifications and chromatin accessibility [190], the final composition of the proteome must be
468
additionally controlled by other processes, such as post-transcriptional regulation. Most importantly,
469
mRNA splicing contributes to the complexity of the protein content in a cell and individual SNPs
470
have been associated with differences in splicing [191,190]. These so-called splicing QTLs (sQTLs)
471
were predominantly found at the respective splice sites close to exon boundaries (i.e. cis sQTLs) and
472
some of the identified trans sQTLs were linked to proteins involved in RNA processing [191,190].
473
Since the spliceosome is already assembled during ongoing transcription, the chromatin state and the
474
transcription rate can influence splicing events [192]. The observation that CTCF binding, which is
475
highly influenced by DNA methylation patterns, results in RNA-Polymerase II pausing and
476
subsequent inclusion of weak upstream exons have started to reveal the mechanistic interplay of
477
epigenetic marks and differential splicing [193].
17
GWAS studies of whole blood samples from 347 human individuals have also revealed a
479
link between natural variation of epigenetic methylation patterns and gene expression, by suggesting
480
that the same genetic variant is associated with variation in gene expression and the methylation of
481
a CpG island close to the respective gene locus [194]. Interestingly, a comparative study of
482
methylation in promotor regions of primates has shown that methylated CpG islands are
483
characterized by a higher mutation rate and that the loss of CpG islands in humans is most likely
484
driven by methylation in sperm [195]. In summary, variation in gene expression, gene regulation and
485
methylation are tightly linked and differences in methylation levels can shape the genetic
486
composition.
487
The outlined findings provide exceptional mechanistic insights into the effect of genetic
488
variants on all levels of gene regulation and thus gene expression. Especially, the observation that
489
many regulatory traits are functionally linked and therefore similarly affected by SNPs may explain
490
why natural variation in gene expression is pervasive in nature and can drive phenotypic
491
diversification.
492
493
Context dependent gene expression and the evolution of gene regulation 494
Although the association data obtained from human cell lines allow unprecedented detailed
495
insights into the impact of natural variation on gene regulation, they only represent a snapshot of the
496
complexity of gene expression. This is largely due to the context dependence of gene expression and
497
gene regulation. While phenotypic traits in classical association or linkage mapping studies are
498
clearly defined, gene expression varies significantly across developmental stages, tissues or even cell
499
types. A comparison between mouse embryonic and adult tissue has shown that many more distal
500
(“trans”) eQTLs were found in adults compared to the investigated embryonic stage [196].
501
Similarly, the analysis of sexually dimorphic gene expression in different organs in intercrosses of
502
two inbred mouse strains revealed that the expression of dimorphic genes was tissue specific.
503
Additionally, tissue specific eQTL regions were identified, suggesting that expression differences
504
between sexes are regulated by tissue specific regulatory elements [197].
505
ASE studies have identified general mechanisms underlying the evolution of gene
506
expression. However, to date, ASE studies mainly provide insights into expression divergence in
507
adults and for entire organisms. Indeed, very few studies have used this approach to evaluate
508
divergence types in different conditions. It has for instance been shown in closely related Arabidopsis 509
species that environmental factors influence the excess of cis-regulatory divergence [198,199].
510
Similarly, different contributions of cis- and trans-divergence (or combinations thereof) have been
511
obtained by comparing differently aged flies [200] and when data from entire fly bodies was
512
compared to heads only [174,176]. A recent ASE study using tissue specific data for Malpighian
18
tubules of different D. melanogaster populations further supports the need for more defined analyses
514
[201]. In the light of context dependent gene regulation these first results call for an integration of
515
stage or tissue specific aspects of gene expression in eQTL and ASE studies in order to reveal
516
whether patterns observed so far will hold true across highly variable regulatory environments.
517
518
Outlook and Summary 519
We are currently living in exciting times with functional genomics and transcriptomics
520
methods being widely applicable (Table 1). This provides an unprecedented opportunity to test,
521
whether mechanistic insights obtained by highly coordinated consortia studying human cell lines as
522
well as tractable genetic model system such as yeast and Drosophila hold true in other study systems.
523
For instance, epigenetic factors are being studied with respect to transgenerational information
524
transfer [202] and in relation to phenotypic plasticity [203] in various emerging model systems.
525
Therefore, genome wide information on methylation patterns [204] should be studied in many
526
systems in the context of gene regulation. Chromatin accessibility can be studied applying ATACseq
527
[47] in many systems to relate comparative gene expression data or results obtained from ASE studies
528
to genomic regions that most likely contain meaningful regulatory elements. Similarly, ChIPseq
529
[52,53] for certain histone modifications that either mark active or inactive gene loci [205] is
530
applicable in a variety of organisms. Another exciting new area of research deals with the impact of
531
the three-dimensional organization of the genome on gene expression and regulation. Few studies
532
compared genome organization across organisms [206], but the picture emerges that global
533
organizational patterns (e.g. TADs) may be highly conserved, suggesting that the three-dimensional
534
chromatin organization can pose constraints on the evolution of gene regulation.
535
In summary, comparative genome wide expression studies have been extensively used to
536
reveal candidate factors to inform about the genotype-phenotype map (correlation studies) as well as
537
to gain mechanistic insights into the evolution of gene regulation (eQTL and ASE). We argue that
538
much more defined datasets must be generated in the future to fully account for the complexity and
539
context dependency of gene regulation to increase the power to detect more meaningful candidate
540
genes in correlation studies. We strongly believe that our current understanding of the evolution of
541
gene expression provides a solid basis to incorporate new aspects of gene regulation, that are being
542
revealed on a regular basis, to gain exciting new mechanistic insights into the evolutionary processes.
543
There is still a sphere of cloudiness around the evolution of gene expression but digging deeper holds
544
a chance of insight.
545
19 Author Contributions
547
Conceptualization, all authors, writing—review and editing, all authors; visualization, NP;
548
supervision, NP
549
Funding 550
Our work is funded by the Emmy Noether Programme of the Deutsche Forschungsgemeinschaft
551
(grant number: PO 1648/3-1) to NP.
552
Conflicts of Interest
553
The authors declare no conflict of interest. The funders had no role in the writing of the manuscript.
554
555
20 References
557
1. Pearson, J.C.; Lemons, D.; McGinnis, W. Modulating Hox gene functions during animal body
558
patterning. Nat Rev Genet2005, 6, 893–904, doi:10.1038/nrg1726.
559
2. Hatefi, Y. The mitochondrial electron transport and oxidative phosphorylation system. Annu. 560
Rev. Biochem.1985, 54, 1015–1069, doi:10.1146/annurev.bi.54.070185.005055.
561
3. Saraste, M. Oxidative Phosphorylation at the fin de siècle. Science1999, 283, 1488–1493,
562
doi:10.1126/SCIENCE.283.5407.1488.
563
4. Janeway, C.A.; Medzhitov, R. Innate immune recognition. Annu. Rev. Immunol.2002, 20,
564
197–216, doi:10.1146/annurev.immunol.20.083001.084359.
565
5. Hancock, R.E.W.; Haney, E.F.; Gill, E.E. The immunology of host defence peptides: beyond
566
antimicrobial activity. Nat. Rev. Immunol.2016, 16, 321–334, doi:10.1038/nri.2016.29.
567
6. Lumpkin, E.A.; Caterina, M.J. Mechanisms of sensory transduction in the skin. Nature2007,
568
445, 858–865, doi:10.1038/nature05662.
569
7. Yau, K.-W.; Hardie, R.C. Phototransduction motifs and variations. Cell2009, 139, 246–264,
570
doi:10.1016/j.cell.2009.09.029.
571
8. Avery, O.T. STUDIES ON THE CHEMICAL NATURE OF THE SUBSTANCE INDUCING
572
TRANSFORMATION OF PNEUMOCOCCAL TYPES: INDUCTION OF
573
TRANSFORMATION BY A DESOXYRIBONUCLEIC ACID FRACTION ISOLATED
574
FROM PNEUMOCOCCUS TYPE III. Journal of Experimental Medicine1944, 79, 137–158,
575
doi:10.1084/jem.79.2.137.
576
9. THODAY, J.M. Location of Polygenes. Nature Insight Biodiverstiy1961, 191, 368–370,
577
doi:10.1038/191368a0.
578
10. Lander, E.S.; Botstein, D. Mapping mendelian factors underlying quantitative traits using
579
RFLP linkage maps. Genetics1989, 121, 185–199.
580
11. Roff, D.A. A centennial celebration for quantitative genetics. Evolution; International Journal 581
of Organic Evolution2007, 61, 1017–1032, doi:10.1111/j.1558-5646.2007.00100.x.
582
12. Mackay, T.F.C.; Richards, S.; Stone, E.a.; Barbadilla, A.; Ayroles, J.F.; Zhu, D.; Casillas, S.;
583
Han, Y.; Magwire, M.M.; Cridland, J.M.; et al. The Drosophila melanogaster Genetic
584
Reference Panel. Nature2012, 482, 173–178, doi:10.1038/nature10811.
585
13. Linnen, C.R.; Poh, Y.-P.; Peterson, B.K.; Barrett, R.D.H.; Larson, J.G.; Jensen, J.D.;
586
Hoekstra, H.E. Adaptive Evolution of Multiple Traits Through Multiple Mutations at a Single
587
Gene. Science2013, 339, 1312–1316, doi:10.1126/science.1233213.
588
14. Hoekstra, H.E.; Hirschmann, R.J.; Bundey, R.A.; Insel, P.A.; Crossland, J.P. A single amino
589
acid mutation contributes to adaptive beach mouse color pattern. Science2006, 313, 101–104,
590
doi:10.1126/science.1126121.
591
15. Lang, M.; Murat, S.; Clark, a.G.; Gouppil, G.; Blais, C.; Matzkin, L.M.; Guittard, E.;
592
Yoshiyama-Yanagawa, T.; Kataoka, H.; Niwa, R.; et al. Mutations in the neverland Gene
593
Turned Drosophila pachea into an Obligate Specialist Species. Science2012, 337, 1658–1661,
594
doi:10.1126/science.1224829.
595
16. Weinberger, S.; Topping, M.P.; Yan, J.; Claeys, A.; Geest, N.D.; Ozbay, D.; Hassan, T.; He,
596
X.; Albert, J.T.; Hassan, B.a.; et al. Evolutionary changes in transcription factor coding
21
sequence quantitatively alter sensory organ development and function. eLife2017, 6, 598
doi:10.7554/eLife.26402.
599
17. Wang, Z.; Gerstein, M.; Snyder, M. RNA-Seq: A revolutionary tool for transcriptomics.
600
Nature reviews. Genetics2009, 10, 57–63, doi:10.1038/nrg2484.
601
18. Oppenheim, S.J.; Baker, R.H.; Simon, S.; DeSalle, R. We can’t all be supermodels: the value
602
of comparative transcriptomics to the study of non-model insects. Insect Molecular Biology 603
2015, 24, 139–154, doi:10.1111/imb.12154.
604
19. Necsulea, A.; Kaessmann, H. Evolutionary dynamics of coding and non-coding
605
transcriptomes. Nat Rev Genet2014, 15, 734–748, doi:10.1038/nrg3802.
606
20. Alvarez, M.; Schrey, A.W.; Richards, C.L. Ten years of transcriptomics in wild populations:
607
what have we learned about their ecology and evolution? Molecular Ecology2015, 24, 710–
608
725, doi:10.1111/mec.13055.
609
21. Todd, E.V.; Black, M.A.; Gemmell, N.J. The power and promise of RNA-seq in ecology and
610
evolution. Molecular Ecology2016, 25, 1224–1241, doi:10.1111/mec.13526.
611
22. Arif, S.; Kittelmann, S.; McGregor, A.P. From shavenbaby to the naked valley: trichome
612
formation as a model for evolutionary developmental biology. Evol Dev2015, 17, 120–126,
613
doi:10.1111/ede.12113.
614
23. Preger-Ben Noon, E.; Sabarís, G.; Ortiz, D.M.; Sager, J.; Liebowitz, A.; Stern, D.L.; Frankel,
615
N. Comprehensive Analysis of a cis-Regulatory Region Reveals Pleiotropy in Enhancer
616
Function. Cell Reports2018, 22, 3021–3031, doi:10.1016/j.celrep.2018.02.073.
617
24. Rebeiz, M.; POOL, J.E.; Kassner, V.a.; AQUADRO, C.F.; Carroll, S.B. Stepwise
618
modification of a modular enhancer underlies adaptation in a Drosophila population. Science 619
2009, 326, 1663–1667, doi:10.1126/science.1178357.
620
25. Gompel, N.; Prud’homme, B.; Wittkopp, P.J.; Kassner, V.a.; Carroll, S.B. Chance caught on
621
the wing: Cis-regulatory evolution and the origin of pigment patterns in Drosophila. Nature 622
2005, 433, 481–487, doi:10.1038/nature03235.
623
26. Manceau, M.; Domingues, V.S.; Mallarino, R.; Hoekstra, H.E. The developmental role of
624
Agouti in color pattern evolution. Science2011, 331, 1062–1065,
625
doi:10.1126/science.1200684.
626
27. Hoekstra, H.E. Genetics, development and evolution of adaptive pigmentation in vertebrates.
627
Heredity2006, 97, 222–234, doi:10.1038/sj.hdy.6800861.
628
28. Kratochwil, C.F.; Liang, Y.; Gerwin, J.; Woltering, J.M.; Urban, S.; Henning, F.;
Machado-629
Schiaffino, G.; Hulsey, C.D.; Meyer, A. Agouti-related peptide 2 facilitates convergent
630
evolution of stripe patterns across cichlid fish radiations. Science2018, 362, 457–460,
631
doi:10.1126/science.aao6809.
632
29. Hagen, J.F.D.; Mendes, C.C.; Tanaka, K.M.; Gaspar, P.; Kittelmann, M.; McGregor, A.P.;
633
Nunes, M.D.S. tartan underlies the evolution of male genital morphology. bioRxiv2018, 634
doi:10.1101/462259.
635
30. Nagy, O.; Nuez, I.; Savisaar, R.; Peluffo, A.E.; Yassin, A.; Lang, M.; Stern, D.L.; Matute,
636
D.R.; David, J.R.; Courtier-Orgogozo, V. Correlated Evolution of Two Copulatory Organs via
637
a Single cis-Regulatory Nucleotide Change. Current Biology2018, 28, 3450-3457.e13,
638
doi:10.1016/j.cub.2018.08.047.