2017 3rd International Conference on Artificial Intelligence and Industrial Engineering (AIIE 2017) ISBN: 978-1-60595-520-9
Research on Standard Drafting Unit Evaluation Based on Ordered
Factor Analysis Model
Jing-jing HAN, Yan WANG
*and Ding-yi LAI
Communication University of China, Chaoyang, Beijing, China, 100024 *Corresponding author
Keywords: Ordered factor analysis, Standard drafting unit, Contribution rate.
Abstract. As the growing demand of evaluating the contribution rate of the standard drafting unit scientifically, the ordered factor analysis model is proved as more effective than the normal factor model in all three dimensions. Moreover, two methods of standard drafting Unit evaluation are given in this paper.
Introduction
Standard is the conclusion of science, technology and empirical experience, which plays a significant role in the trade both between nations and within a country [1]. In order to obtain the best order within a certain range, the development of common and reusable rules for practical or potential problems, that is, the process of developing, publishing and implementing standards, is named as standardization.
However, compared with the domestic and international environmental changes and the development of the situation, the development of China's standardization has not been able to meet the demands of rapid economic and social development [2]. At present, there are a series of problems such as the irrational management system, the imperfect legal system, the imperfect standard establishment and the imperfection of the maintenance system, having a negative influence on the social and economic development effected by standardization [3].
In essence, the standard is a technical system and a public product. But owing to the limit of the ration, ability and resource of government, it is necessary to improve the standardization of common governance model, with particular emphasis on the role of society and the market play. However, the current standard evaluation system focuses on the evaluation of the standard content and applicability, regardless of research on the contribution rate of the standard drafting unit [4]. How to evaluate the contribution rate of the standard drafting unit scientifically and effectively has become one of the decisive factors for the enterprises to raise the standard of consciousness and improve the standard technical level. There are several methods of evaluation launched by the former researchers, such as Normal Factor Analysis, AHP, TOPSIS, RSR, etc. But these approaches have some feedbacks, which have a negative impact on the evaluation of standard drafting unit.
Therefore, based on the Ordered Factor Analysis Model, this study puts forward the concept of standard contribution index that measures the contribution rate of the standard drafting unit, which is very important for guiding the evaluation object to the correct direction. Suppose there are n samples. Each sample observed p indicators, which is a strong correlation between them [5,6]. The factor model is presented below:
1 11 1 12 2 1 1 1 1 2 2
m m
p p p pm m p
X a F a F a F
X a F a F a F
The paper will introduce the three dimensions of standard drafting unit evaluation respectively, and do an empirical research using a certain data to compare the new method with an old one.
Standard Drafting Unit Evaluation
Standard Category
[image:2.612.82.528.213.320.2]Different standards of different sectors of the industry, the standard drafting units for statistical analysis, should distinguish between industries [8]. The standard category usually can be divided into basic category, product category and method category in terms of the technical standards.
Table 1. The explanation of standard category.
Standard Category Explanation Quantity
Basic Category The basic standard refers to a range that is the basis of other standards and has broad guiding significance. 313
Product Category Product standard refers to the technical specifications of the product structure, specifications, qualities and inspection methods. 575
Method Category
Method Standard refers to the product performance, quality of the test, test methods for the development of the standard. The content includes the
requirements of detection or test of the category, detection rules, sampling, operating, accuracy, etc.
658
Standard Name
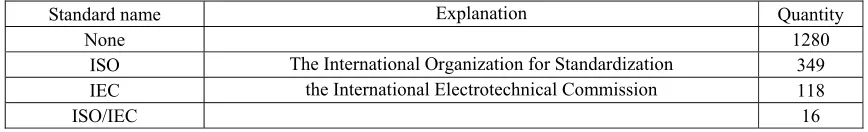
The International Organization for Standardization, the International Electrotechnical Commission and the International Telecommunication Union are responsible for coordinating voluntary and standardized procedures at the international level. These institutions are the highest-level organizations that are based on a national hierarchy. In the global standards system, it is the responsibility of the Member States of the three top organizations to ensure consistency and coherence.
Table 2. The explanation of Standard name.
Standard name Explanation Quantity
None 1280
ISO The International Organization for Standardization 349 IEC the International Electrotechnical Commission 118
ISO/IEC 16
It can be seen from the different types of different names, the standard drafting units for statistical analysis, shoulddistinguish between the names of the standard.
Degree of Adoption
IDT (Identical) is one of the degrees of adoption of international standards. It means that the national standard is the same as the technical content and text structure of the international standard, but may contain minimal editorial changes [9].
Table 3. The explanation of Degree of adoption.
Degree of adoption Explanation Quantity
None 1280
IDT Identical 249
MOD Modified 207
[image:2.612.89.523.443.509.2]Ordered Factor Analysis Model
Factor Analysis Model
Factor analysis refers to the study of statistical techniques for extracting common factors from variable populations. British psychologist C.E. Spearman is the pioneer who proposed it firstly. He found that there is a certain degree of relevance between the students’ scores of different subjects: if a student was relatively good at one subject, the performances of other subjects were normally better than that of other students. Thus, he supposed whether there are some potential common factors, or some general intellectual conditions affect the student's academic performance. Factor analysis can find hidden representative factors in many variables [10]. The variables with the same nature are integrated to one factor, which can not only reduce the number of variables but also test the hypothesis that whether there is a relationship between these variables.
The Weight of Drafting Unit Ranking
Because each national standard corresponding to a number of drafting units, the drafting unit ranking (standard first drafting unit, the second drafting unit) were weighted using factor analysis and analytic hierarchy process respectively. It is calculated in SPSS, SAS. By comparing and analyzing the result, the weight of the sort can be output.
[image:3.612.93.522.551.620.2]Original Data Processing. The original data in the following format is processed:
Table 4. The original data statistical table.
Standard Standard Drafting Unit Ranking
ID1 Unit 1 1
ID1 Unit 2 2
…… …… ……
Calculated:
Table 5. The standard drafting unit rank.
Ranking The number of standard drafting unit
1 Number 1
2 Number 2
3 Number 3
…… ……
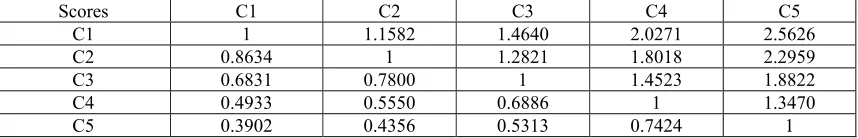
Build Matrix and Compute Weights. Construct the weight judgment matrix:
Table 6. The weight judgment matrix.
Scores C1 C2 C3 C4 C5
C1 1 1.1582 1.4640 2.0271 2.5626 C2 0.8634 1 1.2821 1.8018 2.2959 C3 0.6831 0.7800 1 1.4523 1.8822 C4 0.4933 0.5550 0.6886 1 1.3470 C5 0.3902 0.4356 0.5313 0.7424 1
A geometric mean method and standard column method are usually used to calculate the weights of judgement matrices:
1) Geometric mean method
1 1 1 n ij
i j n
ki k a W
n a
[image:4.612.94.520.139.205.2]
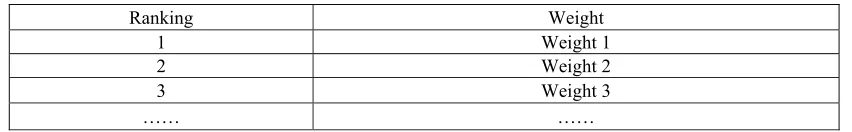
(2) Then the ordered weight can be given as the following:Table 7. The ordered weight table .
Ranking Weight
1 Weight 1
2 Weight 2
3 Weight 3
…… ……
Factor Analysis of Single Variable Dimension
Data Selection. This data selected is the detail that covers 1763 national standard published in 2016. The standard drafting units are located in the provinces and autonomous regions, which are add up to 5475 units.
Comparison between Factor Analysis and Ordered Factor Analysis in Standard Category.
KMO and Bartlett tests are passed and three eigenvalues are kept in two models. The three factors are basic category, product category and method category. But the difference is the amounts of information, which are extracted 90.617% and 91.82% respectively. Obviously, ordered factor analysis model can extract more information from data.
The weights of each factor are the variance contribution rates after being rotated. Then the comprehensive factor score can be calculated and the formula is presented respectively as following:
3
1 2
1 2 3
1 2 3 1 2 3 1 2 3
1 2 3
0.57 0.24 0.19
FAC FAC FAC FAC
FAC FAC FAC
(3)
Comparison between Factor Analysis and Ordered Factor Analysis in Standard Name.
KMO and Bartlett tests are passed and two eigenvalues are kept in two models. The two factors are none of adopting ISO and adopting ISO. But the difference is the amounts of information, which are extracted 92.704% and 94.391% respectively. Obviously, ordered factor analysis model can extract more information from data.
The weights of each factor are the variance contribution rates after being rotated. Then the comprehensive factor score can be calculated and the formula is presented respectively as following:
1 2
1 2 1 2
1 2 1 2
0.8 0.2
FAC FAC FAC FAC FAC
(4)
1 2
1 2 1 2
1 2 1 2
0.59 0.41
FAC FAC FAC FAC FAC
(5)
Comparison between Factor Analysis and Ordered Factor Analysis in Degree of Adoption.
KMO and Bartlett tests are passed and two eigenvalues are kept in two models. The two factors are adopting IDT and none of adopting ISO. But the difference is the amounts of information, which are extracted 90.003% and 91.166% respectively. Obviously, ordered factor analysis model can extract more information from data.
The weights of each factor are the variance contribution rates after being rotated. Then the comprehensive factor score can be calculated and the formula is presented respectively as following:
1 2
1 2 1 2
1 2 1 2
0.86 0.14
FAC FAC FAC FAC FAC
1 2
1 2 1 2
1 2 1 2
0.55 0.45
FAC FAC FAC FAC FAC
(7)
The Calculation of Drafting Unit Contribution Index
Based on the results of the above drafting unit weighting, the drafting units are evaluated from the number of national standards, and the evaluation index and ranking of the drafting units are given based on the factor analysis algorithm. At the same time, according to the contribution of the drafting unit, drafting unit contribution index of district, type, industry is calculated respectively.
[image:5.612.98.507.205.270.2]Based on the following data:
Table 8. The weight table of standard drafting unit.
Standard Standard Drafting Unit Ranking Weight
ID1 Unit 1 1 Weight 1
ID1 Unit 2 2 Weight 2
ID1 Unit 3 3 Weight 3
…… …… …… ……
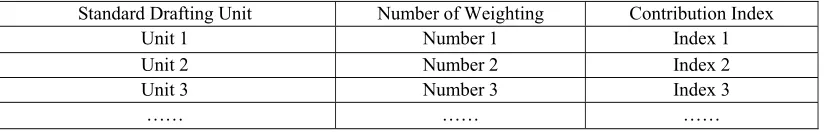
The number of weighting standards of units:
Table 9. The statistical table of weighting standards of units.
Standard Drafting Unit Number of Weighting Contribution Index
Unit 1 Number 1 Index 1
Unit 2 Number 2 Index 2
Unit 3 Number 3 Index 3
…… …… ……
Conclusion
In order to quantify the contribution of the drafting unit, two methods are proposed in this paper. One is the drafting unit contribution index, which can be calculated based on the factor analysis algorithm. Another is the factor score of the drafting unit in each standard category, which can be given in three dimensions, standard category, standard name and degree of adoption, based on the ordered factor analysis model or the factor analysis model. Through this research, the former model can extract more information than the latter.
As is shown in this paper, the ordered factor analysis model discussed above plays a significant role in the research on standard drafting unit evaluation.
Acknowledgement
This research was financially supported by the Outstanding Young Teacher Training Project of Communication University of China (YXJS201527) and Research of Key Technology in Modeling Digital Movie Service Management Intelligent Data Repository (2015-56).
References
[1] Kunxiu Ren. The Empirical Study on the Contributions, Comparison and Nature of the National Standards: the Case of Ten Countries, Journal of Shanghai Economic Management College, 13 (2015) 3-12.
[image:5.612.103.515.299.365.2][5] Multiple timescale analysis and factor analy-sis of energy ecological footprint growth in China1953-2006. Chen C.Z., Lin Z.S. Energy Policy. (2008)
[6] Huixin Ke, Hao Shen. Statistical Analysis Method in the Investigation. Communication University of China Press, pp. 193-220. (2005)
[7] Field, A. Discovering Statistics Using SPSS, 2005
[8] Klaus Backhaus. Multivariate statistical analysis methods: using SPSS tools. Shanghai People's Press, pp. 22-34. (2009)
[9] Wang Xiaoyin, Zhou Baoping. Mathematical modeling and mathematical experiment. Beijing: Science Press, pp. 33-46. (2010)