Structural Health Monitoring By Using
Damage Evaluation Techniques
Suresh Barmavath1, Srujan Gaddam2, John Mohammad M3
Assistant Professor, Department of Civil Engineering, Swarna Bharathi Institute of Science &Technology, Khammam,
Telangana,, India1& 2 .
Associate Professor, Department of Civil Engineering, Swarna Bharathi Institute of Science &Technology, Khammam,
Telangana,, India3.
ABSTRACT: Structural health monitoring is a monitoring process of damage assessment in ant structure such as bridges, culverts, tall buildings, railway lines, underground pipeline etc. damage refers to change in characteristics properties of concrete which includes cracks, spelling of concrete, member separation, and fractures. etc. Due to the overloading lack of maintenance, fire or any environmental affects which causes the failure of structure. To assess the present condition, homogeneity of concrete and critical stage of structure after occurring of any environmental or man-made calamities, damage evaluation techniques has to be adopted. Damage evaluation techniques non-destructive testing methods such as rebound hammer, half-cell potential meter, carbonation measurement and ultrasonic pulse velocity test are adopted. The data’s is collected by adopting multiple NDT methods at various locations of structure and by graphical and tabular analysis and data interpretation.. Based on the graphical and mathematical interpretation from wireless sensor methodology and NDT testing, the proper rehabilitation and repair measures adopted to the structure to strengthening the life and health of structure, in case of damage condition. These are also some implementation takes place in structure design for future point of view to avoid such damages.
KEYWORDS: Destructive Testing, Non-Destructive Testing, Rebound Hammer, Structural health monitoring, Ultrasonic pulse velocity.
I. INTRODUCTION
Structural health monitoring is estimating the state of structural health, or detecting the changes in structure that affect its performance. It is often necessary to test concrete structures after the concrete has hardened to determine whether the structure is suitable for its designed use. Ideally, such testing should be done without damaging the concrete. The tests available for testing concrete range from completely non-destructive tests, where there is no damage to the concrete, through those where the concrete surface is slightly damaged, to partially destructive tests, such as core tests and pull-out and pull-off tests, where the surface has to be repaired after the test. The range of properties that can be assessed using non-destructive tests is quite large and includes such fundamental parameters as density, elastic modulus and strength as well as surface hardness, surface absorption, reinforcement location, size and distance from the surface. Non-destructive methods like rebound hammer test and ultrasonic test do not damage buildings and allow to having an inventory of structures and conditions. Non-destructive tests are widely applied to study mechanical properties and integrity of concrete structures.
II. AIM AND NEED
Damage localization: After detecting of damage the assessment work is used to localize the damage.
Damage quantification: The quantifying and detailing work of damage is respectively done by using monitoring system. Damage prognosis: After all assessment process to do prepare forecasting report and analysing of damage is main aim of SHM (Structural Health Monitoring).
APPLICATIONS:
1. Bridges: To determine velocity and direction of wind, force values in selected region, inclination from the initial position in the vertical plane of the member axis, changes of strains in the selected points in the main span, and temperature are recorded simultaneously at specified time intervals.
2. Buildings: To better understand the behaviour of building under dynamic loads, seismic protection, and observation, in real or near real-time, of the structural response and of evolution of damage, so that it is possible to produce post-earthquake scenarios and support rescue operations, are the main advantages related to the implementation of such techniques.
III. LITERATURE REVIEW
Damage is a main cause of structural failure and often occurs on structures. In the past decades, special attention was given to avoid the sudden failure of structural components by detection damage in structures in the early state. More specifically, structural health monitoring based on the vibration of structures has been at the focus of attention of many researchers in order to obtain very efficient tools of great importance for the civil, aeronautical and mechanical engineering communities. This is why, in recent years, various developments of non-destructive techniques based on changes in the structural vibrations have been extensively published.
Sanayei et al. (2012), Amini,B and Teharani,S, (2011), Loizos,L,Papavasiliou,V, (2006), Proverbio,E and Venturi,V,( 2005), Rens,K, Nogueira,C and Transue,D, (2005). Malavar,L.J, Joshi,N.R, and Novinson,T,(2003), Pascale,G, Leo,A.D, and Bonora,V,(2003) Almir,P.F, and Protasio,F.C,(2000), Kevin rens,L, Taewan kim,(2007), Bhadauria,S.S, and Gupta,D.M.C,(2007),Amleh,L,and Mirza,M.S,(2004),Dias,P,and Jayanandana,A.D.C, (2003) ,Bruhwilwr, E, and Mivelaz,P,(1999),Yoshida,Y, and Irie,H,(2006),Dilek,U (2006).
IV. METERIALS &METHODS
In this chapter, non-destructive methodology which is applied to project for condition and damage evaluation of concrete structure has been discussed with an example.
Destructive Testing:
As the name suggests, destructive testing (DT) includes methods where your material is broken down in order to determine mechanical properties, such as strength, toughness and hardness. In practice it means, for example, finding out if the quality of a weld is good enough to withstand extreme pressure or to verify the properties of a material. Destructive testing is generally most suitable and economic for mass produced objects, as the cost of destroying a small number of pieces is negligible. The samples are put under different loads and stress. Non-destructive tests show if cracks, corrosion or other faults exist. Destructive tests in turn indicate how and when the objects are in danger of breaking down or failing.
Non-Destructive Testing:
NDT Methodology: Rebound hammer test:
Object: Schmidt rebound hammer test, used to evaluate the surface hardness of concrete. The hammer measures the rebound of a spring-loaded mass impacting against the surface of the sample. Interpretation of test results should be As per ASTM C805, BS 1881: part-202, IS 13311-part 2 1992, the strength criteria of concrete with respect to rebound number.
CORROSION MEASUREMENT TEST:
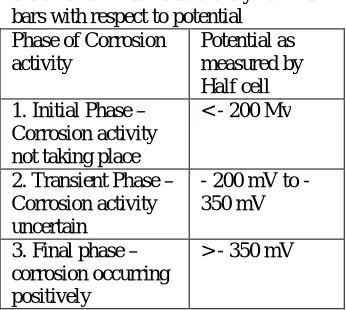
Object: This test is used to assess the corrosion conditions in a reinforced concrete structure. The method detects the likelihood of corrosion of steel but cannot indicate the rate of corrosion. By making measurements over the whole surface, a distinction can be made between corroded and non-corroded locations. Interpretation of test results should be As per ASTM C 876, the value of the potential is used as an indicator of the likelihood of the corrosion activity.
TABLES
Table 4...2: Corrosion activity of steel bars with respect to potential
Phase of Corrosion activity
Potential as measured by Half cell 1. Initial Phase –
Corrosion activity not taking place
< - 200 Mv
2. Transient Phase – Corrosion activity uncertain
- 200 mV to - 350 mV
3. Final phase – corrosion occurring positively
> - 350 mV
CARBONATION TEST:
Object: Carbonation of concrete is associated with the corrosion of steel reinforcement and with shrinkage. Carbonation of concrete in cover results in loss of protection to the steel against corrosion. The depth of carbonation can be measured by spraying the freshly fractured concrete surface with a 0.2% solution of phenolphthalein in ethanol. Since phenolphthalein is a pH indicator, the magenta (pink colour) area presents noncarbonated concrete and the remaining (colourless) portion, the carbonated area. The change in colour occurs at around pH 10 of concrete.
ULTRASONIC PULSE VELOCITY TEST:
Principle: A pulse of longitudinal vibrations is produced by an electro-acoustical transducer, which is held in contact with one surface of the concrete under test. When the pulse generated is transmitted into the concrete from the transducer using a liquid coupling material such as grease or cellulose paste, it undergoes multiple reflections at the boundaries of the different material phases within the concrete. A complex system of stress waves develops, which include both longitudinal and shear waves, and propagates through the concrete. The first waves to reach the receiving transducer are the longitudinal waves, which are converted into an electrical signal by a second transducer. Electronic timing circuits enable the transit time T of the pulse to be measured.
Longitudinal pulse velocity (in km/s or m/s) is given by: v = L/T
Where: V is the longitudinal pulse velocity, L is the path length,
Table 4.1: Strength criteria of concrete with respect to rebound number
Rebound Quality of
Number Concrete
>40 Excellent
30 to 40 Good 20 to 30 Fair
10 to 20 Poor
T is the time taken by the pulse to traverse that length.
Application: Measurement of the velocity of ultrasonic pulses of longitudinal vibrations passing through concrete may be used for the following applications:
1).Determination of the uniformity of concrete in and between members 2).Measurement of changes occurring with time in the properties of concrete 3).Correlation of pulse velocity and strength as a measure of concrete quality.
4).Determination of the modulus of elasticity and dynamic Poisson's ratio of the concrete.
Determination of pulse velocity:
Transducer arrangement: to make measurements of pulse velocity by placing the two transducers on either: A) Opposite faces (direct transmission)
B) Adjacent faces (semi-direct transmission) C) The same face (indirect or surface transmission).
1). Direct transmission:
Where possible the direct transmission arrangement should be used since the transfer of energy between transducers is at its maximum and the accuracy of velocity determination is therefore governed principally by the accuracy of the path length measurement.
1). Semi-direct transmission:
The semi-direct transmission arrangement has a sensitivity intermediate between those of the other two arrangements and, although there may be some reduction in the accuracy of measurement of the path length, it is generally found to be sufficiently accurate to take this as the distance measured from center to center of the transducer faces.
2).Indirect or surface transmission:
Indirect transmission should be used when only one face of the concrete is accessible, when the depth of a surface crack is to be determined or when the quality of the surface concrete relative to the overall quality is of interest. It is the least sensitive of the arrangements and, for a given path length, produces at the receiving transducer a signal which has an amplitude of only about 2% or 3% of that produced by direct transmission.
Detection of defects:
Estimating the thickness of a layer of inferior quality concrete:
If concrete is suspected of having a surface layer of poor quality because of poor manufacture, or damage by fire, frost or sulphate attack, the thickness of the layer can be estimated from ultrasonic measurements of transit times along the surface. The technique used is to place the transmitting transducer on the surface and the receiving transducer a distance “x1” from the transmitting transducer. The transit time is measured and then measured again at distances of “x2”, “x3”, etc.
Determination of changes in concrete properties and strength:
Velocity criteria for concrete quality grading:
Pulse velocity (m/s)ss General concrete condition
4575 …. …. …. Excellent 3660-4575 …. …. …. Good 3050-3660 …. …. …. Questionable 2135-3050 …. …. …. Poor
2135 …. …. …. Very poor
4).Determination of the modulus of elasticity and dynamic Poisson’s ratio:
The relationship between these elastic constants and the velocity of an ultrasonic pulse travelling in an isotropic elastic medium of infinite dimensions is given below:
Ed = (ρ υ*υ (1+υ)(1-2υ)) /(1-υ)
Where;
Ed is the dynamic elastic modulus (in MN/m2),
υ is the dynamic Poisson's ratio, ρ is the density (in kg/m3),
v is the pulse velocity (in km/s).
V. RESULT AND ANALYSIS
WORK DETAILS:
The different damage evaluation techniques have been adopted for assessment of concrete strength and condition of culvert which is located at khammam, rural area.
The reason behind selecting of culvert is to check the nature and uniformity of moderate quality concrete which is used in the culvert and other reason is live loading which is acting on culvert.
WORK LOCATION:
Culvert location:8 kms apart from Khammam railway station, towards Wyra road, Gopalapuram, Khammam urban.
Type: RC box culvert
Length: 11.89 meters
Size:3 * 2.89 meters
Number of section: 3
REBOUND HAMMER TEST:
DATA COLLECTED & ANALYSIS OF DATA:
As per IS 13311-1992 part 2, the quality criteria of concrete by using Rebound hammer is:
Thus this method can be used with greater confidence for differentiating between the questionable and acceptable parts of a structure or for relative comparison between two different structures.
The test is classified as a hardness test and is based on the principle that the rebound of an elastic mass depends on the hardness of the surface against which the mass impinges. The energy absorbed by the concrete is related to its strength. Despite its apparent simplicity, the rebound hammer test involves complex problems of impact and the associated stress-wave propagation. The results obtained are only representative of the outer concrete layer with a thickness of 30–50 mm.
HALF-CELL POTENTIAL METER:
DATA COLLECTED & ANALYSIS OF DATA:
of the steel except under certain specific conditions. Thus data recorded in above table of half-cell potential shows the corrosion rate of steel bars are very less for almost all members and low corrosion for few members of RC culvert.
CARBONATION TEST: 4.4.1 DATA COLLECTED: 4.4.2 ANALYSIS OF DATA:
Carbonation affects various properties of hardened concrete. Primarily, the protection of the reinforcing steel against corrosion decreases, which is originally guaranteed by the highly alkaline pore solution of the cement paste. Climatic conditions leading to the highest rate of carbonation are not identical with those which accelerate corrosion of steel. Other concrete properties, such as strength, permeability, and resistance to some chemical and physical attacks, as well as shrinkage, are also affected by carbonation. This recommendation is aimed at improving the comparability of carbonation tests.
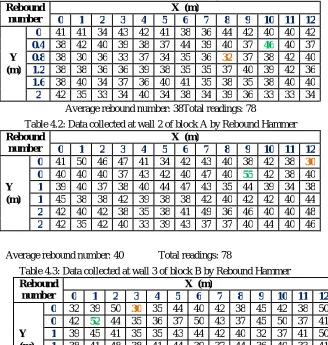
Table 4.3: Data collected at wall 3 of block B by Rebound Hammer
Rebound number
X (m)
0 1 2 3 4 5 6 7 8 9 10 11 12
0 32 39 50 30 35 44 40 42 38 45 42 38 50
0 42 52 44 35 36 37 50 43 37 45 50 37 41
Y 1 39 45 41 35 35 43 44 42 40 32 37 41 50
(m) 1 38 41 48 38 41 44 39 37 44 36 40 33 41 2 48 38 39 38 39 36 38 40 34 37 38 42 37 2 38 42 34 42 40 37 34 47 43 38 35 38 38 Average rebound number: 40 Total readings: 78
Table 4.1: Data collected at wall 1 of block A by Rebound hammer
Rebound number
X (m)
0 1 2 3 4 5 6 7 8 9 10 11 12
0 41 41 34 43 42 41 38 36 44 42 40 40 42 0.4 38 42 40 39 38 37 44 39 40 37 46 40 37
Y 0.8 38 30 36 33 37 34 35 36 32 37 38 42 40
(m) 1.2 38 38 36 36 39 38 35 35 37 40 39 42 36 1.6 38 40 34 37 36 40 41 35 38 35 38 40 40 2 42 35 33 34 40 34 38 34 39 36 33 33 34
Average rebound number: 38Total readings: 78
Table 4.2: Data collected at wall 2 of block A by Rebound Hammer
Rebound number
X (m)
0 1 2 3 4 5 6 7 8 9 10 11 12
0 41 50 46 47 41 34 42 43 40 38 42 38 30 0 40 40 40 37 43 42 40 47 40 55 42 38 40
Y 1 39 40 37 38 40 44 47 43 35 44 39 34 38
(m) 1 45 38 38 42 39 38 38 42 40 42 42 40 44 2 42 40 42 38 35 38 41 49 36 46 40 40 48 2 42 35 42 40 33 39 43 37 37 40 44 40 46
Table 4.4: Data collected at wall 4 of block B by Rebound Hammer
Rebound number
X (m)
0 1 2 3 4 5 6 7 8 9 10 11 12
0 36 40 42 38 38 38 33 40 36 32 38 42 44
0 40 41 35 35 40 35 42 44 34 38 41 44 40
Y 0 43 42 45 40 38 33 34 32 37 35 49 33 40
(m) 1 34 32 42 40 37 38 40 37 36 40 42 42 42 1 32 32 38 40 36 36 38 45 30 41 43 35 39 1 38 45 36 36 40 36 36 37 35 35 42 37 33
Average rebound number: 38 Total readings: 78
Table 4.5: Data collected at wall 5 of block C by Rebound Hammer
Rebound number
X (m)
0 1 2 3 4 5 6 7 8 9 10 11 12
0 35 37 38 34 39 36 41 38 31 34 36 33 40
0 38 36 38 35 36 35 37 33 34 28 35 41 48
Y 0 38 34 40 42 36 32 33 39 34 35 42 35 48
(m) 1 35 33 40 35 37 34 31 36 37 39 39 33 40 1 32 41 38 37 37 36 28 35 39 37 41 36 35 1 33 35 35 37 40 39 37 37 32 41 34 44 42 Average rebound number: 37 Total readings: 78
Table 4.6: Data collected at wall 6 of block C by Rebound Hammer
Rebound number
X (m)
0 1 2 3 4 5 6 7 8 9 10 11 12
0 42 32 31 33 41 35 42 40 42 38 39 43 40 0 45 36 35 42 38 41 38 43 39 37 37 37 40
Y 0 47 36 38 41 43 41 36 46 36 38 36 30 38
(m) 1 41 37 40 36 38 44 50 41 35 39 35 34 32 1 44 39 32 38 44 35 45 40 32 26 41 30 30 1 38 32 32 41 50 33 39 40 32 35 29 38 40
Average rebound number: 38 Total readings: 78
Table 4.7: Data collected at slab 1 of block A by Rebound Hammer
Rebound number
X (m)
0 1 2 3 4 5 6 7 8 9 10 11 12
0 41 49 43 44 49 42 52 51 50 47 45 54 49
0 50 44 46 48 47 54 53 56 50 50 40 42 50
Y 1 38 43 42 48 45 50 50 48 48 43 48 48 55
(m) 1 49 48 42 49 49 46 48 54 52 48 45 45 44 2 46 48 44 51 53 56 58 51 52 50 40 52 55 2 48 41 51 49 54 57 52 46 52 51 52 52 56
Average rebound number:48 Total readings: 78
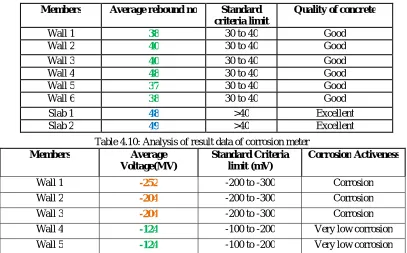
Table 4.10: Analysis of result data of corrosion meter
Members Average
Voltage(MV)
Standard Criteria limit (mV)
Corrosion Activeness
Wall 1 -252 -200 to -300 Corrosion
Wall 2 -204 -200 to -300 Corrosion
Wall 3 -204 -200 to -300 Corrosion
Wall 4 -124 -100 to -200 Very low corrosion
Wall 5 -124 -100 to -200 Very low corrosion Table 4.8: Data collected at slab 2 of block B by Rebound Hammer
Rebound number
X (m)
0 1 2 3 4 5 6 7 8 9 10 11 12
0 45 49 46 49 50 53 48 49 53 44 46 44 46
0 49 54 45 48 48 54 48 52 46 55 53 54 41
Y 1 55 56 52 50 46 56 50 51 48 54 52 49 47
(m) 1 54 54 54 55 54 60 49 48 54 56 51 51 49 2 55 49 58 52 55 54 48 52 56 52 50 55 50 2 54 57 52 48 52 56 56 52 54 55 44 55 50
Table 4.9: Analysis of result data of Rebound Hammer
Members Average rebound no Standard criteria limit
Quality of concrete
Wall 1 38 30 to 40 Good
Wall 2 40 30 to 40 Good
Wall 3 40 30 to 40 Good
Wall 4 48 30 to 40 Good
Wall 5 37 30 to 40 Good
Wall 6 38 30 to 40 Good
Slab 1 48 >40 Excellent
Wall 6 -101 -100 to -200 Very low corrosion Slab 1 -189 -100 to -200 Very low corrosion Slab 2 -189 -100 to -200 Very low corrosion
In this Table 4.7 and 4.8 represents the values of rebound hammer slab1, 2 of block A and B of highest and lowest rebound number values. It has shown that for block A 58, 38 and for block B 60, 41.with this results shown that the values of rebound hammer is within the standard criteria limits. And all so table 4.10 corrosion meter values represent the half-cell potential average values of wall 1,2 and 3 is corrosion and wall 4,5,6 and slab 1, 2 are shown very low corrosion.
VI. CONCLUSION
In the previous chapter, discussion of result of all the damage evaluation techniques which adopted was discussed. In this chapter the conclusion drawn from experiment method or evaluation techniques is presented. The result obtained from analysis was compared with standard specification of Indian code provision. Considerable engineering judgment is needed to properly evaluate a measurement. Misinterpretation is possible when poor contact is made. For example, in some cases it may not be possible to identify severely corroded reinforcing bar in poor quality concrete. However, it is possible to identify poor quality concrete which could be the cause of reinforcing bar problems. The poor quality concrete allows the ingress of moisture and oxygen to the reinforcing bars, and hence corrosion occurs. Attempts have been done to relate rebound number, half-cell potential and carbonation analysis to assess concrete strength and uniformity.
The Schmidt hammer provides an inexpensive, simple and quick method of obtaining an indication of concrete strength, but accuracy of ±15 to ±20 per cent is possible only for specimens cast cured and tested under specific conditions. The potential measurements by using half-cell potential meter have been interpreted by using specific Indian code provision in the fields of concrete materials and corrosion testing. It is often necessary to use other data such as chloride contents, depth of carbonation, delimitation survey findings, rate of corrosion results, and environmental exposure conditions, in addition to half-cell potential measurements, to formulate conclusions concerning corrosion activity of embedded steel and its probable effect on the service life of a structure.
In structure constructed with poor quality concrete and exposed to the marine atmospheric zone, carbonation can play a signifiacant role in the deterioration process as shown in an inspection of RC culvert structure. However, the experiment result obtained in this study of carboantion is shows that the rate of carbonation in medium and high quality concrete is much less than the carbonation rate in any exposure zone of the marine environment. Thus the need of use high quality concrete and optimum reinforcement cover to protect strucutre from effect of carbonation and corrosion.
REFERENCES
[1] Sanayei et al. (2012) Instrumentation, Nondestructive Testing, and finite-Element Model updating for bridge evaluation using strain
measurements, Journal of Bridge Engineering 17(1): 130-138.
[2] Amini,B and Teharani,S, (2011). “Combined Effects of saltwater and water flow on Deterioration of concrete under Freeze-Thaw
Cycles.”Journal of cold Regions Engineering 25(4),145-161.
[3] Loizos,L,Papavasiliou,V, (2006),Evaluation of Foamed Asphalt Cold In-Place Pavement Recycling Using Nondestrctive Techniques. Journal
of Transporation Engineering 132:12(970)
[4] Proverbio,E and Venturi,V,( 2005) ”Reliability of nondestructive tests for on site concrete strength assessment,”10DBMC,Lyon, France,
[5] Rens,K, Nogueira,C and Transue,D, (2005).”Bridge Management and Nondestructive Evaluation.”Journal of performance of constructed
facilities,19:1(3), 3-16.
[6] Malavar,L.J, Joshi,N.R, and Novinson,T,(2003) “Enviromental effects on the short term bond of carbon fibre reinforced (CRPF) Composites,”
journal of composites for construction,7(1),58-63.
[7] Pascale,G, Leo,A.D, and Bonora,V,(2003) ”Nondestructive assessment of the actual compressive strength of high-strength concrete.”Journal
of materials in civil Engineering.15(5) 452-459.
[9] Kevin rens,L, Taewan kim,(2007)“Inspection of Quebec Street Bridge in Denver, Colorado: Destructive and Nondestructive Testing,” Journal of Performance of Constructed Facilities 21:3(215).
[10] Bhadauria,S.S, and Gupta,D.M.C,(2007) “In situ performance testing of deteriorating water tanks for durability assessment.” Journal of
performance of Constructed Facilities, 21(3) 234-239.
[11] Amleh,L,and Mirza,M.S,(2004)”corrosion response of a decommissioned deteriorated bridge deck,” Journal of performance of constructed
facilities,18(4) 185-194.
[12] Dias,P, and Jayanandana,A.D.C,(2003)”Condition Assessment of a Deteriorated Cement Works,” Journal of performance of Constructed
Facilities,17(4) 188.
[13] Bruhwilwr,E, and Mivelaz,P,(1999)”Form Corrosion of existing to durability of new concrete structures,” in proceeding of the International
Association for Bridge and structural Engineering Symposium(IABSE 99),Rio de Janeiro,Brazil.
[14] Sharma,S, and Mukherjee,A, (2011).”Monitoring corrosion in Oxide and Chloride Environments Using Ultrasonic Guided Waves.” Journal of
Materials in Civil Engineering. 207-211.
[15] Terzic,A and Pavlovic,L, (2010)”Application of results of Nondestructive Testing Methods in the Investigation of Microstructure of
Refractory concretes.” Journal of Materials in Civil Engineering.853-857.
[16] Shah,A, and Hirose,S,(2010).”Nonlinear Ultrasonic Investigation of Concrete Damaged under Uniaxial Compression Step Loading,” Journal
of Materials in Civil Engineering 476-484.
[17] Ervin,B.L, Kuchama,D.A, Bernhard,J.T, and Reis,H,(2009)”Monitoring corrosion of rebar embedded in mortar using high frequency guided
ultrasonic waves.” Journal of Engineering Mechanics,135(1) 9-18.
[18] Stergiopoulou,C, Aggour,M.S, and McCuen,R.H,(2008) ”nondesttuctive tesing and evaluation of concrete packing garages,” Journal of
Infrastructure System.14(4) 319-326.
[19] Yoshida,Y, and Irie,H,(2006)”NDT for concrete using the ultrasonic method,” in Proceeding of the 12th Asia Pacific Conference of Non
Destructive Testing (A-PCNDT 06), Auckland, New Zealand.
[20] Dilek,U (2006)” Nondestructive and Laboratory evaluation of damage gradients in concrete structure exposed to cryogenic temperatures.”