Genetic Variability at Neutral Markers, Quantitative Trait Loci and Trait
in a Subdivided Population Under Selection
Vale´rie Le Corre*
,1and Antoine Kremer
†*UMR Biologie et Gestion des Adventices, INRA, BP 86510, 21065 Dijon Cedex, France and†UMR Biodiversite´ Ge`nes et Ecosyste`mes,
INRA, 33612 Cestas Cedex, France
Manuscript received October 31, 2002 Accepted for publication March 26, 2003
ABSTRACT
Genetic variability in a subdivided population under stabilizing and diversifying selection was investigated at three levels: neutral markers, QTL coding for a trait, and the trait itself. A quantitative model with additive effects was used to link genotypes to phenotypes. No physical linkage was introduced. Using an analytical approach, we compared the diversity within deme (HS) and the differentiation (FST) at the QTL with the genetic variance within deme (VW) and the differentiation (QST) for the trait. The difference betweenFSTandQSTwas shown to depend on the relative amounts of covariance between QTL within and between demes. Simulations were used to study the effect of selection intensity, variance of optima among demes, and migration rate for an allogamous and predominantly selfing species. Contrasting dynamics of the genetic variability at markers, QTL, and trait were observed as a function of the level of gene flow and diversifying selection. The highest discrepancy among the three levels occurred under highly diversifying selection and high gene flow. Furthermore, diversifying selection might cause substantial heterogeneity among QTL, only a few of them showing allelic differentiation, while the others behave as neutral markers.
A
S concern for conserving and managing natural pop- also covariances introduced by disequilibria among loci (McKay and Latta 2002). As considerable progress ulations in the face of environmental changes hashas now been made toward identifying quantitative trait increased, it is of urgent need to assess whether the most
loci (QTL) or candidate genes responsible for trait varia-widely used method for describing genetic variability
tion, studies of the allelic variation underlying quantita-within and among populations,e.g., molecular genetic
tive variation in natural populations should become markers, does provide information about genetic
variabil-more common (Barton and Keightley 2002). The ity at adaptive traits. Several recent experimental studies
objective of this article is to evaluate the impact of the (reviewed inButlinandTregenza1998;Lynchet al.
contrasting properties of genetic markers and quantita-1999;McKayandLatta 2002) and two meta-analyses
tive traits on the structure of their genetic diversity. We (Merila¨ and Crnokrak 2001; Reed and Frankham
compare the level and distribution of genetic diversity 2001) have demonstrated that there is no, or only weak,
at (i) neutral genetic markers, (ii) the QTL contributing correlation between the two measures. In the case of
to an adaptive trait, and (iii) the adaptive trait per se. outcrossing species, surveys conducted with molecular
This can be seen as an attempt to bridge the gap between markers indicate that most of the variation resides
population and quantitative genetics. Comparative anal-within population whereas much higher population
dif-yses of genetic diversity at different integrative levels of ferentiation occurs for complex traits. A striking
exam-the same trait have only seldom been addressed (Latta ple illustrating this pattern is given by tropical and
tem-1998;Bostet al.1999;Kremeret al.2000). By applying perate forest trees (Wright 1976; Adams et al. 1992;
the classical model of quantitative genetics in simulation Morgenstern1996). This discrepancy has traditionally
studies,Latta(1998) andKremeret al.(2000) showed been interpreted as the consequence of different
evolu-that population differentiation is in most cases expected tionary forces acting on the different classes of traits
to be different at these different levels. Our investiga-(ButlinandTregenza1998). In addition to their
dif-tions extend this approach in two additional direcdif-tions. ferent modes of evolution, the two classes of traits differ
First, we compare both within-deme variability and be-in their structure. Gene markers are usually analyzed
tween-deme differentiation and estimate the impact of as single-locus traits, even though multiple loci are
inves-disequilibria on these two parameters. As shown by tigated. However, quantitative traits are controlled by
Kremer et al. (1997), the larger the disparity between multiple loci and quantitative genetic variation includes
within- and between-deme disequilibria, the higher the disparity between differentiation at multilocus and sin-gle-locus traits. Second, we address the variation from 1Corresponding author: UMR Biologie et Gestion des Adventices,
locus to locus.
INRA, BP 86510, 21065 Dijon Cedex, France.
E-mail: [email protected] Our investigations will help determine whether the
use of QTL can complement or even replace phenotypic tionQSTis equal to the allelic differentiationFST (Whit-lock1999). No simple general relationships exists, how-evaluation involving complex crossing schemes or
com-ever, that relates the within-deme component of variance mon garden experiments. This approach implies
identi-VW to the within-deme diversityHS(Foley1992). fying the more important genes from QTL detection
As selection creates gametic disequilibrium among studies and functional genomic data and then
identi-loci, the value ofQSTno longer equals that ofFST (Whit-fying within each gene the sequence polymorphisms
lock 1999). Two distinct components of genetic vari-that affect the phenotype (quantitative trait nucleotides,
ance have to be considered: first, the contribution of QTN). While this requires a great investment and is still
allelic variation at each locus or genic variance and out of reach in many species, it is already possible, using
second, the covariance of allelic effects among loci. Con-in silicosimulations, to test whether describing the
un-sidering first-order gametic disequilibrium only, derlying allelic frequencies is sufficient to describe the
distribution of genetic variability of an adaptive trait.
V⫽
兺
i2i ⫹兺
i兺
j⬆iCovij, We have reassembled earlier work on multilocus systems(Latta 1998;Kremeret al. 2000) to provide approxi- where2
i is the genic variance at locusiand Covijis the covariance between locusiand locusj. Following Gavri-mate relationships between diversity and differentiation
letsandHastings(1995), we introduced the parame-at a trait and parame-at its underlying loci. In a second step,
ter ⫽兺i兺j⬆iCovij/兺i2i to simplify the previous expres-we have considered the effects of various evolutionary
sion to scenarios generated by simulations. The evolution of
genetic parameters for a trait, its QTL, and neutral
V⫽(1 ⫹ )
兺
i2i. (1) markers was modeled in a subdivided populationunder-going different selection pressures. We have focused on represents the part of the trait’s variance due to the the impact of selection within and between demes and effects of allelic associations among QTL, relative to the compared simulations of outcrossingvs.predominantly part of the variance due to individual allelic effects at self-fertilizing species with varying levels of gene flow each QTL. Hencecan be interpreted as a measure of
among demes. disequilibrium of allelic effects among QTL, in contrast
to disequilibrium measuring association of allelic states (Kremeret al. 1997). As shown byGavriletsand Has-tings (1995) for a population under stabilizing selec-ANALYTIC DERIVATIONS
tion, is approximately constant and, if loci are un-We considered a quantitative trait determined by n linked, depends only on the intensity of selection. loci (QTL) acting additively, so that the genetic value Most of the difficulties linked with the analytical treat-of any individual was the sum over loci treat-of the effects treat-of ment of selection on a multilocus trait in a subdivided the two parental alleles at each locus. All QTL had the population arise from the presence of genetic covari-same variance in allelic effects␣2and the same mutation
ances among loci, at both the within- and the between-rate. There was no physical linkage among QTL. We deme level. The multiallelic model is untractable analyt-then considered a set ofdidentical demes of constant ically and was analyzed using simulations (seecomputer sizeN. Migration occurred at a ratemand was supposed simulationsbelow), but some analytical results could to be conservative, as in the island and stepping-stone be derived for a diallelic model. We considerednloci, models (Whitlock1999). each with two alleles having symmetrical additive ge-netic effects⫺a/2 and⫹a/2 (FalconerandMackay The total allelic diversity at QTL was separated
ac-1996). The within- and between-deme components of cording toNei (1987) into the within-deme expected
the genic variance at each locusihave the relationship diversity HS and the between-deme expected diversity
DST. The allelic differentiation among demes was mea- 2
Wi⫽ (1⫹FISi)(1⫺FSTi)20i sured by GST ⫽ DST/(HS ⫹ DST). For diallelic loci, GST
2
Bi⫽ 2FSTi20i (2)
measures the fixation indexFSTas defined byWright (1951). In the text we useFSTfor diallelic loci andGST
(Wright1951;Lande1992), where2
0iis the variance for multiallelic loci. The total amount of genetic
vari-expected at locusiin a single panmictic population with ance for the trait was separated into its within-deme
the same allele frequencies as the subdivided population componentVWand its between-deme componentVB. A
(Latta1998;Whitlock1999). measure of differentiation for the trait analogous to the
The diallelic model has the convenient property that, differentiation for allelic frequencies is
at each locus i, the genic variance is proportional to the expected genetic diversity (FalconerandMackay QST⫽VB(1⫹FIS)/[VB(1⫹FIS)⫹2VW]
1996, Equation 8.5), so that
(Prout andBarker 1989;Spitze 1993; Bonninet al. 2
0i⫽ a2HTi, 1996), whereFISis the within-deme inbreeding
coeffi-cient as defined byWright(1951). which, by replacing into (2), leads to
2
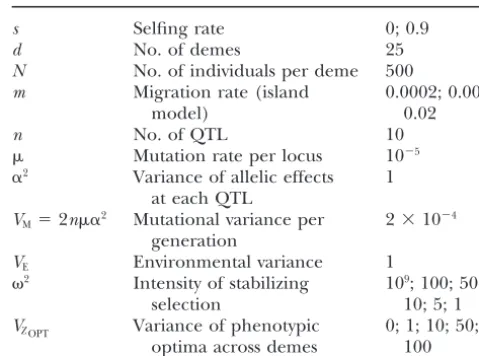
differentia-TABLE 1
2
Bi⫽2a2DSTi. (3)
A summary of simulation parameters used and their values If inbreeding is due only to the properties of the mating
system, theFISivalues have the same expectation,F, at
s Selfing rate 0; 0.9
each locus. Thus for a trait controlled by n loci, the
d No. of demes 25
within (VW) and between (VB) variance of the trait can N No. of individuals per deme 500
be obtained after summing genic variances over loci: m Migration rate (island 0.0002; 0.002;
model) 0.02
VW ⫽na2(1⫹ W)(1⫹ F)HS
n No. of QTL 10
Mutation rate per locus 10⫺5
VB⫽ 2na2(1⫹ B)DST. (4)
␣2 Variance of allelic effects 1 These results lead to the following relationship between at each QTL
VM⫽2n␣2 Mutational variance per 2⫻10⫺4
QSTandFST:
generation
QST⫽VB(1⫹ F)/(VB(1⫹ F)⫹2VW) VE Environmental variance 1
2 Intensity of stabilizing 109; 100; 50;
⫽(1⫹ B)FST/[(B⫺ W)FST⫹1⫹ W]. (5) selection 10; 5; 1
VZOPT Variance of phenotypic 0; 1; 10; 50; Under the diallelic model, the differentiation for the
optima across demes 100 selected traitQSTwill therefore take the same value as
the allelic differentiationFSTat QTL in two cases:
1. There is linkage equilibrium among QTL (Rogersand
population of a diploid species under natural selection. Harpending1983; Latta 1998) at the within-deme
The simulation model can be divided into three parts. level and at the between-deme level (B⫽ W⫽0).
The genetic model: The phenotypic value of a given 2. Linkage disequilibrium among QTL contributes
genotype was the sum of independent genetic and envi-equally to the within- and between-deme variances
ronmental contributions,Y ⫽ G ⫹ E, where E had a for the trait (B⫽ W).
Gaussian distribution with mean zero and variance set Consequently,QSTis equal toFSTnot only for a neutral to 1. The genetic valueGwas determined by summing phenotypic trait, but also for traits under selection and the allelic effects over all QTL. In this study (Table 1) for which the disequilibrium among QTL is of the same we considered 10 independent QTL with allelic effects amount at the within- and between-deme levels.QSTwill drawn at random from a Gaussian distribution with be greater than FSTif between-deme disequilibrium is mean zero and variance 1. The mutation rate was set dominant, which is expected when diversifying selection to 10⫺5for each QTL. Ten additional loci with no effect drives demes to different phenotypic optima.QST will on the trait and unlinked to each other and to the QTL be smaller thanFSTif within-deme disequilibrium is dom- served as neutral genetic markers.
inant, which is expected under uniform selection, or The population model: We considered 25 demes each when genetic drift or selection intensity is high (Kremer of size 500, connected according to an island migration et al. 2000). The build-up of negative covariance within model. The number of migrants per generation, Nm, a population subjected to stabilizing selection is well took the value 0.1, 1, or 10. The mating system was set known as the Bulmer effect and has been described to either complete allogamy or predominant selfing analytically.Bulmer(1974, 1989) considered ann-locus, (selfing rate⫽0.9).
continuum-of-alleles model and derived an approxi- Simulation of natural selection:At the within-deme level, mation under weak selection, whereasGavriletsand stabilizing Gaussian selection toward a local optimum Hastings(1994) derived exact equations for the value ZOPT(k) for demekdetermined the relationship between ofWin a two-locus, diallelic model. The occurrence of individual phenotypic values and fitness (Turelli1984): between-deme covariance in a subdivided population
Wk(Z)⫽exp[⫺(Z⫺ZOPT(k))2/22]. subjected to stabilizing and diversifying selection has
been demonstrated byLatta(1998) using simulations, The selection intensity2was set to vary from 1 to 100. but to our knowledge has never been investigated theo- In the absence of selection, the variance within deme retically. In the following, we present results from com- under an island model is 2NdVM (Whitlock 1999), puter simulations that describe in more detail the effects which, after replacing with our parameter values (Table of stabilizing selection on covariance at both the within- 1), givesVW⫽5. Therefore, values of2⬍5 are strong and the between-deme levels. selection pressures, while a value of 100 is a weak selec-tion pressure. Furthermore, a compilaselec-tion and compari-son of experimental data with mutation-selection mod-COMPUTER SIMULATIONS
els has shown that for most traits2/V
Efalls between 5 and 50 (Roff1997).
The simulation model and simulation procedures:We
phenotypic optimumZOPT(k) for each demek. The di- The variance of phenotypic optima had also an effect on the extent of within-deme covariance, but less impor-versifying action of selection was scaled by VZOPT, the
variance of ZOPT(k) over demes. In this study, ZOPT(k) tant. When selection was highly diversifying (largeVZOPT), there was on average less negative covariance. This was varied according to a one-dimensional linear gradient
on a grid of 5 ⫻ 5 demes by taking values ⫺x, ⫺x/2, because demes located at both ends of the gradient of phenotypic optima were selected toward extreme values, 0,x/2,x, so thatVZOPT⫽x2/2. The linear gradient was
adopted for simplicity. As migration followed an island leading to a large reduction in variance and thus in the amount of covariance within them. As expected, under pre-model, this had no effect on the genetic structure of
the subdivided population. Five different values were dominant selfing (10% allogamy), much larger amounts of negative linkage disequilibrium were maintained at chosen for ZOPT(k) in order to have an equal number
of demes for each value. VZOPTwas set to vary between the within-deme level, as recombination was then less effective. Under very strong selection (2 ⱕ 5), values 0 (uniform selection) and 10 (diversifying selection).
In the absence of selection, the between-deme variance of W were close to ⫺1, indicating that nearly all the within-deme genic variance was absorbed by negative under an island model is (d⫺1)VM/m(Whitlock1999;
McKay andLatta 2002), which, after replacing with covariance among loci.
The extent of between-deme covariance depended our parameter values (Table 1), givesVB⫽ 24, 2.4, or
0.24, forNm⫽0.1, 1, or 10, respectively. ForNm⫽0.1, primarily onVZOPT(Figure 1). Theory predicts that posi-tive covariance is generated at the between-deme level the between-deme variance expected in the simulations
due to drift thus always exceeded the between-deme when VZOPT is much larger than the neutral between-deme variance and that negative covariance is generated variance expected due to selection (VZOPT, set to be at
most 10). This was designed to model species with low whenVZOPTis much smaller than this variance (Latta 1998). The expected neutral variance between demes, gene flow, for which a similar high level of
differentia-tion is observed at both neutral markers and traits 24, 2.4, or 0.24, forNm⫽0.1, 1, or 10, provided reliable estimates of threshold values of VZOPT when selection (Hendry2003). By contrast, forNm⫽10, the
between-deme variance expected due to drift was less than the was weak, in which case the phenotypic differentiation among demes to matchVZOPTwas due mainly to between-between-deme variance expected due to selection for
most simulated selection schemes. This was designed to deme covariance (Figure 1). However, when selection was strong, it also modified allele frequencies at QTL, model high gene flow species such as forest trees
(McKay and Latta 2002). Simulations with Nm ⫽ 1 so that the between-deme genic variance increased and response to diversifying selection could be achieved with represented an intermediate case.
The starting point of each simulation was a popula- less positive covariance or even negative disequilibrium between demes, as can be seen from Figure 1, especially tion of 12,500 individuals homozygous at each locus.
This population underwent random mating during forNm⫽10. Similar patterns were observed for 100% allogamy and 10% allogamy.
100,000 generations, during which new alleles were
cre-ated by mutation and mutation-drift equilibrium was Figure 1 shows that, whatever the selfing rate, the disparity between covariance among QTL at the within-reached. Twenty-five demes were generated by sampling
at random without replacement from this base popula- and between-deme levels is maximal in the following two circumstances: first, weak uniform selection on a tion and evolved during 3000 generations under
differ-ent evolutionary scenarios. Twdiffer-enty-five differdiffer-ent selec- species having a low migration rate (thenBⰆ W) and second, weak but highly diversifying selection on a spe-tion patterns were considered, corresponding to the
combination of five levels of diversifying selection and cies having a high migration rate (thenB Ⰷ W). Comparison of simulation results with predictions of five levels of selection intensities (see Table 1). In
addi-tion, a neutral scenario was also considered by setting the diallelic model:From Equation 4 above, the genetic variance within deme is a function of the allelic diversity
2 to 109 (Table 1). These 26 selection patterns were
simulated for each combination of the number of mi- HS at QTL, weighted by the term 1 ⫹ W, where W represents the covariance among QTL. Figure 2 shows grants per generation and the selfing rate, thus
generat-ing 156 different scenarios. Within each scenario, 10 simulation values for the within-deme variance for the trait as a function of the within-deme allelic diversity at replicated simulations were run. In what follows, we
compare the values of diversity and differentiation that QTL across the 25 selection patterns. An approximately linear relationship was observed on a log-log scale. This were reached after 3000 generations.
Effects of selection parameters on genetic covariance was in agreement with Equation 4 and with the parallel variation inWandHS as a function of the intensity of among QTL: The extent of genetic covariance at the
within-deme level, as measured by the parameter W, selection (Figures 1 and 5). The slope of the linear relationship between VW and HS did not vary with the depended primarily on the intensity of selection (Figure
1). Under complete allogamy, no or low linkage disequi- migration rate.
Figure 3 shows simulation and expected values of librium was maintained at the within-deme level, except
when selection intensity was strong, i.e., when 2 ⬍ 5. Q
Figure 1.—The effect of variance of phenotypic optima (VZOPT) and intensity of stabilizing selection (
2) on the genetic
covariance among QTL at the (䊊) within- and (䊉) between-deme levels,W and B. On each graph, the different subplots correspond to varying degrees of diversifying selection among demes, from uniform (VZOPT⫽0) on the left to highly diversifying (VZOPT ⫽10) on the right. Within each subplot, thex-axis represents the intensity of selection within deme, from weak (
2⫽
100) on the left to strong (2⫽1) on the right.
values were derived from the diallelic model according tested,QSTwas greater thanGSTat the QTL when covari-ance for the trait was higher at the between-deme level to Equation 5. They were calculated from observed
val-ues ofGSTat the QTL andBandWvalues. The diallelic than at the within-deme level (Figure 4, solid symbols). Comparison of within-deme genetic variability at neu-model underestimatedQSTvalues for most selection
pat-terns. One explanation for the lack of adequacy of the tral markers, QTL, and trait across different selection patterns: Figure 5 shows the genetic variability at the diallelic model may come from the fact that we
consid-ered first-order gametic disequilibrium only, whereas within-deme level, measured either by allelic diversity HSat markers (neutral or QTL) or by the heritabilityh2 gametic disequilibria of higher orders may also be
pres-ent and will be all the more important as more alleles for the trait, for the different selection patterns. Under complete allogamy, HS at neutral markers remained are maintained. However, Figure 4 shows that despite
that the diallelic model was quantitatively erroneous, it close to its value in the absence of selection (respectively 0.155, 0.286, and 0.326 forNm ⫽ 0.1, 1, and 10) and was qualitatively well verified by the simulations results.
As predicted by Equation 5,QSTvalues were greater or decreased only under very strong and diversifying selec-tion. As expected, this indirect effect of selection on smaller thanGSTvalues at the QTL depending on the
Figure 2.—Within-deme variance for the trait,VW, as a function ofHS, the allelic diversity at QTL, over the different selection patterns simulated and for three dif-ferent migration rates. Scale is logarithmic on both axes.
QTL) and heritability for the trait was quantified by selfing, because of fewer recombination events between
calculating Spearman’s rank coefficient across the 25 the neutral markers and the QTL. The allelic diversity
different combinations of selection parameters. All cor-at QTL was always lower than the allelic diversity cor-at the
relations were significant except between neutral mark-neutral markers and decreased as selection intensity
ers and trait when gene flow was high (Nm⫽ 10). The increased. However, it also varied as a function of the
correlations between neutral markers and trait were variance of phenotypic optima among demes. Under
always smaller than the correlations between QTL and high gene flow (Nm⫽ 10) and highly diversifying but
trait. Furthermore, the significant correlations between weak selection (VZOPTⱖ 5 and2ⱖ 10), an increase in
neutral markers and trait were caused entirely by the HS at the QTL was observed, which was probably due
genetic drift effect associated with the strongest selec-to the mixing by gene flow of the different alleles
se-tion intensities simulated (2ⱕ5). Under weak to mod-lected for in demes having different phenotypic optima.
erate selection (2⬎5), no significant correlations were In contrast to molecular markers, the amount of
within-found between neutral markers and trait, whereas HS deme genetic variability for the trait, measured by the
at QTL was highly and significantly correlated with the heritability, showed a complex pattern in response to
heritability for the trait (Spearman’svaried from 0.936 the simulation parameters tested. In general, the trend
forNm⫽0.1 to 0.975 forNm⫽10 under 100% allogamy of variation was parallel but more amplified to the allelic and from 0.83 forNm⫽0.1 to 0.976 forNm⫽10 under diversity at the QTL. Under low to moderate gene flow, 10% allogamy). However, as can be seen from Figure within-deme heritability depended only on the intensity 5, the allelic diversity at the QTL did not perfectly track of selection. Under large gene flow (Nm ⫽ 10), it de- the heritability for the trait across the different selection pended on the interacting effects of both the selection patterns. Both parameters decreased with increasing intensity and the variance of phenotypic optima among selection intensity, but the allelic diversity at QTL was demes. It was then lowest for strong uniform selection much less affected by the variance of phenotypic optima and highest for weak, highly diversifying selection. than was the heritability. As noted above, under diversi-Strong selection depleted genetic variation in each deme, fying selection, gene flow has a large effect on the within-while under diversifying selection, gene flow could re- deme variance for the trait because migrant alleles may store variation by mixing individuals with different phe- carry an additive effect very different from that of resident
notypic values. alleles. But, as those migrant alleles are in low frequency,
they have only a small effect onHS at the QTL. The correlation betweenHSat markers (neutral and
Figure 3.—Differentia-tion at the trait (QST) over the different selection pat-terns simulated, as a func-tion of its expected value in the diallelic case (1 ⫹ B)
Figure 4.—Differentia-tion at the trait,QST, as a func-tion ofGST, the allelic differ-entiation at QTL, over the different selection patterns simulated and for three dif-ferent migration rates. Se-lection patterns generating more genetic covariance at the between-deme level than at the within-deme level (i.e., B ⬎ W) are plotted with solid symbols. Selec-tion patterns generating less genetic covariance at the between-deme level than at the within-deme level (i.e., W ⬎ B) are plotted with open symbols.
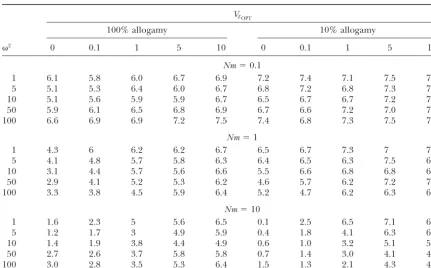
Comparison of genetic differentiation at neutral every locus underlying a given trait is hardly achievable markers, QTL, and trait across different selection pat- in practice. Essentially, a few loci showing the highest terns:Figure 6 shows the between-deme differentiation, contributions to the trait’s variance can be identified GSTfor neutral markers and QTL, andQSTfor the trait, and used for population genetics studies. The QTL cod-for the different selection patterns simulated. Differenti- ing for a same selected trait may differ in their allelic ation at neutral markers increased when selection inten- variability and contribution to the trait’s variance be-sity and variance of phenotypic optima increased. Thus, cause they differed in their genetic effects on the trait whereasGST at neutral markers is unaffected by weak before selection took place. We have not considered or moderate selection, it can be substantially increased this in this study. Instead, we have considered QTL by strong and highly diversifying selection. Genetic dif- having identical effects on a trait initially (except for ferentiation at the QTL was always equal to or higher the stochastic variation associated with the sampling of than genetic differentiation at the neutral markers, even additive values of alleles in a Gaussian law) and ques-under uniform selection. Under the set of selection tioned whether they would differentiate in their allelic parameters tested, GST at QTL increased mainly with variability and contribution to the trait’s variance in increasing intensity of selection and also, but in a less response to selection.
dramatic manner, with increasing variance of
pheno-A polymorphic locus was defined as a locus having typic optima.QSTvaried as a function of both selection its most frequent allele in frequency ⬍0.95 over the intensity and variance of phenotypic optima, being
subdivided population. The number of polymorphic smallest under weak uniform selection and highest
un-neutral markers varied between 7.9 and 8.3 and was der strong diversifying selection. The between-deme
unaffected by selection (data not shown). Table 2 shows component of selection (VZOPT) had less effect on the
how many QTL were polymorphic at the end of the allelic differentiation at the QTL than on the
differentia-simulations. Under diversifying selection, the number tion for the trait. As before, the reason was thatGSTat
of polymorphic QTL was almost identical to the number QTL reflected differences in the frequencies of alleles
of polymorphic neutral markers. By contrast, most QTL among populations, whereas theQSTvalue also took into
became fixed or nearly fixed under uniform selection as account the effect of alleles on the trait’s value.
gene flow increased. In other cases, between one-half Spearman’s rank correlation was calculated between
and two-thirds of the QTL retained allelic polymor-GSTat neutral markers or QTL andQSTacross the
differ-phism. Thus the allelic richness at QTL, which repre-ent selection patterns simulated. Correlations varied
be-sents the short- to mid-term potential for adaptation, tween 0.72 and 0.98 and all were highly significant.
differed greatly according to an interaction between However, Figure 6 shows that under diversifying
selec-the type of selection acting on selec-the trait (uniform or tion, GST at neutral markers was always much smaller
diversifying) and the amount of gene flow. In the follow-than QST, whereas GST at QTL approached QST values
ing, we consider only polymorphic QTL, since fixed or more closely. By contrast, under uniform selection and
nearly fixed QTL are likely to show erratic, noninforma-reduced gene flow, QTL were misleading, as they
tive patterns of genetic differentiation. Furthermore, showed a high level of allelic differentiation, whereas
if not known as candidate genes or from interspecific no differentiation was present for the trait.
crosses, fixed or nearly fixed QTL have only a few Heterogeneity of the response to selection among
chances to be detected in segregation studies. QTL coding for a same trait:Until now, we have
com-The heterogeneity ofGSTvalues among loci was mea-paredQSTwith GST, the mean allelic differentiation at
Figure5.—The effect of variance of phenotypic optima (VZOPT) and intensity of selection (
2) on the within-deme genetic
diversity (HS) at (䊊) neutral markers and (䊉) QTL and on the within-deme heritability for the (X) trait (h2). The different graphs are arranged as in Figure 1.
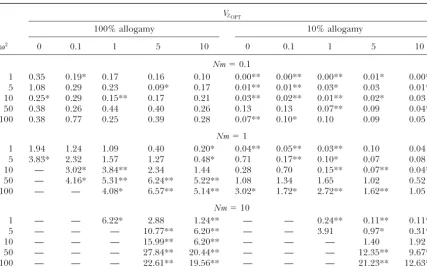
Krakauer (1973). This statistic was originally defined at QTL with the kvalues obtained at neutral markers to provide a test for neutrality, since for neutral loci,k from 10 replicated simulations using a Wilcoxon signed is expected to beⱕ2 (LewontinandKrakauer1973). rank test for paired data. Under strong, uniform
selec-kwas calculated as tion with low gene flow and selfing, polymorphic QTL
had highGSTvalues and displayed significantly less
het-k⫽ (d ⫺1)var(GST)/GST2 erogeneity than neutral markers did. By contrast, under
weak diversifying selection with high gene flow and no (Baer 1999), where d is the number of demes and
selfing, polymorphic QTL displayed significantly more var(GST) andGSTare, respectively, the variance and the
heterogeneity in allelic differentiation than neutral mark-mean of GSTacross loci.
ers did. They behaved as a mix of neutral and selected The heterogeneity ofGSTvalues among neutral
mark-loci, having either a low GSTvalue due to large gene ers was unaffected by selection (data not shown) but
flow or a highGSTvalue due to diversifying selection. increased with gene flow. The average values ofkwere
The heterogeneity among QTL was explored more 0.41, 1.21, and 1.56 forNm⫽0.1, 1, and 10, respectively,
in detail for a case of moderate diversifying selection, under complete allogamy, and 0.13, 0.62, and 1.61
un-whenVZOPT⫽5 and2⫽50 (Figure 7). The contribution der predominant selfing. Table 3 shows the
heterogene-of each polymorphic QTL to the between-deme genetic ity of GST values among polymorphic QTL. For each
be-Figure6.—The effect of variance of phenotypic optima (VZOPT) and intensity of selection (
2) on the genetic differentiation
GSTat (䊊) neutral markers and (䊉) QTL and on the quantitative differentiation (X)QST. The different graphs are arranged as in Figure 1.
tween-deme genic variance at the locus and second, trait. Response to diversifying selection was achieved by allele frequency changes at a few loci that displayed a the between-deme genetic covariance with other QTL.
These two contributions have been studied as a function highGSTvalue together with a high between-deme genic variance and positive covariance with one another. of the allelic differentiation, by grouping QTL into
sev-eral class intervals ofGSTvalues (Figure 7). Under low Thus, notably, when a trait is experiencing diversify-ing selection under intermediate to high gene flow, the gene flow (Nm ⫽ 0.1), most polymorphic QTL fell in
the class of highestGSTvalues (between 0.8 and 1) and underlying QTL seem to have anL-shaped distribution of their contribution to the between-deme genetic vari-displayed a high between-deme genic variance,
compen-sated for by negative genetic covariance with other QTL. ance. Most QTL contribute little to the variance, while a few contribute a lot. Such an L-shaped distribution For an intermediate level of gene flow (Nm ⫽ 1), the
complete range ofGSTvalues, from low (0–0.20) to high has indeed been frequently observed in QTL detection studies (Falconer and Mackay 1996; Kearsey and (0.80–1), was found among the polymorphic QTL. The
highest between-deme genic variance was displayed by Farquhar1998). highly differentiated QTL, which were also negatively
correlated with most other QTL. Under high gene flow
DISCUSSION (Nm⫽ 10), most polymorphic QTL fall in the class of
TABLE 2
Number of polymorphic QTL under the different selection patterns simulated
VZOPT
100% allogamy 10% allogamy
2 0 0.1 1 5 10 0 0.1 1 5 10
Nm⫽0.1
1 6.1 5.8 6.0 6.7 6.9 7.2 7.4 7.1 7.5 7.2
5 5.1 5.3 6.4 6.0 6.7 6.8 7.2 6.8 7.3 7.5
10 5.1 5.6 5.9 5.9 6.7 6.5 6.7 6.7 7.2 7.3
50 5.9 6.1 6.5 6.8 6.9 6.7 6.6 7.2 7.0 7.2
100 6.6 6.9 6.9 7.2 7.5 7.4 6.8 7.3 7.5 7.7
Nm⫽1
1 4.3 6 6.2 6.2 6.7 6.5 6.7 7.3 7 7.4
5 4.1 4.8 5.7 5.8 6.3 6.4 6.5 6.3 7.5 6.9
10 3.1 4.4 5.7 5.6 6.6 5.5 6.6 6.8 6.8 6.9
50 2.9 4.1 5.2 5.3 6.2 4.6 5.7 6.2 7.2 7.2
100 3.3 3.8 4.5 5.9 6.4 5.2 4.7 6.2 6.3 6.4
Nm⫽10
1 1.6 2.3 5 5.6 6.5 0.1 2.5 6.5 7.1 6.8
5 1.2 1.7 3 4.9 5.9 0.4 1.8 4.1 6.3 6.3
10 1.4 1.9 3.8 4.4 4.9 0.6 1.0 3.2 5.1 5.5
50 2.7 2.6 3.7 5.8 5.8 0.7 1.4 3.0 4.1 4.5
100 3.0 2.8 3.5 5.3 6.4 1.5 1.3 2.1 4.3 4.9
A QTL was considered as polymorphic when the frequency of its most common allele over the subdivided population was⬍0.95. Means over 10 replicates for each set of selection parameters are given for each case.
topic in conservation biology and the management of the differentiation for the trait. Our simulations have extended Latta’s results to the within-deme level. We genetic resources (Storfer 1996; Frankham 1999;
Booyet al. 2000), and a number of experimental investi- also examined the relationship between differentiation for the trait and differentiation at QTL on a locus-per-gations have recently studied the genetic differentiation
of populations using both marker loci and quantitative locus basis.
Discrepancy between diversity and differentiation at traits (seeMcKayandLatta2002 for a review of
pub-lished data for 29 species). By contrast, analytical models an adaptive trait and its underlying QTL: HS and GST are basically single-locus measures, even though they for the evolution of selected traits in subdivided
popula-tions have only rarely been proposed. Their complexity are averaged over all QTL. On the other hand,VWand
QST are multilocus measures, since they also include usually requires simplifying assumptions such as infinite
number of loci and linkage equilibrium (see Narain covariances generated by gametic disequilibria (Equa-tion 1). Therefore the discrepancies observed between and Chakraborty 1987; Tachida and Cockerham
1987;Nagylaki1994). Even fewer studies (Latta1998) the two kinds of measures are a direct consequence of their properties. These discrepancies were more pro-have focused on the theoretical basis of the discrepancy
observed between genetic variability at a traitvs.that at nounced for differentiation than for within-deme diver-sity, because disequilibria at both the within- and the the loci coding for the trait. The diallelic model we
used clarified the effects of within- and between-deme between-deme levels contributed toQSTwhereas onlyW contributes toVW. The equilibrium value ofVW andHS gametic disequilibria at QTL on the difference between
the two measures of differentiation, QSTandFST. How- decreased as the intensity of stabilizing selection got stronger. This parallel evolution contributed to the posi-ever, when compared to simulations based on
multial-lelic loci, the dialmultial-lelic model was found to underestimate tive correlation betweenVWandHSas shown by Figure 2. However, the combined effect of gene flow and diver-the difference betweenQSTandFST. Because of the limits
of analytical approaches, computer simulations are a sifying selection can contribute to maintaining higher levels of within-deme variability for the adaptive trait promising tool for the investigation of the dynamics of
adaptive traits in subdivided populations. In his simula- than for the QTL. This is because migrant alleles in the case of strong diversifying selection may only slightly tion study, Latta (1998) pointed out that selection
results in linkage disequilibrium between QTL rather change allele frequencies, but can have larger effect on the additive value of the trait.
than in allele frequency changes at the between-deme
TABLE 3
Heterogeneity ofGSTvalues among polymorphic QTL as measured by Lewontin and Krakauer’skstatistic,
for the different selection patterns simulated
VZOPT
100% allogamy 10% allogamy
2 0 0.1 1 5 10 0 0.1 1 5 10
Nm⫽0.1
1 0.35 0.19* 0.17 0.16 0.10 0.00** 0.00** 0.00** 0.01* 0.00**
5 1.08 0.29 0.23 0.09* 0.17 0.01** 0.01** 0.03* 0.03 0.01**
10 0.25* 0.29 0.15** 0.17 0.21 0.03** 0.02** 0.01** 0.02* 0.03
50 0.38 0.26 0.44 0.40 0.26 0.13 0.13 0.07** 0.09 0.04**
100 0.38 0.77 0.25 0.39 0.28 0.07** 0.10* 0.10 0.09 0.05
Nm⫽1
1 1.94 1.24 1.09 0.40 0.20* 0.04** 0.05** 0.03** 0.10 0.04
5 3.83* 2.32 1.57 1.27 0.48* 0.71 0.17** 0.10* 0.07 0.08
10 — 3.02* 3.84** 2.34 1.44 0.28 0.70 0.15** 0.07** 0.04**
50 — 4.16* 5.31** 6.24** 5.22** 1.08 1.34 1.65 1.02 0.52
100 — — 4.08* 6.57** 5.14** 3.02* 1.72* 2.72** 1.62** 1.05
Nm⫽10
1 — — 6.22* 2.88 1.24** — — 0.24** 0.11** 0.11**
5 — — — 10.77** 6.20** — — 3.91 0.97* 0.31**
10 — — — 15.99** 6.20** — — — 1.40 1.92
50 — — — 27.84** 20.44** — — — 12.35** 9.67**
100 — — — 22.61** 19.56** — — — 21.23** 12.63**
Lewontin and Krakauer’skwas not calculated when less than four QTL were polymorphic on average (see Table 2). Means over 10 replicates of each selection pattern are given. Asterisks represent the significance of the difference ofkbetween QTL and neutral markers as determined by a paired signed-rank Wilcoxon test; two-sided probability values were calculated. *0.01ⱕP⬍0.05; **P⬍0.01.
the difference between the gametic disequilibria within and differentiation. This is the case when there is low gene flow and diversifying selection. Both factors act and between demes (e.g., betweenBandW) is the key
factor involved. Under diversifying selection, ifB and toward high differentiation and extremely low diversity within deme. In this case, measures at the three levels
W reach similar values, GST and QST are expected to
be equal. Whatever the selection scenario considered, are congruent and assessment done with neutral mark-ers would be sufficient for genetic surveys.
whenB⬎ WthenQST⬎GSTof the QTL and vice versa
as predicted by Equation 5 and as shown on Figures A second less trivial case occurs when congruence for differentiation coexists with a discrepancy for diversity. 4 and 6. As the difference between both disequilibria
increased, the difference betweenGSTandQSTalso in- This occurs when uniform selection is associated with high gene flow. In this case extremely low differentiation creased. These results confirm earlier comparative
anal-yses of mono- and multitrait systems, which also outlined occurs at all three levels, but diversity is strikingly higher at neutral markers than at QTL or the trait. Due to the role of the disparity between disequilibria in
popula-tion differentiapopula-tion (Kremeret al. 1997). uniform selection the same alleles are selected in all demes and diversity of QTL and the trait reaches low Comparative dynamics of variability at neutral
mark-ers, QTL, and adaptive traits, and inferences on selec- values. In this case the use of neutral markers for mea-suring adaptive diversity within deme would be mis-tion patterns:Neutral markers, QTL, and adaptive traits
responded very differently to different selection scenar- leading; however, assessments at the QTL would be reli-able.
ios and gene flow as shown by Figures 5 and 6.
Con-trasting patterns can be identified corresponding to A third case occurs when there is congruence for diversity but discrepancy for differentiation. This occurs whether there is congruence or discrepancy for diversity
and differentiation at the three levels considered (neu- when gene flow is low and there is uniform selection. Diversity is depleted for all three levels, and differentia-tral markers, QTL, and traits), leading to some practical
recommendations for assessing adaptive variation within tion is strikingly low for the trait but high for the QTL and neutral markers. This discrepancy is due to a large and between natural populations.
Figure7.—Contribution of each polymorphic QTL to the between-deme ( ) genic variance and ( ) genetic covariance for the trait under weak diversifying selection. Simulation parameters wereVZOPT⫽5 and2⫽50. Polymorphic QTL were classified into six groups according to their GST value (0–0.2; 0.2–0.4; 0.4–0.6; 0.6–0.8; 0.8–1). Height of hatched bars represents the contribution to the genic variance or to the genetic covariance of each QTL, averaged over all QTL in a given class ofGSTvalues. Width of hatched bars is proportional to the number of QTL found in the class.
high level of differentiation at each QTL. Neither neu- These peculiar dynamics may in turn be used to inter-pret the existing data and infer conclusions on selection tral markers nor QTL would be recommended for
as-sessing differentiation of present adaptive traits. How- occurring in natural populations, which is usually diffi-cult to assess. The several recent studies that have fo-ever, the allelic differentiation at the QTL, which is
offset by disequilibria, may be relevant from the point cused on the comparison of differentiation at quantita-tive traits vs. biochemical or molecular markers may of view of future adaptation.
Finally, the last case arises when there is an important highlight which evolutive scenarios are more likely among the several described in our study. The general discrepancy between the three levels for both diversity
and differentiation. This situation occurs when there is lack of association found between neutral marker and quantitative genetic variation within population (Reed highly diversifying selection and important gene flow.
As already mentioned, higher within-deme diversity for and Frankham 2001) suggests, if not due to a bias toward allogamous species with high gene flow, that traits than for QTL can be maintained due to the more
pronounced effect of migrant alleles on the additive natural stabilizing selection is generally of moderate intensity. A comparison of experimental data with muta-values than on the allelic frequency. The difference
betweenBandWis expected to be larger, increasing tion-selection models indeed suggests that for most traits 2/V
E falls between 5 and 50 (Roff 1997). In the discrepancy between QST and GST of the QTL. As
the contribution of covariances among QTL represents several tree species (Pinus contorta,Yanget al. 1996;P. sylvestris,Hurmeet al. 2000;Quercus petraea,Kremeret the largest component of the variance of the adaptive
trait, a suggested option would be to assess disequilibria al. 2000;Salix viminalis,Lascoux1996),QSTvalues were found to be much higher than GSTvalues for neutral between QTL (association between alleles at QTL), even
burst (in Q. petraea and P. sylvestris). Since temperate populations. On the other hand, theL-shaped pattern may not be general, as other studies of natural popula-forest trees occupy large areas with contrasting
ecologi-cal conditions, one would anticipate strong diversifying tions have found several QTL each explaining a small fraction of the variation in adaptive traits (see,e.g., Jerm-selection for fitness-related traits such as bud burst. If
selection is weak, however, important gametic disequi- stadet al. 2001) and also because a statistical bias may be present in some studies, which reduces the number libria may be maintained between demes. Conversely,
because forest trees are mostly random-mating species of QTL detected and amplifies their estimated effects (BartonandKeightley2002). Our simulations indi-with large deme sizes, no positiveW is expected. An
important disparity between B and W may therefore cated that the distribution should be more L-shaped when populations undergo strong diversifying selection exist, leading to a discrepancy betweenGSTat QTL and
QST, although a few QTL should be much more differen- and are connected by important gene flow. In this case, most of the loci contributing to the trait would exhibit tiated than neutral markers. In the annual plantScabiosa
columbaria(WaldmannandAndersson1998),QSTval- GST values of similar magnitude to neutral markers, whereas only a few would exhibit important allelic differ-ues were also found to be higher than GST values at
markers, but varied greatly among traits, with values entiation and important contribution to the between-deme variance of the trait. In our simulations, this pat-ranging from 0.15 (leaf number) to 0.75 (stem height).
A large variation was also observed among 17 traits (val- tern was caused by allele frequency changes at the QTL under both selection and population subdivision. Other ues ranging from 0.005 to 1) in the annual plantClarkia
dudleyana(PodolskyandHoltsford1995). InDaph- explanations have, however, been proposed to account for anL-shaped distribution of QTL effects. Evolution nia pulex(Lynchet al. 1999), 12 traits among 18 studied
showed a higher differentiation than that for molecular of a population toward a fixed optimum via sequential susbstitution of favorable mutations generally leads to markers, as well as a reduced variation within
popula-tion, a pattern consistent with strong diversifying selec- such a pattern (Orr1998); linkage or the intrinsic prop-erties of enzymatic pathways are other explanations tion. The two other traits, which measured age at
repro-duction, showed low variation and low differentiation (Bostet al. 1999). Whatever its underlying causes, an L-shaped distribution of gene effects may be a serious and were likely to be subject to strong uniform selection.
According to these experimental data, diversifying selec- obstacle to a complete genetic analysis of all QTL for a trait, including the estimation of linkage disequilibria. tion seems to be the most common form of selection
in natural populations (Lynchet al. 1999), but selection The most easily detected QTL (i.e., those showing allelic differentiation) being those that have responded to se-parameters are also likely to vary from trait to trait, so
that no general conclusion can be drawn. lection, they are also the most informative regarding present adaptive variability; however, they may not re-Impact of selection on the distribution of genetic
variability among QTL:A notable result of our simula- spond to future selection pressures. Identifying and as-sessing the genetic variability that may be adaptive in tions was that diversifying selection could generate an
L-shaped distribution of the contributions of QTL to the future remains a challenging issue, since QTL that exhibit lowGSTvalues today (“silent” QTL) may actually the between-deme variance for the trait, when the initial
contributions of the QTL differed only due to random be “turned on” as a result of new or recent mutations and may be important for future adaptation.
sampling in the same Gaussian distribution. These
re-sults are similar to those that were obtained for the Future research needs:In this study, we have consid-ered a fairly simple genetic architecture for the trait: a contribution of QTL to the variance of segregating
pop-ulations, as illustrated by various experimental results moderate number of genes having identical and addi-tive effects, with no physical linkage. Increasing the (KearseyandFarquhar1998;Bostet al. 1999),
includ-ing QTL analyses in wild species. In Drosophila, two number of QTL would, as shown by Latta (1998), increase the amount of gametic disequilibrium and thus major QTL have been found to be associated with bristle
number variation and to have large effects relative to inflate the discrepancy between QST and GST. Physical linkage is also expected to maintain higher levels of standing natural variation in the trait (Longet al. 2000).
In Scots pine, two QTL were found in a study of bud gametic disequilibria (GavriletsandHastings1995) and thus may increase also the discrepancy betweenQST burst timing from a cross involving two natural
popula-tions from different latitudes (Hurmeet al. 2000). In andGST. Furthermore, more allelic variability is main-tained under stabilizing selection when loci tend to be Arabidopsis thaliana, a large number of small-effect
al-leles and a small number of larger-effect alal-leles have tightly linked (Bu¨ rger and Gimelfarb 1999), which should lower theGSTvalue. Unequal contributions to been found to account for natural variation in seed
weight and several other life-history traits (Alonso- the trait of the different QTL before selection would probably just accentuate the degree of final heterogene-Blancoet al. 1999). The comparison of the L-shaped
distribution for the contribution of QTL to the between- ity among them. The consequences of nonadditive ef-fects at QTL, i.e., dominance or epistasis, are much deme variance should, however, be taken with caution,
maintained under stabilizing selection without mutation:
epista-epistasis, higher degrees of within-deme variance are
sis. Genetics123:217–227.
maintained under stabilizing selection than that for a Hendry, A. P., 2003 QST⬎ ⫽⬆⬍FST? Trends Ecol. Evol.17:502. Hurme, P., M. J.Sillanpaa, E.Arjas, T.Repoand O.Savolainen,
purely additive trait (Gimelfarb 1989). On the other
2000 Genetic basis of climatic adaptation in Scots pine by
Bayes-hand, since a given allele may have a small additive ian quantitative trait locus analysis. Genetics156:1309–1322. effect, but nevertheless a large effect on the trait via its Jermstad, K. D., D. L. Bassoni, K. S.Jech, N. C.Wheeler and
D. B.Neale, 2001 Mapping of quantitative trait loci controlling
interaction with alleles at other loci, we expect that the
adaptive traits in cotal Douglas fir. I. Timing of vegetative bud
allelic variability at QTL will be more disconnected from flush. Theor. Appl. Genet.102:1142–1151.
Kearsey, M. J., and A. G. L.Farquhar, 1998 QTL analysis in plants:
the variance at the trait in the presence of epistasis. As
Where are we now? Heredity80:137–142.
several recent experimental studies have indicated the Kremer, A., A.Zanettoand A.Ducousso, 1997 Multilocus and presence of epistatic interactions among loci coding for multitrait measures of differentiation for gene markers and
phe-notypic traits. Genetics145:1229–1241.
adaptive traits (see,e.g.,RoutmanandCheverud1997;
Kremer, A., V.Le Correand S.Mariette, 2000 Population
differ-Shook and Johnson 1999; Fenster and Galloway entiation for adaptive traits and their underlying loci in forest 2000), there is clearly a need for more theoretical or trees: theoretical predictions and experimental results, pp. 59–74 inForest Genetics and Sustainability, Vol. 63, edited by C.Matyas.
simulation-based studies that consider the consequences
Kluwer Academic Publisher, Dordrecht, The Netherlands.
of epistasis on the dynamics of genetic variability under Lande, R., 1992 Neutral theory of quantitative genetic variance in
an island model with local extinction and colonization. Evolution
natural selection.
46:381–389.
We are grateful to Outi Savolainen and two anonymous reviewers Latta, R. G., 1998 Differentiation of allelic frequencies at quantita-for helpful comments on the manuscript. tive trait loci affecting locally adaptive traits. Am. Nat.151:283–
292.
Lascoux, M., 1996 Population structure of a riparian willow species,
Salix viminalisL. Genet. Res.68:45–54.
Le Corre, V., N.Machon, R. J.Petitand A.Kremer, 1997 Coloniza-LITERATURE CITED tion with long-distance seed dispersal and genetic structure of maternally inherited genes in forest trees: a simulation study. Adams, W. T., S. H.Srauss, D. L. Copesand A. R.Griffin, 1992
Genet. Res.69:117–125.
Population Genetics of Forest Trees. Kluwer Academic Publishers,
Lewontin, R. C., and J.Krakauer, 1973 Distribution of gene fre-Dordrecht, The Netherlands.
quencies as a test of the theory of the selective neutrality of Alonso-Blanco, C., H.Blankestijn-De Vries, C. J.Hanhartand
polymorphisms. Genetics74:175–195. M.Koornneef, 1999 Natural allelic variation at seed size loci
Lynch, M., M.Pfrender, K.Spitze, N.Lehman, J.Hickset al., 1999 in relation to other life history traits ofArabidopsis thaliana.Proc.
The quantitative and genetic architecture of a subdivided species. Natl. Acad. Sci. USA96:4710–4717.
Evolution53:100–110. Baer, C. F., 1999 Among-locus variation inFST: fish, allozymes and
the Lewontin-Krakauer test revisited. Genetics152:653–659. Long, A. D., R. F.Lyman, A. H.Morgan, C. H.Langleyand T. F. C. MacKay, 2000 Both naturally occurring insertions of transpos-Barton, N. H., and P. D.Keightley, 2002 Understanding
quantita-tive genetic variation. Nat. Rev. Genet.3:11–21. able elements and intermediate frequency polymorphisms at the
achaete-scutecomplex are associated with variation in bristle num-Bonnin, I., J. M.Prosperiand I.Olivieri, 1996 Genetic markers
and quantitative genetic variation inMedicago truncatula(Legumin- ber inDrosophila melanogaster.Genetics154:1255–1269. McKay, J. K., and R. G. Latta, 2002 Adaptive population
diver-osae): a comparative analysis of population structure. Genetics
143:1795–1805. gence: markers, QTL and traits. Trends Ecol. Evol.17:285–291.
Merila¨, J., and P.Crnokrak, 2001 Comparison of genetic differen-Booy, G., R. J. J.Hendricks, M. J. M.Smulders, J. M.Van
Groenen-daeland B.Vosman, 2000 Genetic diversity and the survival tiation at marker loci and quantitative traits. J. Evol. Biol.14: 892–903.
of populations. Plant Biol.4:379–395.
Bost, B., C.Dillmannand D.de Vienne, 1999 Fluxes and metabolic Morgenstern, K., 1996 Geographic Variation in Forest Trees. UBC Press, Vancouver, BC, Canada.
pools as model traits for quantitative genetics. I. TheL-shaped
distribution of gene effects. Genetics153:2001–2012. Nagylaki, T., 1994 Geographical variation in a quantitative charac-ter. Genetics136:361–381.
Bulmer, M. G., 1974 Linkage disequilibrium and genetic variability.
Genet. Res.19:17–25. Narain, P., and R.Chakraborty, 1987 Genetic differentiation of
quantitative characters between populations or species. II: opti-Bulmer, M. G., 1989 Maintenance of genetic variability by
mutation-selection balance: a child’s guide through the jungle. Genome mal selection in infinite populations. Heredity59:199–212. Nei, M., 1987 Molecular Population Genetics. Columbia University 31:761–767.
Bu¨ rger, R., and A.Gimelfarb, 1999 Genetic variation maintained Press, New York.
Orr, H. A., 1998 The population genetics of adaptation: the distribu-in multilocus models of additive quantitative traits under
stabiliz-ing selection. Genetics152:807–820. tion of factors fixed during adaptive evolution. Evolution 52: 935–949.
Butlin, R. K., and T.Tregenza, 1998 Levels of genetic
polymor-phism: marker loci versus quantitative traits. Philos. Trans. R. Podolsky, R. H., and T. P.Holtsford, 1995 Population structure of morphological traits inClarkia dudleyana. I. Comparison of Soc. Lond.353:187–198.
Falconer, D. S., and T. F. C.Mackay, 1996 Introduction to Quantita- FSTbetween allozymes and morphological traits. Genetics140: 733–744.
tive Genetics. Addison Wesley Longman, New York.
Fenster, C. B., and L. F.Galloway, 2000 Population differentiation Prout, T., and J. S. F.Barker, 1989 Ecological aspects of the herita-bility of body size inDrosophila buzzatii.Genetics123:803–813. in an annual legume: genetic architecture. Evolution54:1157–
1172. Reed, D. H., and R.Frankham, 2001 How closely related are
molecu-lar and quantitative measures of genetic variation? A meta-analy-Foley, P., 1992 Small population genetic variability at loci under
stabilizing selection. Evolution46:763–774. sis. Evolution55:1095–1103.
Roff, D. A., 1997 Evolutionary Quantitative Genetics. Chapman & Hall, Frankham, R., 1999 Quantitative genetics in conservation biology.
Genet. Res.74:237–244. New York.
Rogers, A. R., and H. C.Harpending, 1983 Population structure Gavrilets, S., and A.Hastings, 1994 Dynamics of genetic
variabil-ity in two-locus models of stabilizing selection. Genetics 138: and quantitative characters. Genetics105:985–1002.
Routman, E. J., and J. M.Cheverud, 1997 Gene effect on a quantita-519–532.
Gavrilets, S., and A.Hastings, 1995 Dynamics of polygenic vari- tive trait: two-locus epistatic effects measured at microsatellite markers and at estimated QTL. Evolution51:1654–1662. ability under stabilizing selection, recombination and drift.
Genet. Res.65:63–74. Shook, D. R., and T. E.Johnson, 1999 Quantitative trait loci
genotype-environment interactions, pleiotropy and epistasis. Ge- genetic variation and allozyme diversity within and between popu-lations ofScabiosa canescensandS. columbaria.Heredity81:79–86. netics153:1233–1243.
Spitze, K., 1993 Population structure inDaphnia obtusa: quantitative Whitlock, M. C., 1999 Neutral additive genetic variance in a meta-population. Genet. Res.74:215–221.
genetics and allozymic variation. Genetics135:367–374.
Storfer, A., 1996 Quantitative genetics: a promising approach for Wright, J., 1976 Introduction to Forest Genetics. Academic Press, the assessment of genetic variation in endangered species. Trends London.
Ecol. Evol.11:343–348. Wright, S., 1951 The genetical structure of populations. Ann.
Eu-Tachida, H., and C. C.Cockerham, 1987 Quantitative genetic varia- gen.15:323–354.
tion in an ecological setting. Theor. Popul. Biol.32:393–429. Yang, R. C., F. C.Yehand A. D.Yanchuk, 1996 A comparison of Turelli, M., 1984 Heritable genetic variation via mutation-selection isozymes and quantitative genetic variation inPinus contortassp.
balance: Lerch’s zeta meets the abdominal bristle. Theor. Popul. latifoliabyFST. Genetics142:1045–1052. Biol.25:138–193.