THE PERFORMANCE PERSISTENCE OF WINNER FUND MANAGERS – EVIDENCE FROM THE TIMING AND STOCK PICKING ABILITY
Ying-Fen Fu1 Hai-Ching Liu2+
1
Assistant Professor, Department of Finance, Tainan University of Technology,Taiwan
2Assistant Professor, Department of Finance, Southern Taiwan University of Science and Technology,Taiwan
(+ Corresponding author) ABSTRACT
Article History
Received: 18 January 2017 Revised: 22 March 2017 Accepted: 5 April 2017 Published: 24 April 2017
Keywords Fund manager Timing Stock picking Performance persistence Winner
Equity funds.
JEL Classification
G10, G11.
This study aims to investigate the persistence of timing and stock picking ability of “winner fund managers” instead of winner funds. The sample of this study is the previous and next equity funds which the same fund managers manage in Taiwan. we measure the ranking of timing and stock picking ability of fund managers for the period they manage the specific fund. The result shows that for the whole fund managers, the successive two funds they manage are performance persistent. Moreover, the stock picking ability of the two funds they manage is persistent no matter the two funds belonging to the same fund company or not. Regarding the winner fund manager, we find no persistence of return, timing ability and stock picking ability. No matter the winner fund managers change the jobs to the other fund companies or not, the next funds the winner fund managers manage are not timing and stock picking ability persistent. The result of logistic regression demonstrates that the probability of becoming timing or stock picking winners of the next funds which the timing or stock picking winner managers manage is not significantly higher than other funds. The result indicates that investors do not necessarily follow the timing and stock picking winner fund managers. The performance of the next funds which the winner fund managers manage may reverse especially for the successive two funds belonging to the same fund company. Little literature investigates the issue regarding the fund timing and stock picking performance from the viewpoint of “fund managers”. The results of this study provide investing implications for fund investors when they are choosing funds.
1. INTRODUCTION
Mutual funds with good performance always attract the attention of investors. And there is no lack of media coverage regarding fund managers with excellent management ability. In fact, the excellent management skill may come from multiple sources, including the timing and stock picking ability (Grinblatt and Titman, 1993; Daniel et al.,
1997). The timing ability denotes that fund managers can raise or reduce the holding positions at the right time, and
the stock picking ability represents that fund managers can buy the stocks with following good performance and sell those with following bad performance.
Asian Economic and Financial Review
ISSN(e): 2222-6737 ISSN(p): 2305-2147
DOI: 10.18488/journal.aefr.2017.76.611.622 Vol. 7, No. 6, 611-622
This study aims to investigate whether the winner fund managers (with performance in top 20%) has the persistent timing and stock picking ability regarding the previous and subsequent funds which they manage. Winner fund managers tend to be headhunted by other funds due to their excellent performance. However, whether the excellent timing and stock picking ability of winner managers are persistent needs more investigation. Kacperczyk et
al. (2014) point out that although not all funds perform well, some excellent fund managers indeed can provide
valuable service for their customers if ignoring the fee. Thus it‟s an interesting issue to investigate whether the the previous and next funds which winner managers manage are timing and stock picking persistent. This study focuses on the persistence of timing and stock picking ability of „fund managers‟ rather than „funds‟, so the sample would be the funds which were managed by the same fund managers in the previous and subsequent periods.
This study fills the gap of literature by focusing on the timing and stock picking ability of “fund managers” rather than on those of “funds”. This study will clarify whether the outstanding timing and stock picking ability of fund managers persists when they manage another fund. Little literature investigates issues regarding the fund managers in Taiwan. The results of this study may provide important reference for fund investors when they are making investing decisions.
2. LITERATURE REVIEW
The management ability of fund managers can be measured through timing and stock picking ability. The timing ability denotes the fund managers may increase β of their portfolios when the market index is rising, and vice versa. Fund managers with timing ability may hold more risky positions when the market is in bull market, while they may hold less risky positions when the trend of market goes down (Kacperczyk et al., 2014). The stock picking ability measures the abnormal return which is the return between the selected stocks and the benchmark. Fund managers with stock picking ability may choose stocks with better subsequent performance (Fulkerson, 2013).
Past literature demonstrates that fund managers cannot perform better than the passive strategy if assessing their management ability by performance (Fama and French, 2010). However, some researches denote that some funds can perform well persistently (Kacperczyk et al., 2005;2008; Christoffersen et al., 2007; Kacperczyk and Seru, 2007;
Cremers and Petajisto, 2009; Baker et al., 2010; Cohen et al., 2011; Huang et al., 2011; Amihud and Goyenko, 2013;
Koijen, 2014). The consistent result of the literature points out some of the best fund managers have stocking picking
ability, but they almost have no timing ability (Ferson and Schadt, 1996; Graham and Harvey, 1996; Daniel et al., 1997; Becker et al., 1999; Kacperczyk and Seru, 2007). A skilled fund manager will try to earn higher expected returns by raising the weight of stocks which are expected to perform better in their portfolio. However, Daniel et al.
(1997) do not observe the timing ability of fund managers. Daniel et al. (1997) and Wermers (2000) point out that
fund managers do not have timing ability when considering the stock characters, including market value, the ratio of market value over book value and momentum. They discover the positive stock picking ability but no timing ability. Although the above literature shows little timing ability of fund managers, Bollen and Busse (2001) and Elton et al.
(2012) find the timing ability of fund managers when adopting the higher frequency data. Kacperczyk et al. (2014)
demonstrate that the management skills of fund mangers differ between bull and bear markets. They observe the top 25% winner funds with stock picking ability in booms. And they find that these funds have significant timing ability in recessions. That is, fund managers time the market well in recessions, while they pick stocks well in expansions.
Wermers (2000) find that the turnover rate and abnormal return are positively related. Wermers believe that fund managers adjust their portfolio according to the new information and result in the excellent stock picking ability.
Kosowski et al. (2006) adopting the bootstrap analysis displays that star fund managers‟ stock picking ability is good
enough to cover the cost. Kacperczyk et al. (2014) find that the the top 25% winner funds with timing ability in recessions can significantly picks stocks well in booms. Kacperczyk et. al., demonstrates that only some fund managers have the management skill. And how to make use of the skills depends on the econmic environment. Although the skilled fund managers can carry out their task sucessfully, it more or less depens on the environment of the market. Fulkerson (2013) investigating the equity funds in America find that fund managers have the stock picking ability in the first period (1980-1994), while they do not have the stock picking ability in the second period (1995-2007). Fulkerson believes that the stock picking in the mutual fund industry is the main sources of managers‟ skills.
The excellent fund managers must have the outstanding management skills. The literature demonstrates that the skill may come from the excellent stock picking or timing ability. Kacperczyk et al. (2014) find that good fund managers have the stock picking ability in booms and the timing ability in recessions. The fund managers with stock picking ability in expansion can do the timing well in recessions. These fund managers perform significantly better than other fund managers and the performance index. Kacperczyk et al., yet point out that some fund managers have the timing ability and some have the stocking picking ability. No one can perform well both in timing and stock picking. Kosowski et al. (2006) demonstrate that the best fund managers cannot contribute their performance totally to the luck. Thus, this study will examine whether the management ability of the same fund managers especially the excellent fund mangers persists. Moreover, this study will investigate whether the persistence comes from the timing ability persistence or the stock picking ability persistence.
This study focuses on the winner fund managers. The media reports these excellent fund mangers more often than other managers. Therefore, the excelelnt fund mangers can attrack more attention of fund investors. This study aims to investigate the persistence of fund managers‟ timing and stock picking ability, which will help investors clarify whether follow the excellent fund managers is a good decision or not.
3. RESEARCH METHOD
3.1. The Data
The sample of this research is the equity funds in Taiwan. The sample period is from Jan. 1997 to Dec. 2012. This study investigates previous and next equity funds which the same fund managers manage. The data of fund managers and the funds they manage was collected from Fund DJ website. Following Brinson et al. (1986) and
Brinson et al. (1991) we measure the timing and stock picking ability of fund managers for the period they manage
the specific fund. When the ranking of the timing (stock selecting) ability of the fund is in top 20%, the fund manager who manage this fund is denoted as winner fund manager. The data of fund expense ratio (Carhart, 1997) turnover rate (Jan and Hung, 2003) net assets (Berk and Green, 2004; Chen et al., 2004; Yan, 2008) and fund flows were collected from the fund database of TEJ (Taiwan Economic Journal).
3.2. Research Method
This study aims to investigate whether the timing and stock picking ability of previous and next funds which winner fund managers manage are persistent. The definition of timing and stock picking ability is as follows :
3.2.1. The Definition of Timing and Stock Picking Ability
Regarding the timing and stock picking ability, this study adopts the definition of Brinson et al. (1986) and
Brinson et al. (1991). They divide abnormal performance into timing ablility, stock picking ability and others. The
fund return and the poilcy return (passive basic holdings). The holdings of equity funds in Taiwan are at least 70% according to the regulation of Financial Superviosory Commission R.O.C.. Therefore, 70% of holdings is the passive basic holdings. The market return is the benchmark of the passive holdings. Thus, the policy return of funds is 70% of the market return. The definition of timing and stock picking ability is as Table 1 :
Table-1. The Definition of Timing and Stock Picking Ability
Actual Return (Rai) Passive Benchmark Return(Rp i)
Ⅳ.Actual Portfolio
Return
Ⅱ.Policy and Active Asset
Allocatin Return
Ⅲ.Policy and Stock
Picking Return
Ⅰ.Policy Return (Passive
Benchmark Return)
timing performance =Ⅱ-Ⅰ
stock picking performance =Ⅲ-Ⅰ
others =Ⅳ-Ⅲ-Ⅱ+Ⅰ
Stock Picking
Timing
Actual Investing
Weight
(Wai)
Passive Investing
Weight (Wp i)
i
ai
ai R
W )
(
i
pi
ai R
W )
(
i
pi pi R
W )
(
i
ai pi R
W )
(
Source:Brinson et al. (1986) and Brinson et al. (1991)
3.3. The Timing and Stock Picking Ability of Previous and Next Funds which Fund Managers Manage
Puetz and Ruenzi (2011) have pointed out that fund managers care more about their performance ranking rather
than the absolute performance. This study investigates the timing and stock picking abilty persistence of winner fund managers, which focuses on the relative return not the absolute return. Following the ranking approach of Puetz and
Ruenzi (2011), this study constructs the timing and stock picking ability ranks of fund managers based on the funds
they manage for the management period. The rank is between 1 and 0. The worst ranks 0 and the best ranks 1. The model is as follows:
ARANKj,k=a+b1BRANKi,k+b2DSEX+b3DEDU+b4FLOWj,k+b5EXPj,k+b6TURNj,k+b7SIZEj,k
+ε (1)
Where the dependent variable ARANKj,k denotes the timing (stock picking) ability ranking of the next fund
which the winner fund manager k manages. BRANKi,k represents the timing (stock picking) ability ranking of the
previous fund which the winner fund manager k manages. When b1 is significantly positive, it means the timing and
stock picking ability of the previous and next funds which fund manager k manages are persistent. The control variable DSEX equal to 1 denotes the male winner fund manager and DEDU equal to 1 denotes that the winner fund
managers‟ educational background is Master or Doctor. FLOWj,k denotes the average net flow rate of fund j (previous
fund) which winner fund manager k manages for the management period. EXPj,k represents the average expense ratio
of fund j which winner fund manager k manages for the management period. TURNj,k denotes the average turnover
rate of fund j which winner fund manager k manages for the management period. SIZEj,k denotes the average
3.4. Robustness Test
This study adopts the logistic regression as the robustness test. Model (2) aims to investigate the probability of becoming timing (stock picking) winners (1~0.8) of the next funds which winner fund manager k manages if the previous funds they manage were timing (stock picking) winners. In Model (2), DBWINik =1denotes the previous fund
which the fund manager manages is timing (stock picking) winner. The logit Lj (=ln [(Pj/(1-Pj)]) is log of odd ratio –
the ratio between the probability that the next fund is timing (stock picking) winner and the probability that the next fund is not timing (stock picking) winner. The higher coefficient of b1denotes the higher probability of becoming
timing (stock picking) winners of the next funds when the previous funds the fund managers manage were timing (stock picking) winners.
Lj=ln[(Pj/(1-Pj)]=a+b1DBWINik+b2DSEX+b3DEDU+b4FLOWj,k++b5EXPj,k+b6TURNj,k
+b7SIZEj,k +ε (2)
4. EMPIRICAL RESULTS
4.1. The Timing and Stock Picking Ability Persistence of Winner Fund Managers
This study focuses on the performance (timing and stock picking) persistence of the previous and next funds which the fund managers manage. Table 2 demonstrates the PR (percentile rank) value of the previous and next funds which the fund managers manage. The statistics of Table 2 shows that the performance (return, timing ability, stock picking ability and others) PR value of the next funds which the fund manager manage is mostly lower than that of the previous funds. It is obvious that fund managers perform worse after they manage another fund. Table 2 further divides funds into two groups based on whether the previous and next funds which the fund managers manage belonge to the same fund company or not. Regarding the managers who change jobs to the other fund companies, the PR value of previous funds which they manage is above average (exceeding PR 50), which is better than that (less than PR 50) of the fund managers who stay at the same fund companies. Moreover, the retun and stock picking abilty of the next funds which the fund manager who change jobs to the other fund companies manages are better than those of the fund managers who stay at the same companies.
Table 3 demonstrates the ratio of becoming winners of the next funds which the winner fund managers manage. If we define top 20% of performance as winners, the winner ratio in our sample should be 20%. The higher (lower) ratio than 20% means the fund managers in our sample perform better (worse) than the average. In addition to the whole sample, in Table 3, we also divide funds into two groups based on whether the previous and next funds which the fund managers manage belong to the same fund company or not. Regarding the statistics of the whole sample, Table 3 shows that the ratio of return and timing winner fund managers continuing to be the winners is higher than the average. The ratio of becoming winners of the next funds which the winner fund managers who change jobs to the other company manage is higher than the average (20%), while the ratio is mostly lower than the average (20%) (except for the timing ability) for the the next funds which the winner fund managers who stay at the same fund company. Generally, except for timing ability, winner managers who change jobs to the other fund companies seems to perform better than those who stay at the same fund companies.
Table-2. The Performance PR (Percentile Rank) Value of the Previous and Next Funds
The whole sample The two funds belonging to different fund companies
The two funds belonging to the same fund company
Average PR of previous funds
Average PR of next funds
Average PR of previous funds
Average PR of next funds
Average PR of previous funds
Average PR of next funds
Return 49 45 52 46 47 44
Timing 51 52 52 50 50 54
Stock picking 49 45 51 46 48 44
other 49 45 50 46 49 44
Table-3. The Ratio of Becoming Winners of the Next Funds
The whole sample
The whole funds belonging to different fund companies
The two funds belonging to the same fund company
return 26.0% 32.1% 18.6%
timing 22.0% 20.0% 23.9%
stock picking 18.7% 22.0% 14.6%
other 23.0% 27.7% 17.5%
Source: Taiwan Economic Journal and Fund DJ
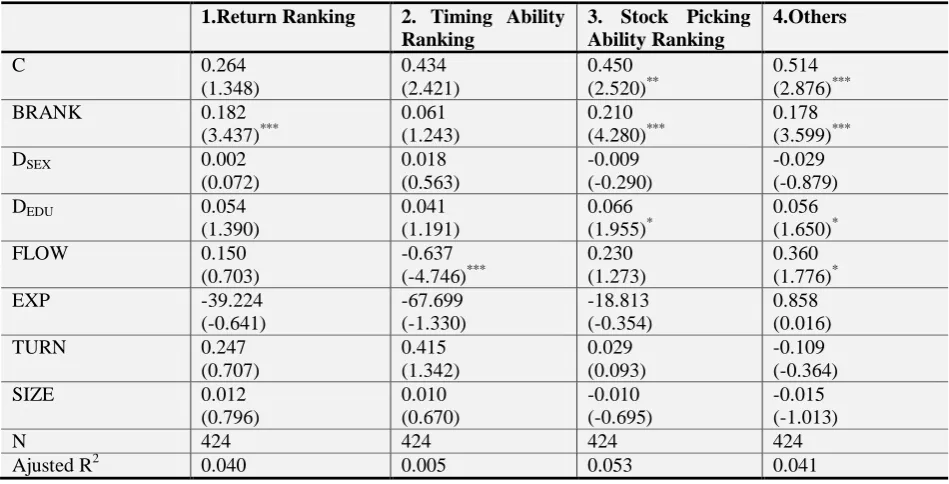
Table 4 aims to investigate the persistence of performance, timing ability and stock picking ability of fund managers by observing the previous and next funds the fund managers manage. The sample of Table 4 is the funds managed by the whole fund managers. The coefficients of BRANK in Models 1 and 3 are significantly positive, indicting the return and stock picking ability persistence of the previous and next funds. However, the statistics in Model 2 shows that the timing ability of fund managers are not persistent. It is noteworthy that the coefficient of FLOW in Model 2 is significantly negative. Edelen (1999); Green and Hodges (2002); Rakowski (2003) suggest that the variation of fund flows raises the cost of managing the funds. The result of our study supports this point. Too many inflows interrupt the timing plan of fund managers because they should invest securities to the minimum requirement of 70%. The coefficient of DEDU in Model 3 is significantly positive, which is consistent with Golec
(1996). Golec (1996) finds better performance of fund managers with MBA degree, indicating the better stock
picking ability of fund managers with higher educational background.
In Table 5, we divide funds into two groups based on whether the previous and next funds which the fund managers manage belong to the same fund company or not. The statistics shows that the two coefficients of BRANK in Model 3 are significantly positive, which indicates that the stock picking ability of the two funds which the fund managers manage are persistent no matter the fund managers change their jobs to the other fund company or not. Fund managers are timing ability persistent when the succesive funds they manage belong to the same fund company, while they are return persistent when the two funds they manage do not belong to the same fund company.
Table-4. The Persistence of Fund Return, Timing Ability and Stock Picking Ability of the Successive Funds Which Fund Managers Manage 1.Return Ranking 2. Timing Ability
Ranking
3. Stock Picking Ability Ranking
4.Others
C 0.264
(1.348)
0.434 (2.421)
0.450 (2.520)**
0.514 (2.876)***
BRANK 0.182
(3.437)***
0.061 (1.243)
0.210 (4.280)***
0.178 (3.599)***
DSEX 0.002
(0.072)
0.018 (0.563)
-0.009 (-0.290)
-0.029 (-0.879)
DEDU 0.054
(1.390)
0.041 (1.191)
0.066 (1.955)*
0.056 (1.650)*
FLOW 0.150
(0.703)
-0.637 (-4.746)***
0.230 (1.273)
0.360 (1.776)*
EXP -39.224
(-0.641)
-67.699 (-1.330)
-18.813 (-0.354)
0.858 (0.016)
TURN 0.247
(0.707)
0.415 (1.342)
0.029 (0.093)
-0.109 (-0.364)
SIZE 0.012
(0.796)
0.010 (0.670)
-0.010 (-0.695)
-0.015 (-1.013)
N 424 424 424 424
Ajusted R2 0.040 0.005 0.053 0.041
Table-5. The Persistence of Fund Return, Timing Ability and Stock Picking Ability of the Successive Funds which Fund Managers Manage (change jobs to the other fund company or not)
1.Return Ranking 2. Timing Ability Ranking
3. Stock Picking Ability Ranking 4.Others Different fund companies The same fund company Different fund companies The same fund company Different fund companies The same fund company Different fund companies The same fund company
C 0.440
(1.553) 0.107 (0.417) 0.558 (2.239)** 0.249 (0.986) 0.632 (2.516)** 0.287 (1.114) 0.686 (2.829)*** 0.360 (1.350)
BRANK 0.292
(4.900)*** 0.066 (0.959) 0.014 (0.192) 0.115 (1.664)* 0.247 (3.611)*** 0.175 (2.470)** 0.215 (3.095)*** 0.157 (2.229)**
DSEX -0.008
(-0.194) -0.004 (-0.094) 0.013 (0.286) 0.026 (0.544) 0.018 (0.388) -0.039 (-0.834) -0.016 (-0.346) -0.046 (-0.938)
DEDU 0.135
(3.092)*** -0.026 (-0.535) 0.019 (0.401) 0.062 (1.254) 0.072 (1.347) 0.060 (1.356) 0.077 (1.513) 0.037 (0.811)
FLOW -0.155
(-1.314) 1.958 (2.401)** -0.598 (-3.859)*** 0.149 (0.199) 0.053 (0.438) 1.803 (2.324)** 0.122 (1.076) 2.143 (2.548)**
EXP -152.263
(-1.773)* 130.877 (1.328) -22.933 (-0.374) -42.019 (-0.497) -82.660 (-1.152) 92.382 (1.033) -92.450 (-1.299) 138.428 (1.599)
TURN 0.818
(1.624) -0.642 (-1.185) 0.054 (0.141) 0.333 (0.658) 0.326 (0.736) -0.537 (-1.053) 0.402 (0.910) -0.862 (-1.825)*
SIZE 0.001
(0.053) 0.015 (0.766) -0.005 (-0.255) 0.021 (1.015) -0.022 (-0.988) -0.007 (-0.306) -0.022 (-1.028) -0.016 (-0.725)
N 215 209 215 209 215 209 215 209
Ajusted R2
0.120 0.011 0.0001 0.003 0.054 0.047 0.040 0.043
Note: The statistics in the parentheses is t value.* significant at 0.10 level, **significant at 0.05 level, ***significant at 0.01 level.
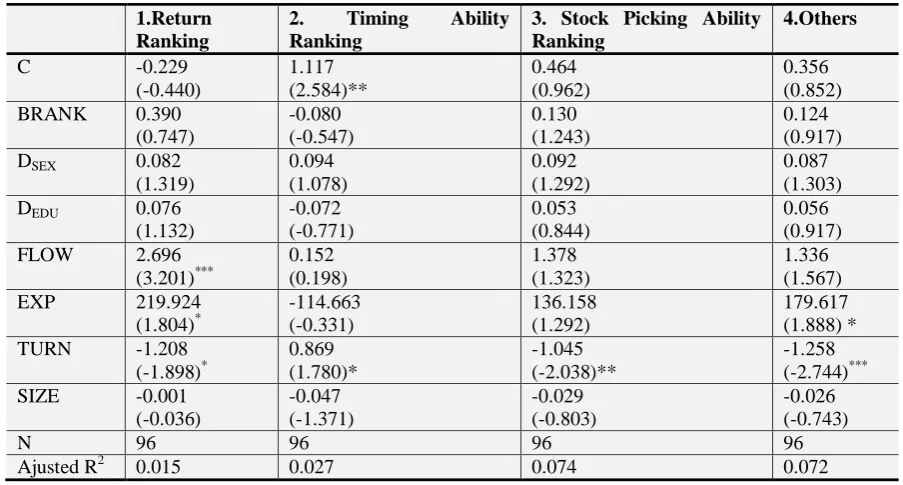
Table 6 investigates the persistence of return, timing ability and stock picking ability of the two successive funds which the winner fund managers manage. The striking results are the insignificant coefficients of BRANK, which indicates that the winner fund managers are not performance (return, timing ability and stock picking ability) persistent.
Table-6. The Persistence of Returns, Timing Ability, Stock Picking Ability of Winner Fund Managers 1.Return
Ranking
2. Timing Ability Ranking
3. Stock Picking Ability Ranking
4.Others
C -0.229
(-0.440) 1.117 (2.584)** 0.464 (0.962) 0.356 (0.852)
BRANK 0.390
(0.747) -0.080 (-0.547) 0.130 (1.243) 0.124 (0.917)
DSEX 0.082
(1.319) 0.094 (1.078) 0.092 (1.292) 0.087 (1.303)
DEDU 0.076
(1.132) -0.072 (-0.771) 0.053 (0.844) 0.056 (0.917)
FLOW 2.696
(3.201)*** 0.152 (0.198) 1.378 (1.323) 1.336 (1.567)
EXP 219.924
(1.804)* -114.663 (-0.331) 136.158 (1.292) 179.617 (1.888) *
TURN -1.208
(-1.898)* 0.869 (1.780)* -1.045 (-2.038)** -1.258 (-2.744)***
SIZE -0.001
(-0.036) -0.047 (-1.371) -0.029 (-0.803) -0.026 (-0.743)
N 96 96 96 96
Ajusted R2 0.015 0.027 0.074 0.072
Porter and Trifts (2012) demonstrate that although the well-performing fund managers have fine reputation, they cannot keep their excellent performance. The result of Table 6 supports this point. The statistics in Model 1 of Table 6 shows that the net flow rate and expense rate affect the return of the next fund positively, while the turnover rate affects the return negatively.
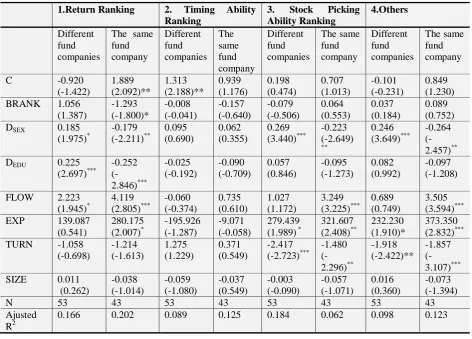
In Table 7, we divide funds into two groups based on whether the previous and next funds which the winner fund managers manage belong to the same fund company or not. The coefficients of BRANK regarding the timing and stock picking ability in Table 7 are not significant. This result indicates that the timing ability and stock picking ability of the next funds the winner fund managers manage are not persistent no matter the sucessive two funds they manage are at the same fund company or not. It is noteworth that the return of the next fund the winner fund managers manage reverses when the two funds belong to the same fund company. The coefficient of BRANK is -1.293 and the t value is -1.8, which is significantly negative. Obviously, investors should not rely on winner fund managers too much. We further find that the male winner fund managers or the winner fund managers with Master‟s or Doctoral degree who stay at the same fund company perform worse in the next funds they manage. However, the winner fund managers get benefit from such characteristic mentioned above when they manage the next funds in another fund company. This phenomenon indicates that if the fund companies want to recruit winner fund managers from other fund companies, they should choose male fund managers with higher education background.
Table-7. The Persistence of Fund Return, Timing Ability and Stock Picking Ability of Winner Fund Managers (change jobs to the other fund company or not)
1.Return Ranking 2. Timing Ability Ranking
3. Stock Picking Ability Ranking
4.Others
Different fund companies
The same fund company Different fund companies The same fund company Different fund companies The same fund company Different fund companies The same fund company
C -0.920
(-1.422) 1.889 (2.092)** 1.313 (2.188)** 0.939 (1.176) 0.198 (0.474) 0.707 (1.013) -0.101 (-0.231) 0.849 (1.230)
BRANK 1.056
(1.387) -1.293 (-1.800)* -0.008 (-0.041) -0.157 (-0.640) -0.079 (-0.506) 0.064 (0.553) 0.037 (0.184) 0.089 (0.752)
DSEX 0.185
(1.975)* -0.179 (-2.211)** 0.095 (0.690) 0.062 (0.355) 0.269 (3.440)*** -0.223 (-2.649) ** 0.246 (3.649)*** -0.264 (-2.457)**
DEDU 0.225
(2.697)*** -0.252 (-2.846)*** -0.025 (-0.192) -0.090 (-0.709) 0.057 (0.846) -0.095 (-1.273) 0.082 (0.992) -0.097 (-1.208)
FLOW 2.223
(1.945)* 4.119 (2.805)*** -0.060 (-0.374) 0.735 (0.610) 1.027 (1.172) 3.249 (3.225)*** 0.689 (0.749) 3.505 (3.594)***
EXP 139.087
(0.541) 280.175 (2.007)* -195.926 (-1.287) -9.071 (-0.058) 279.439 (1.989) *
321.607 (2.408)** 232.230 (1.910)* 373.350 (2.832)***
TURN -1.058
(-0.698) -1.214 (-1.613) 1.275 (1.229) 0.371 (0.549) -2.417 (-2.723)*** -1.480 (-2.296)** -1.918 (-2.422)** -1.857 (-3.107)***
SIZE 0.011
(0.262) -0.038 (-1.014) -0.059 (-1.080) -0.037 (0.549) -0.003 (-0.090) -0.057 (-1.071) 0.016 (0.360) -0.073 (-1.394)
N 53 43 53 43 53 43 53 43
Ajusted R2
0.166 0.202 0.089 0.125 0.184 0.062 0.098 0.123
Note: The statistics in the parentheses is t value.* significant at 0.10 level, **significant at 0.05 level, ***significant at 0.01 level.
4.2. Robustness Test
are perfromance (return , timing, stock picking) winners. The coefficient of DBWIN in Model 1of Table 8 is
significantly positive, which indicates that the probability of becoming performance winners of the next funds the fund managers manage is higher when the previous funds they manage are return winners (DBWIN =1). However, the
coefficients of DBWIN in Models 2 and 3are insignificantly positive, which indicates that the better timing and stock
picking ability of previous funds of fund managers does not guarentee the ability persistenc of next funds.
Table-8. The Probability of Becoming Performance (Return, Timing Ability, Stock Picking Ability) Winners of the Next Funds the Winner Fund Managers Manage
1.Return Winners 2. Timing Ability Winners
3. Stock Picking Ability Winners
4. Cross Winners
C -3.683
(-1.755)* -1.584 (-0.971) -0.467 (-0.236) -0.397 (-0.197)
DBWIN 0.981
(3.209)*** 0.228 (0.779) 0.447 (1.355) 0.848 (2.680)***
DSEX 0.584
(1.421) 0.154 (0.517) 0.295 (0.819) 0.176 (0.495)
DEDU 0.490
(1.191) 0.464 (1.370) 0.223 (0.589) 0.291 (0.737)
FLOW 9.083
(1.557) -8.319 (-2.219)** 8.916 (1.457) 15.022 (2.472)**
EXP 279.748
(0.414) -713.051 (-1.216) -147.485 (-0.210) 395.545 (0.578)
TURN -1.068
(-0.277) 4.226 (1.217) -0.152 (-1.028) -4.206 (-1.103)
SIZE 0.028
(0.172) 0.057 (0.473) 0.449 (0.111) -0.205 (-1.353)
N 424 424 424 424
LR 20.906 9.830 7.153 16.546
MacFadden R2 0.060 0.023 0.020 0.047
Note: The statistics in the parentheses is z value.* significant at 0.10 level, **significant at 0.05 level, ***significant at 0.01 level.
Table-9. The Probability of Becoming Performance (Return, Timing Ability, Stock Picking Ability) Winners of the Next Funds the Winners Fund Managers Manage (change jobs to the other fund company or not)
1.Return Winners 2. Timing Ability Winners
3. Stock Picking Ability Winners
4. Cross Winners
Different fund companies
The same fund company
Different fund companies
The same fund company
Different fund companies
The same fund company
Different fund companies
The same fund company
C -7.811
(-2.142)** -0.463 (-0.153) -0.007 (-0.003) -2.533 (-1.127) -0.757 (-0.284) 1.027 (0.341) -0.549 (-0.217) 1.610 (0.491)
DBWIN 1.154
(2.904)*** 0.794 (1.620) 0.179 (0.417) 0.246 (0.603) 0.571 (1.378) 0.305 (0.555) 0.950 (2.400)** 0.742 (1.321)
DSEX 0.853
(1.342) 0.104 (0.180) 0.179 (0.407) 0.105 (0.247) 0.522 (1.003) -0.037 (-0.077) -0.057 (-0.125) 0.557 (1.117)
DEDU 2.561
(2.120)** -0.657 (-1.335) 0.437 (0.895) 0.438 (0.942) 0.393 (0.708) -0.010 (-0.019) 0.215 (0.416) 0.458 (0.704)
FLOW 17.876
(2.279)** 3.361 (0.324) -13.127 (-1.929)* 2.776 (0.413) 5.102 (0.740) 12.225 (1.189) 5.705 (0.796) 25.430 (2.630)***
EXP 580.135
(0.571) -13.471 (-0.011) -538.576 (-0.569) -380.034 (-0.513) -556.126 (-0.599) -297.252 (-0.264) -575.895 (-0.633) 283.112 (0.263)
TURN -2.560
(-0.431) 1.508 (0.225) 0.794 (0.149) 3.367 (0.822) 2.965 (0.527) 1.297 (0.212) 3.084 (0.568) -6.809 (-1.104)
SIZE 0.211
(0.922) -0.185 (-0.863) -0.102 (-0.546) 0.108 (0.631) -0.082 (-0.415) -0.260 (-1.112) -0.046 (-0.242) -0.390 (-1.497)
N 215 209 215 209 215 209 215 209
LR 29.976 6.643 14.444 4.667 5.911 3.689 7.496 16.601
MacFadden R2 0.154 0.045 0.070 0.021 0.030 0.023 0.039 0.105
In Table 9, we further divides funds into two groups based on whether the previous and next funds which the winner fund managers manage belong to the same fund company or not. The statistics demonstates that the probability of becoming timing or stock picking winners of the next funds the timing or stock picking winner managers manage is not significantly higher. Regarding the return winners, we find that the next funds have the higher probability to become the return winners if the succesive two funds the return winner fund managers manage belong to the different fund companies.
5. CONCLUSIONS
Past literature regarding the timing and stock picking ability (Grinblatt and Titman, 1993; Daniel et al., 1997;
Bhojraj et al., 2012) or the persistence of these abilities (Fulkerson, 2013) are at the standpoint of mutual funds. Little
literature investigates whether the timing and stock picking ability of the successive funds which the fund managers manage is persistent. That is, little literature investigates the management skill at the standpoint of “fund managers”. This study fills the gap of literature by adopting the two successive funds which are managed by the same winner fund managers as the sample to investigate whether the excellent timing and stock picking ability of winner “fund managers” is persistent or their good performance is just from good luck (Kosowski et al., 2006).
Regarding the whole fund managers, we find that the successive two funds they manage are performance persistent. Moreover, the stock picking ability of the two funds they manage is persistent no matter the two funds belonging to the same fund company or not. Regarding the winner fund manager, we find no persistence of return, timing ability and stock picking ability. No matter the winner fund managers change the jobs to the other fund companies or not, the next funds the winner fund managers manage are not timing and stock picking ability persistent. The result of logistic regression also demonstrates that the probability of becoming timing or stock picking winners of the next funds which the timing or stock picking fund managers manage is not significantly higher than other funds. This study focuses on the timing and stock picking ability of “fund managers”. The implications are as follows: 1. For fund companies, it is not necessary to recruit winner fund managers. Fund companies may pay more for the winner fund managers because of the good timing and stock picking ability of their previous funds. However, they cannot keep their excellent management ability, which will not necessarily bring positive influence on the fund companies. 2. For fund investors, when they are making investing choice, it is not necessary for them to follow the timing and stock picking winner fund managers. The performance of the next funds which the winner fund managers manage may reverse especially for the successive two funds belonging to the same fund company.
The evaluation of the timing and stock picking ability of this study is limited because only top 10 stock holdings are announced by the fund companies every month. And only stocks which market value in excess of 1% of the fund net assets are announced every quarter. This study therefore cannot collect the complete holding stocks of funds, which impedes our adopting of the stock holding approach. The following researchers may test whether the result of this study is robust if they have the holding data of funds every month.
Funding: This study received no specific financial support.
Competing Interests: The authors declare that they have no competing interests.
Contributors/Acknowledgement: Both authors contributed equally to the conception and design of the study.
REFERENCES
Amihud, Y. and R. Goyenko, 2013. Mutual fund‟s R2 as predictor of performance. Review of Financial Studies, 26(3): 667-695.
View at Google Scholar
Baker, M., L. Litov, J. Watcher and J. Wurgler, 2010. Can mutual fund managers pick stocks? Evidence from their trades prior to
earnings announcements. Journal of Financial and Quantitative Analysis, 45(5): 1111-1131. View at Google Scholar | View at
Becker, C., W. Ferson, D. Myers and M. Schill, 1999. Conditional market timing with benchmark investors. Journal of Financial
Economics, 52(1): 119-148.View at Google Scholar | View at Publisher
Berk, J. and R. Green, 2004. Mutual fund flows and performance in rational markets. Journal of Political Economy, 112(6):
1269-1285.View at Google Scholar | View at Publisher
Bhojraj, S., Y.J. Cho and N. Yehuda, 2012. Mutual fund family size and mutual fund performance: The role of regulatory changes.
Journal of Accounting Research, 50(3): 647-684.View at Google Scholar | View at Publisher
Bollen, N. and J. Busse, 2001. On the timing ability of mutual fund managers. Journal of Finance, 56(3): 1075-1094. View at Google
Scholar
Brinson, G.P., L.R. Hood and G.L. Beebower, 1986. Determinants of portfolio performance. Financial Analysts Journal, 42(4):
39-44.View at Google Scholar | View at Publisher
Brinson, G.P., B.D. Singer and G.L. Beebower, 1991. Determinants of portfolio performance ii : An update. Financial Analysts
Journal, 47(3): 40-48.View at Google Scholar | View at Publisher
Carhart, M.M., 1997. On persistence in mutual fund performance. Journal of Finance, 52(1): 57-82.View at Google Scholar
Chen, B.J., H. Hong, M. Huang and J.D. Kubik, 2004. Does fund size erode mutual fund performance? The role of liquidity and
organization. American Economic Review, 94(5): 1276-1302.View at Google Scholar
Christoffersen, S.E.K., D.B. Keim and D.K. Musto, 2007. Valuable information and costly liquidity: Evidence from individual mutual fund trades, Working Paper. University of Pennsylvania.
Cohen, R., C. Polk and B. Silli, 2011. Best ideas. London School of Economics. Retrieved from personal.lse.ac.uk/polk/research/bestideas.pdf.
Cremers, M. and A. Petajisto, 2009. How active is your fund manager ? A new measure that predicts performance. Review of
Financial Studies, 22(9): 3329-3365.View at Google Scholar | View at Publisher
Daniel, K., M. Grinblatt, S. Titman and R. Wermers, 1997. Measuring mutual fund performance with characteristic-based
benchmarks. Journal of Finance, 52(3): 1035-1058.View at Google Scholar | View at Publisher
Edelen, R.M., 1999. Investor flows and the assessed performance of open-end mutual funds. Journal of Financial Economics,
53(5): 439-466.View at Google Scholar | View at Publisher
Elton, E.J., M.J. Gruber and C.R. Blake, 2012. An examination of mutual fund timing ability using monthly holding data. Review
of Finance, 16(3): 619-645.View at Google Scholar
Fama, E.F. and K.R. French, 2010. Luck versus skill in the cross-section of mutual fund returns. Journal of Finance, 65(5): 1915–
1947.View at Google Scholar | View at Publisher
Ferson, W.E. and W.R. Schadt, 1996. Measuring fund strategy and performance in changing economic conditions. Journal of
Finance, 51(2): 425-461.View at Google Scholar | View at Publisher
Fulkerson, J.A., 2013. Is timing everything ? The value of mutual fund manager trades. Financial Management, 42(2): 243-261.
View at Google Scholar | View at Publisher
Golec, J.H., 1996. The effects of mutual fund managers‟ characteristics on their portfolio performance, risk and fees. Financial
Services Review, 5(2): 133-148.View at Google Scholar | View at Publisher
Graham, J. and C. Harvey, 1996. Market timing ability and volatility implied in investment newsletters‟ asset allocation
recommendations. Journal of Financial Economics, 42(3): 397–422.View at Google Scholar | View at Publisher
Green, J. and C. Hodges, 2002. The dilution impact of daily fund flows on open-end mutual funds. Journal of Financial
Economics, 65(1): 131-158.View at Google Scholar | View at Publisher
Grinblatt, M. and S. Titman, 1989. Mutual fund performance: An analysis of quarterly portfolio holdings. Journal of Business,
62(3): 393-416. View at Google Scholar | View at Publisher
Grinblatt, M. and S. Titman, 1993. Performance measurement without benchmarks: An examination of mutual fund returns.
Journal of Business, 66(1): 47-68.View at Google Scholar | View at Publisher
Huang, J., C. Sialm and H. Zhang, 2011. Risk shifting and mutual fund performance. Review of Financial Studies, 24(8):
Jan, Y.C. and M.W. Hung, 2003. Mutual fund attributes and performance. Financial Services Review, 12(2): 165-178. View at Google
Scholar
Kacperczyk, M. and A. Seru, 2007. Fund manager use of public information: New evidence on managerial skills. Journal of
Finance, 62(2): 485-528.View at Google Scholar | View at Publisher
Kacperczyk, M., C. Sialm and L. Zheng, 2005. On the industry concentration of actively manage equity mutual funds. Journal of
Finance, 60(4): 1983-2012.View at Google Scholar | View at Publisher
Kacperczyk, M., C. Sialm and L. Zheng, 2008. Unobserved actions of mutal funds. Review of Financial Studies, 21(16):
2379-2416.View at Google Scholar | View at Publisher
Kacperczyk, M., S. Van Nieuwerburgh and L. Veldkamp, 2014. Time-varying fund manager skill. Journal of Finance, 69(4):
1455-1484.View at Google Scholar | View at Publisher
Koijen, R.S.J., 2014. The cross-section of managerial ability, incentives, and risk preferences. Journal of Finance, 69(3):
1051-1098.View at Google Scholar | View at Publisher
Kosowski, R., A. Timmermann, R. Wermers and H. White, 2006. Can mutual fund “stars” really pick stocks? New evidence from
a bootstrap analysis. Journal of Finance, 61(6): 2551-2595.View at Google Scholar | View at Publisher
Porter, G.E. and J. Trifts, 2012. The best mutual fund managers: Testing the impact of experience using a survivorship bias free
dataset. Journal of Applied Finance, 22(1): 105-117.View at Google Scholar
Puetz, A. and S. Ruenzi, 2011. Overconfidence among professional investors: Evidence from mutual fund managers. Journal of
Business & Accounting, 38(5 & 6): 684-712.View at Google Scholar | View at Publisher
Rakowski, D., 2003. Fund flow volatility and performance. Georgia State University.
Wermers, R., 1997. Momentum investment strategies of mutual funds, performance persistence, and survivorship bias, Working Paper. Boulder: University of Colorado.
Wermers, R., 2000. Mutual fund performance: An empirical decomposition into stock-picking talent, style, transactions costs, and
expenses. Journal of Finance, 55(4): 1655-1695.View at Google Scholar | View at Publisher
Yan, X., 2008. Liquidity, investment style, and the relation between fund size and fund performance. Journal of Financial and
Quantitative Analysis, 43(3): 741-768.View at Google Scholar | View at Publisher