Comparison of Iris Recognition Using Gabor
Wavelet, Principal Component Analysis and
Independent Component Analysis
Sarita G.Firake1, Prof. Dr. P.M. Mahajan2
M.E. Student, Department of E & TC, J. T. Mahajan College of Engineering, Faizpur, India
Professor, Department of E & T C, J. T. Mahajan College of Engineering, Faizpur, India
ABSTRACT: Authentication is a first line of defence against intruders in ever increasing number of systems. The uniqueness of the iris, stability over period of time, low probability of error contributes to the benefits of using iris recognition technology. In order to use iris for authentication, it is important to extract the iris information content from human eyes in well manner. Traditional iris recognition is performed by applying the Gabor wavelets to portion of the iris which gives 2048 bits iris code for comparison purpose.ICA finds a set of independent components whereas PCA finds principal components that are critical for iris recognition. In this research, we are going to compare feature extraction algorithm based on Gabor Wavelet, PCA and ICA. Canny edge detection along with circular Hough transform is used for segmentation of iris images. Images then normalized and features are extracted depending on the steps involved in the algorithms of GW, PCA, and ICA. Finally iris patterns are compared by finding difference between input test image and database image to authenticate the person. Performance is evaluated based on the recognition rate for all three methods and result shows that Gabor wavelets have highest recognition rate as compared to other two methods.
KEYWORDS: Gabor Wavelet, Principal Component Analysis (PCA), Independent Component Analysis (ICA), Log Gabor Wavelet, Euclidean Distance, Hamming Distance.
I. INTRODUCTION
The great variety of automated biometric based identification (many to one) or verification (one to one) are commercially available [1].Most traditional user authentication schemes are based on what a person possesses (a physical key, identification cards, tokens etc.) or what a person knows (passwords, secret codes etc.). But passwords or secret codes can be cracked or maybe manipulated. Also keys may be lost, ID cards may be forged by robbing or copying. Comparing with these issues, biometric technologies offer more secure and comfortable accessibility. Unlike other biometrics such as fingerprints and face, the distinct aspect of iris comes from randomly distributed features that lead to its high reliability for personal identification reliable as it contains unique texture and is complex enough to be used as a biometric signature [2].Several studies have shown that the general structure of the iris is genetically determined and critically dependent on initial conditions in the embryonic mesoderm from which develop. This means that the probability of finding two people with identical iris patterns is almost zero. Therefore, there are not ever two irises alike, not even for identical twins [3].
The remainder of this paper is organized as follows: Section 2 briefly discusses the previous work done and Iris recognition system is described in section 3. A detailed description of the feature extraction based on Gabor Wavelet, PCA and ICA is given in Section 4. Section 5 reports experimental results.
II.PREVIOUS WORK
guaranteed to pass whenever the phase codes for two different eyes are compared, but it uniquely fails when any eye’s phase code is compared with another version of itself. Importance of iris is well described in [2].Each iris is distinctive and, like fingerprints, even the irises of identical twins are different. It is extremely difficult to surgically tamper the texture of the iris. Further, it is rather easy to detect artificial irises (e.g., designer contact lenses). Although, the early iris-based recognition systems required considerable user participation and were expensive, the newer systems have become more user-friendly and cost effective. This process is well explained in [3]. It states that to capture the rich details of iris patterns, an imaging system should resolve a minimum of 70 pixels in iris radius. Well-known methods such as the Integro-differential, Hough transform and active contour models have been successful techniques in detecting the boundaries. He observed HDs computed between 7,070 different pairs of same eye images at different times, under different conditions, and usually with different cameras; and the right distribution gives the same 2.3 million comparisons among different eyes [1]. Eyelids and eyelashes are the noise factors in the iris image which must have to be removed from the iris image and required procedure is studied well in [4].
Gabor wavelets invented by Dennis Gabor [5] which was observed to be able to achieve the best resolution in both time and frequency domain. Gabor Wavelet is used for feature extraction by considering histogram of specimen image for pupil centre. The main idea of this method is that: firstly construct two-dimensional Gabor filter, and use it to filter these images, and after we get phase information [6]. Feature extraction method is proposed in [7] which are based on texture analysis using bank of Gabor filters to capture both local and global details in an iris and get the feature value as the Average Absolute Deviation (AAD) of each filtered image constitutes the components of our feature vector. Turk.et.al [8] developed Principal Component Analysis based face recognition using Eigen face techniques He developed a system by projecting face images onto a feature space that spans the significant variations among known face images. Similar approach is used in this work for iris recognition and results are obtained successfully. Bae.et.al [9], proposed a method for iris feature extraction which made use of ICA to find linear transform for the iris signal using a set of bases as statically independent as possible. They made use of the independent component analysis (ICA) to generate optimal basis functions to extract the features which represent the iris signals efficiently. Aapo.et.al[10] explained basic theory of ICA, method for data analysis, is applied for extracting the features for iris region of interest that are statistically independent.
III.IRIS RECOGNITION SYSTEM
Database stores the features extracted from different irises. Those features are compared for recognition purpose.Fig.1 shows a typical Iris Recognition System. It has four main sections, Image acquisition, Image pre processing, Feature extraction and Recognition.
Fig.1. Block diagram of Iris Recognition
A. Image Acquisition
A monochrome CCD camera can be used to capture the rich details of iris pattern. Acquired iris images must have sufficient resolution, sharpness to support recognition, good contrast.
B. Iris image pre-processing
Iris Segmentation: The segmentation is a crucial step in that any false representation here may corrupt the resulting template in poor recognition rates. Segmentation procedure involves two procedures: iris localization and noise reduction for finding the region of interest in iris image. The iris localization process takes the acquired image and detects the inner boundary (between the pupil- iris) by thresholding and the outer boundary (between the iris-sclera) by maximizing changes of the perimeter-normalized sum of gray level values along the circle. The noise reduction process refers to localizing the iris from the noise (pupil, sclera, eyelids, eyelashes, and artifacts) in the image and it is done by applying Hough transform as shown in Fig.2.
Fig.2. Segmented Iris with detected noise
Image normalization: It is process of unwrapping the detected iris, which transforms the circular iris into a rectangular image as shown in the Fig.3 by the use of Daugman’s Rubber sheet model.
Fig.3. Daugman’s Rubber sheet model
To accomplish this kind of normalization, every pixel in iris area is defined by two normalized polar coordinates (r, θ) where 0 < r < 1 and 0 < θ <360.
Iris enhancement: This is done by local histogram equalization and noise is removed by low pass filter.
C. Feature Extraction
It is the process of extracting the patterns of iris taking into account the correlation between the adjacent pixels. In order to provide accurate recognition of individuals, the most discriminating information present in an iris pattern is extracted and template representing iris pattern is created. Only the significant features of the iris are encoded so that comparisons between templates can be made. The prominent methods used for this extraction in this paper are Gabor wavelet, Principal Component Analysis, Independent Component Analysis and will be described in detail later.
D. Matching
This is done by comparison of iris template with the other template stored in database for making decision about the person who claims a particular identity. For comparing the templates Hamming Distance, Euclidean distance defining the closeness of match between two iris templates are used. Formula for finding Hamming Distance is given as
Hamming Distance = Difference between bits of two iris template /Length of vector.
IV.PROPOSED APPROACH
A. Feature Extraction using Gabor wavelet
The Gabor wavelet is a linear filter whose impulse response is defined by a harmonic function multiplied by a Gaussian function. Unlike Fourier analysis that determines a global frequency domain representation of the entire image, Gabor filters estimate the strength of certain frequency bands and orientations at each location in the image, giving a result in the spatial domain. The traditional iris recognition system makes use of a decomposition of a signal derived from application of two dimensional Gabor filters. But when the bandwidth is larger than one octave, even symmetric Gabor filter will have a DC component. However, Log Gabor can cover large frequency space while still maintaining a zero DC component. Therefore the background brightness will not affect the extraction of the pure phase information of iris texture. So on the linear frequency scale; log Gabor having transfer functions of the form is used.
eq. (1)
Where f0 is the centre frequency of filter and σ is the bandwidth of filter. The centre frequency of the filter is specified by the frequency of the sine/cosine wave, and the bandwidth of the filter is specified by the width of the Gaussian. Log-Gabor wavelets are used to encode each row of image and next phase is quantized into four levels. To extract features from iris image, row-by-row convolution with filter is done which generates complex valued projection coefficients; let G(x+iy) whose real and imaginary parts specify the coordinates of a phaser in the complex plane.
g(Re, Im) = G(x+iy) eq. (2)
Where g(Re,Im) is a complex-valued bit whose real and imaginary parts are either 1or 0 and it is summarized in Table I. The phase information, rather than amplitude information provides the most important information within an image. The angle of each phasor is quantized to one of the four quadrants, setting two bits of phase information.
TABLE I. Setting the bits in the iris code
Bit Coefficients
gRe= 1 if Real [G(x+iy)] > 0
gRe= 0 if Real [G(x+iy)] < 0
gIm = 1 if Imaginary [G(x+iy)] > 0
gIm = 0 if Imaginary [G(x+iy)] < 0
The binary phase representation of each complex value is used as the feature template (iris template) and corresponding noise mask with the help of coding sequence given Fig.4. The four quadrants are represented using two bits of phase information data, so each pixel in the normalized iris pattern corresponds to two bits of data in the iris template. Only the phase information is encoded as it carries the unique iris information.
B. Feature Extraction using Principal Component Analysis
It involves a mathematical procedure that transforms a number of (possibly) correlated variables into a (smaller) number of uncorrelated variables called principal component which can be used to reconstruct all of the information within a data set, and can be tested to which level a test image couples with an image of a training set. The first principal component accounts for as much for as much of the variability in the data as possible, and each succeeding component accounts for as much of the remaining variability as possible. We employ PCA to extract the iris regions features. It takes the training irises as input and yields the Eigen irises as output. PCA algorithm operates in two modes:
Training mode: In this, the principal components are extracted using training data.
Step 1: Obtain an initial set of iris images and represent every image as a column vector by placing the column of an image on top of each another creating image vectors.
Step 2: Compute the average or mean image vector and build difference matrix by subtracting the mean image vector from each image vector.
Step 3: Compute the covariance matrix using difference matrix obtained above.
Step 4: Find the Eigen vectors of the co-variance matrix and sort them from high to low according to their Corresponding Eigen values.
Step 5: Choose eigenvectors that can represent the whole training set. These are known as principal components. And compute projection of training images by projecting them in iris space.
Testing mode: In this, the performance of the iris identification system is evaluated.
Step 1: Convert input test image into column vector as in training mode and subtract mean image vector from it.
Step 2: Project this image vector into iris space spanned by Eigen irises to compute its projection.
Step 3: Difference in two projections is calculated and compared with the threshold set to recognize the image.
C. Feature Extraction using Independent Component Analysis
ICA finds the independent components (latent variables or sources) by maximizing the statistical independence of the estimated components. ICA is a much more powerful technique which separates independent sources linearly mixed in several sensors and capable of finding the underlying factors or sources when these classic methods fail completely. Pre-processing is required for ICA because it is important for fetching independent components from iris image. It includes Centering, PCA and whitening.
Centering: It is done by subtracting mean vector of image from each vector of the matrix so as to make all resulting vectors as zero-mean vectors. This makes the signals centered to zero and simplifies the algorithm. PCA: The goal of PCA is to find a set of orthogonal components that minimize the error in the reconstructed
data. We need the results of PCA for whitening. It involves the calculation of the PCA matrices for given data in row vectors which returns the eigenvector and diagonal Eigen value matrices.
Whitening: It means to remove any correlations in the data. It reduces the number of parameters to be estimated as it is a very simple and standard procedure. We transform the observed vector linearly to obtain white vector such that its components are uncorrelated and their variances equal unity.
Problem of ICA is inducted to how to get the basis function A and its transition matrix W and make the feature coefficient ‘s’ to meet the super-Gaussian distribution and independent, from the training samples. We have used FastICA algorithm to make ‘s’ to meet super-Gaussian distribution and perform actual estimation of feature extraction of the iris regions. We can think the iris regions like this,
where ‘x’ is a input signal row vector; A is a basis function such that it is able to capture the inherent structure of the iris texture; n is the number of basis functions; s = (s1, s2 … …sn) is coefficient row vector such that by mixing the components ‘si’, a set of compact features is created for an effective recognition task. Each of this is a feature coefficient.
Therefore ‘x’ is equal to linear superposition of A and s = (s1 ,s2 … …sn ) such that to all pictures, the basis function is same. The difference is the coefficient vector s = (s1, s2 … …sn). Therefore every picture can be denoted by its feature coefficient vector. We suppose A is a invertible matrix. So based on eq. (3), we get this
s = Wx eq. (4)
Where ‘s’ is coefficient vector of the picture and W = A-1, we call it transition matrix. Every coefficient vector si can be expressed the forms that W multiply x. We need to find a good set of basis vectors to represent iris patterns effectively. The independent components are latent variables, meaning that they cannot be directly observed.
The aim of the ICA is to find a separating matrix W without any information about sources S and mixing matrix A. To obtain mixing and unmixing matrix A and W respectively; the vectors of whitened data, the whitening matrix and the dewhitening matrix are used as the input of Fast-ICA algorithm.
V.RESULTS
Experiments have been conducted on various iris images of CASIA database (version 1) [13] containing 756 iris images. This system is implemented with processor of Intel core i3-1.90 GHz, 8 GB RAM and developed in MATLAB 2013.This work is carried on various iris images of dimensions (320×280) which are further normalized to polar array of dimension (20×240) pixels. Features are extracted based on the algorithms of GW, PCA and ICA from this normalized array. For evaluation purpose hamming distance is calculated and minimum distance is used as classifier.
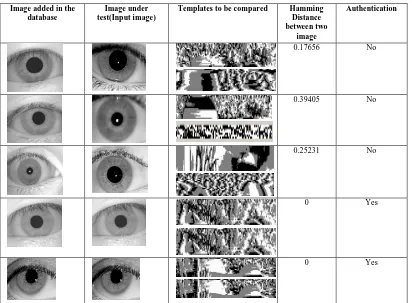
Gabor wavelet extracts phase information from iris and template of 9600 bits is calculated which is compared with templates stored in the database. Hamming distance between these two templates gives us result as authenticated if calculated hamming distance is less than threshold (0.1) otherwise iris image is unauthenticated. Results for some iris images using the Gabor Wavelet are shown in Table II.
TABLE II: Iris image authenticity using Gabor wavelet
Image added in the database
Image under test(Input image)
Templates to be compared Hamming
Distance between two
image
Authentication
0.17656 No
0.39405 No
0.25231 No
0 Yes
In another experiment, system developed for PCA is composed of two MATLAB functions (training.m) and (recognition.m) .The former fetches the Eigen vectors and the create the database of the transformed irises, while the later function is used for recognition purpose. Experiments are performed on 16 iris images of (320 ×280) size for training purpose from 2 peoples, each people contributing 8 iris images. These images are normalized into rectangular block of dimension (20×240) pixels each and later to (200×180) for further analysis. Furthermore, PCA is applied to these images to get covariance matrix and hence to calculate principal components. This work calculates four principal component or Eigen irises which are used to train the system and shown in Fig.5.
Fig.5. Four Principal components selected from 16 mean subtracted images
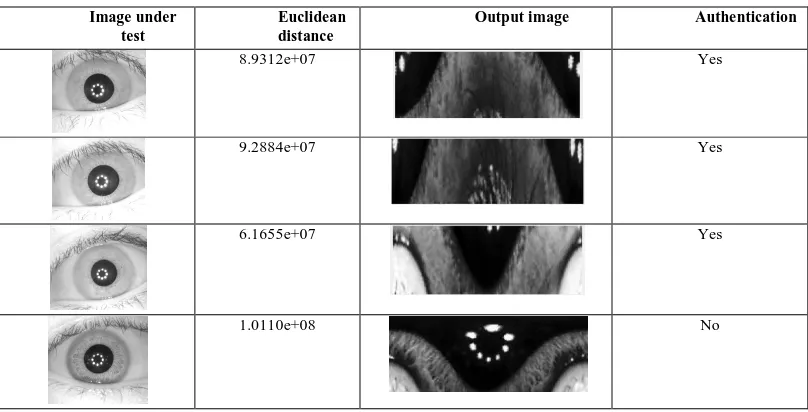
Later, Euclidean distance is been calculated between projection of training images and that of input test image (on the above selected principal components). The threshold value (1e08) is define to get authenticity of input test image. Results of these iris images are tabulated in Table III.
TABLE. III: Iris image authenticity using Principal Component Analysis
Image under test
Euclidean distance
Output image Authentication
8.9312e+07 Yes
9.2884e+07 Yes
6.1655e+07 Yes
1.0110e+08 No
Fig.6. Feature Coefficient vectors of Training dataset of 7 images
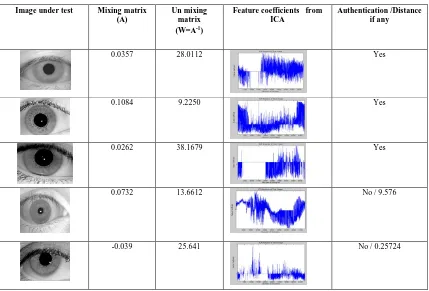
A comparison of feature coefficient vector‘s’ from training and that of test image is done. Difference of zero between these coefficients gives result of authentication whereas for some difference it is unauthorized. Using this method some of the result images for ICA are shown in Table IV.
TABLE IV: Iris image authenticity using Independent Component Analysis
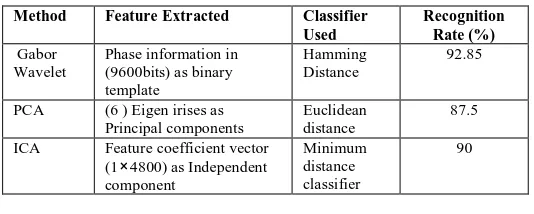
Collecting all possible views and aspects for comparison of these three methods is tabulated below in the Table V. Each method extracts the features by their own distinct way and used for the purpose of comparison.
Image under test Mixing matrix
(A)
Un mixing matrix (W=A-1)
Feature coefficients from ICA
Authentication /Distance if any
0.0357 28.0112 Yes
0.1084 9.2250 Yes
0.0262 38.1679 Yes
0.0732 13.6612 No / 9.576
TABLE V. Comparison among three methods
Method Feature Extracted Classifier
Used
Recognition Rate (%)
Gabor Wavelet
Phase information in (9600bits) as binary template
Hamming Distance
92.85
PCA (6 ) Eigen irises as
Principal components
Euclidean distance
87.5
ICA Feature coefficient vector
(1×4800) as Independent
component
Minimum distance classifier
90
VI.CONCLUSION AND FUTURE WORK
An attempt has been made in this work to compare performance of Iris Recognition based on feature extraction using Gabor wavelet, Principal Component Analysis(PCA) and Independent Component Analysis(ICA).Features of input iris image are compared with that of stored in database. Experimental results show that algorithm can effectively distinguish different persons by identifying their irises based on the different distance classifiers. Gabor wavelet shows highest Recognition rate than rest of the methods. Some more demanding conditions of image capture, such as iris on-the-move, iris at-a-distance, iris off-axis are still need attention.
REFERENCES
1. John Daugman, “The Importance of being random: Statistical Principals of Iris Recognition”, PR1656 , The Computer Laboratory, University
of Cambridge, Cambridge CB3 0FD, UK,2001, pp.1-13.
2. Anil K. Jain, Arun Ross, and Salil Prabhakar, “An Introduction to Biometric Recognition”, IEEE transactions on circuits and systems for video
technology, Vol. 14, No. 1, 2004,pp.4-20.
3. John Daugman, “High Confidence Recognition of Persons by Iris Patterns”, pp.253-263.
4. Amit Madhukar Wagh, Satish R Todmal, “Eyelids, Eyelashes Detection Algorithm and Hough Transform Method for Noise Removal in Iris
Recognition” , International Journal of Computer Applications (0975 – 8887) Vol. 112, No. 3, February 2015,pp.28-31.
5. D. Gabor, “Theory of communication”, Journal of the Institution of Electrical Engineers – Part III: Radio and Communication Engineering,
Vol.93, No.26, Nov. 1946, pp.429–457.
6. Kshamaraj Gulmire1, Sanjay Ganorkar2, “Iris Recognition Using Gabor Wavelet”, International Journal of Engineering Research &
Technology (IJERT) ISSN: 2278-0181, Vol. 1 Issue 5, July – 2012.
7. Ali Abdul Mun'im Ibrahim, “IRIS RECOGNITION USING GABOR FILTERS”, Al – Taqani, Vol.21, 2008, pp.1-5..
8. Matthew Turk and Alex Pentland, “Eigenfaces for Recognition”, Journal of Cognitive Neuroscience Volume 3, No.1, pp.71-86.
9. Kwanghyuk Bae, Seungin Noh and Jaihie Kim, “Iris Feature Extraction Using Independent Component Analysis”, Department of Electronics
Engineering Korea, pp.838-844.
10. Imen Bouraoui and Salim Chitroub, Ahmed Bouridane, “Performance Evaluation of Independent Component Analysis in an Iris Recognition
System”.
11. Aapo Hyvärinen and Erkki Oja, “Independent Component Analysis: Algorithms and Applications”, Neural Networks Research Centre Helsinki
University of Technology P.O. Box 5400, FIN-02015 HUT, Finland Neural Networks, Vol.13(4-5) , 2000, pp.411-430.
12. Jin-Xin Shi and Xiao-Feng Gu, “The Comparison of Iris Recognition Using Principal Component Analysis , Independent Component Analysis
and Gabor Wavelets”, 3rd IEEE International Conference on Computer Science and Information Technology (ICCSIT), 2010,pp. 61-64.