ABSTRACT
BRIGHT II, WALTER ANTHONY. Engineering, Feasibility and Economic Study of the Utilization of Medium-Scale Industrial Secondary Forestry Processing Residues for Energy Applications. (Under the direction of Dr. Stephen Terry.)
The purpose of this study is to examine the feasibility of converting secondary forestry processing residues from medium-sized industries into energy. Multiple solutions were found, some with paybacks under two years and savings over $2 million. A discussion of other biomass feedstocks, along with energy conversion methods and multiple applications are shown. The most feasible solutions were argued to be combustion in conjunction with process heat, a steam Rankine cycle or Combined Heat and Power.
Engineering, Feasibility and Economic Study of the Utilization of Medium-Scale Industrial Secondary Forestry Processing Residues
for Energy Applications
by
Walter Anthony Bright II
A thesis submitted to the Graduate Faculty of North Carolina State University
in partial fulfillment of the requirements for the Degree of
Master of Science
Mechanical Engineering
Raleigh, North Carolina
2011
DEDICATION
BIOGRAPHY
ACKNOWLEDGEMENTS
I would like to thank my Father and Mother, Anthony and Teresa, whose upbringing made it possible for me to accomplish this thesis. I would also like to thank my Grandparents, whose financial support along with my parents made it possible for me to concentrate on coursework instead of how I was going to pay for school.
TABLE OF CONTENTS
LIST OF TABLES ... viii
LIST OF FIGURES ... ix
Chapter 1 Introduction ... 1
1.1 Current Energy Production and Biomass Feedstocks ... 4
1.1.1 What is Biomass? ... 4
1.1.2 Woody Biomass Feedstocks ... 5
1.2 The Forestry Processing Industry and Forestry Processing Residues ... 6
1.2.1 Primary Forestry Processing Industry ... 7
1.2.2 Secondary Forestry Processing Industry ... 7
1.3 Alternative Solutions ... 9
Chapter 2 Overview of Conversion Technologies ... 10
2.1 Ethanol, Butanol and Biodiesel ... 10
2.2 Anaerobic Digestion ... 11
2.3 Thermochemical Conversion ... 12
Chapter 3 Combustion Conversion and Equipment ... 13
3.1 Bed (Burner) Types ... 14
3.1.1 Fixed-Bed Combustors (Stokers) ... 15
3.1.2 Moving-Bed Combustors ... 17
3.1.3 Fluidized-Bed Combustors ... 18
Chapter 4 Gasification/Pyrolysis Conversion and Equipment ... 20
4.1 Direct or Indirect Heat ... 23
4.2 Single Bed Gasifiers ... 24
4.2.1 Fixed Bed Gasifiers... 24
4.2.2 Moving Bed Gasifiers ... 26
4.2.3 Fluidized-Bed Gasifiers ... 26
4.2.4 Entrained Bed Gasifiers ... 27
4.3 Multi-Bed Gasifiers ... 28
4.4 Single-Stage and Two-Stage Gasifiers ... 28
4.4.1 Syngas Cleanup ... 29
Chapter 5 Mechanical Equipment ... 30
5.1 Boilers ... 30
Chapter 6 Applications ... 40
6.1 Process Heating or Steam Production ... 41
6.2 Steam Rankine Cycle ... 42
6.3 Brayton Cycle (Gas Turbines) ... 44
6.4 Combined Cycle... 45
6.5 Organic Rankine Cycle ... 46
6.6 Cogeneration (Combined Heat and Power) ... 46
Chapter 7 Market Feasibility of Thermochemical Conversion Methods ... 47
7.1 Combustion versus Gasification ... 47
7.2 Market Feasibility of Gasification ... 48
7.3 Market Feasibility of Combustion ... 49
7.4 Feasible Pathways for Secondary Forestry Process Residues ... 50
Chapter 8 Emissions and Regulations ... 52
8.1 United States Emission Regulation History ... 52
8.2 Emissions from Secondary Forestry Processing Residues ... 53
8.3 CAA Section 112, Section 129 and Boiler MACT ... 53
8.3.1 Current Boiler MACT Rulings for Biomass ... 54
8.4 Title V ... 59
8.5 Emission Systems ... 59
Chapter 9 Case Study Background ... 61
9.1 Current Operation ... 61
9.1.1 Facility Descriptions ... 61
9.1.2 Process Descriptions ... 62
9.1.3 Utility Bills... 63
9.2 Wood Waste Stream Composition ... 67
9.2.1 Current Solution for Wood Waste Stream ... 68
9.3 Proposed Operation Overview ... 69
9.4 Current and Potential Emissions ... 70
9.5 Assumptions and Modeling Software ... 71
9.5.1 Overarching Assumptions ... 71
9.5.2 Modeling Software... 72
9.5.3 Disclaimers ... 75
Chapter 10 Case Studies ... 76
10.1 Case Study 1 – Closed-Loop Rankine Cycle with Surface Condenser and Multi-stage Condensing Turbine... 76
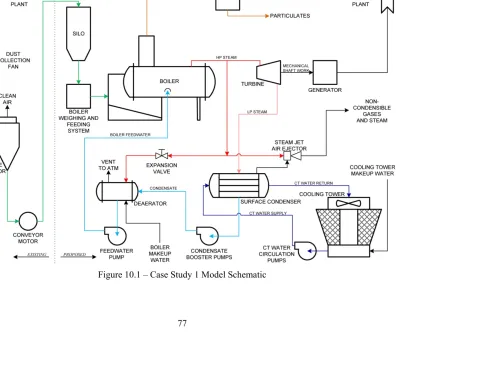
10.1.1 Proposed Process Description ... 76
10.1.2 Case Study 1 Model ... 78
10.1.3 Proposed System Equipment ... 83
10.1.5 Case Study 1 Conclusions ... 100
10.2 Case Study 2 – Closed-Loop Rankine Cycle with Air-Cooled Single-Stage Condensing Turbine ... 101
10.2.1 Proposed Process Description ... 101
10.2.2 Case Study 2 Model ... 103
10.2.3 Proposed System Equipment ... 109
10.2.4 Case Study 2 Economics ... 111
10.2.5 Case Study 2 Conclusions ... 115
10.3 Case Study 3 – Open-Loop Rankine Cycle with Single-Stage Condensing Turbine Venting to Atmosphere ... 115
10.3.1 Proposed Process Description ... 115
10.3.2 Case Study 3 Model ... 117
10.3.3 Proposed System Equipment ... 122
10.3.4 Case Study 3 Economics ... 123
10.3.5 Case Study 3 Conclusions ... 127
10.4 Case Study 4 – Combined Heat and Power ... 128
10.4.1 Proposed Process Description ... 128
10.4.2 Case Study 4 Model ... 130
10.4.3 Proposed System Equipment ... 136
10.4.4 Case Study 4 Economics ... 140
10.4.5 Case Study 4 Conclusions ... 145
10.5 Case Study 5 – Process Heating... 146
10.5.1 Proposed Process Description ... 146
10.5.2 Case Study 5 Model ... 148
10.5.3 Proposed System Equipment ... 152
10.5.4 Case Study 5 Economics ... 155
10.5.5 Case Study 5 Conclusions ... 159
10.6 Case Study 1 and 4 Sensitivity Analysis ... 160
10.7 Incentives ... 165
10.8 Case Study Conclusions ... 166
Chapter 11 Conclusions ... 168
REFERENCES ... 171
APPENDICES ... 174
Appendix A EPA Reference Tables ... 175
Appendix B SSAT Model Input Pages and Custom Calculation Pages... 181
LIST OF TABLES
Table 4.1 – Particulate Gas Sizes [15] ... 29
Table 8.1 – Area Source Biomass Emissions Requirements ... 56
Table 8.2 – Major Source Biomass Emissions Requirements ... 57
Table 9.1 – Furniture Plant Annual Electric Bill ... 64
Table 9.2 – Food Plant Annual Electric Bill ... 64
Table 9.3 – Furniture and Food Plant Annual Natural Gas Bills ... 66
Table 9.4 – Waste Stream Composition Summary ... 68
Table 10.1 – Case Study 1 SSAT Model Inputs ... 80
Table 10.2 – Case Study 1 SSAT Model Outputs ... 81
Table 10.3 – Case Study 1 Economic Analysis Summary ... 96
Table 10.4 – Implementation Capital Cost Summary for Case Study 1 ... 98
Table 10.5 – Case Study 2 SSAT Model Inputs ... 106
Table 10.6 – Case Study 2 SSAT Model Outputs ... 107
Table 10.7 – Case Study 2 Economic Analysis Summary ... 112
Table 10.8 – Implementation Capital Cost Summary for Case Study 2 ... 114
Table 10.9 – Case Study 3 SSAT Model Inputs ... 119
Table 10.10 – Case Study 3 SSAT Model Outputs ... 120
Table 10.11 – Case Study 3 Economic Analysis Summary ... 124
Table 10.12 – Implementation Capital Cost Summary for Case Study 3 ... 126
Table 10.13 – Case Study 4 SSAT Model Inputs ... 132
Table 10.14 – Case Study 4 SSAT Model Outputs ... 134
Table 10.15 – Case Study 4 Economic Analysis Summary ... 142
Table 10.16 – Implementation Capital Cost Summary for Case Study 4 ... 144
Table 10.17 – Case Study 5 SSAT Model Inputs ... 149
Table 10.18 – Case Study 5 SSAT Model Outputs ... 150
Table 10.19 – Case Study 5 Economic Analysis Summary ... 156
LIST OF FIGURES
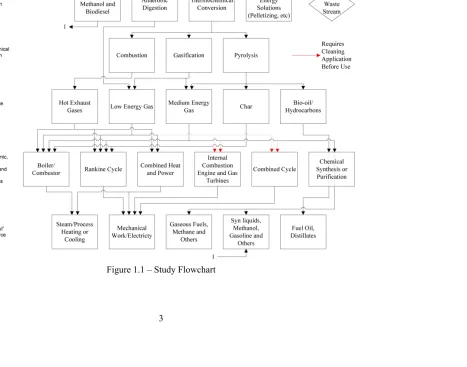
Figure 1.1 – Study Flowchart... 3
Figure 1.2 – U.S. Energy Consumption by Energy Source, 2009 [1] ... 4
Figure 3.1 – Fixed Grate Burner Schematic, Hurst Boiler Underfeed Stoker Model [13] ... 16
Figure 3.2 – Moving Grate Burner Schematic, Hurst Boiler Chain Grate System [13] ... 17
Figure 3.3 – Bubbling (a) and Circulating (b) Fluidizing-Bed Combustion System [12] ... 19
Figure 4.1 – Gasification Chemistry Steps [12] ... 21
Figure 4.2 – Updraft and Downdraft Gasifier Schematics [15] ... 25
Figure 4.3 – Bubbling and Circulating Fluidized Bed Schematics [15] ... 27
Figure 5.1 – Water Tube Boiler Innards Schematic [16] ... 31
Figure 5.2 – Impulse Style and Reaction Style Turbine Stages [17] ... 34
Figure 5.3 – Steam Jet Air Ejector Schematic [20] ... 37
Figure 6.1 – Steam Rankine Cycle [18] ... 43
Figure 6.2 – Gas Brayton Cycle [18] ... 44
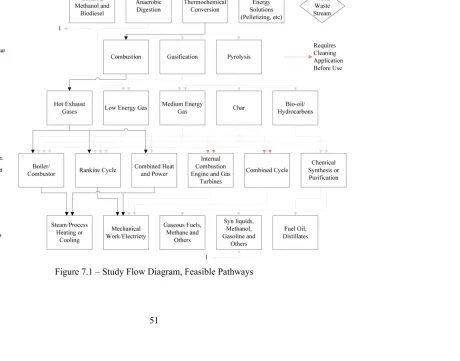
Figure 7.1 – Study Flow Diagram, Feasible Pathways ... 51
Figure 9.1 – Furniture and Food Plant Electric Bill ... 65
Figure 9.2 – Furniture and Food Plant Natural Gas Bills ... 66
Figure 10.1 – Case Study 1 Model Schematic ... 77
Figure 10.2 – Case Study 1, SSAT Model ... 82
Figure 10.3 – Hurst Boiler Co. 600 bhp Biomass Reciprocating/Moving Grate Boiler [13] . 84 Figure 10.4 – Case Study 2 Model Schematic ... 102
Figure 10.5 – Case Study 2, SSAT Model ... 108
Figure 10.6 – Case Study 3 Model Schematic ... 116
Figure 10.7 – Case Study 3, SSAT Model ... 121
Figure 10.8 – Case Study 4 Model Schematic ... 129
Figure 10.9 – Case Study 4, SSAT Model ... 135
Figure 10.10 – Case Study 5 Model Schematic ... 147
Figure 10.11 – Case Study 5, SSAT Model ... 151
Figure 10.12 – Isentropic Efficiency Sensitivity Study ... 161
Figure 10.13 – Boiler Efficiency Sensitivity Study ... 162
Figure 10.14 – Cost of Energy Sensitivity Study, Annual Savings ... 163
Chapter 1
Introduction
Rising energy costs, tightening emission standards and increasing waste disposal fees are rapidly raising the cost of manufacturing in the United States. More than ever, the manufacturing industry is looking for ways to reduce costs and increase revenue to stay profitable. Energy and waste savings are a great way for many manufacturing companies to reduce costs that directly impact their bottom line. As a result, manufacturing companies are installing more efficient equipment and changing processes to consume less energy. Companies are also looking into using material more effectively and ensuring that what is disposed of is kept to a minimum. However, there is a certain industry that not only has a way to reduce waste, but also a way to generate energy while doing so.
This study examines the multiple possibilities of turning wood waste into energy, discusses the most economical and feasible solutions, and presents basic case studies. It is important to understand that each solution is discussed and argued from a forestry processing industrial perspective, whose main goal is not to create power, reduce waste or be environmentally friendly, but instead make product efficiently and profitably. Accomplishing another goal in the process is simply added value to the project. Each potential solution’s positives and negatives will be discussed from this viewpoint.
There are several potential energy sources that the wood waste stream could be converted into, along with hundreds of pathways to go from a biomass feedstock to a final energy source. Figure 1.1 is a flowchart that introduces these multiple possibilities. However, each pathway is not necessarily feasible from the perspective of the forestry processing industry, and discussions on each path’s feasibility are discussed throughout the study. Each chapter of the study pertains to a different section of the flow chart. In Chapter 1, biomass feedstocks are introduced, along with alternatives to energy conversion. In Chapter 2, conversion technologies are introduced. Chapter 3 and 4 discuss the three different thermochemical conversion methods and the intermediate products they produce. In Chapter 5 and 6, the different applications along with the mechanical equipment and energy source obtained are shown. In Chapter 7, the feasibility of each path is discussed, and emissions are discussed in Chapter 8. Finally, Chapter 9 presents background for the case studies and Chapter 10 presents five case studies. Conclusions, along with future work, are drawn in Chapter 11.
1.1
Current Energy Production and Biomass Feedstocks
In 2009, the United States consumed 94.58 quadrillion BTUs of energy. This includes residential, commercial, industrial and transportation usage. Of that consumption, 78.37 quadrillion BTUs was provided by fossil fuels, or 82.8%. Only 7.74 quadrillion BTUs, or 8.2%, was provided by renewable energy, including hydroelectric, geothermal, solar/photovoltaic, wind and biomass [1]. This can be seen graphically in Figure 1.2.
Figure 1.2 – U.S. Energy Consumption by Energy Source, 2009 [1]
With increasing concern over energy dependence on foreign oil and the ability to generate energy renewably and sustainably, there might have never been a more appropriate time to use biomass to generate energy.
1.1.1
What is Biomass?
biomass they do not include coal, oil, petroleum and other fossil fuel resources because they are not considered renewable.
Biomass can be broken down into four main categories [3]:
1. Energy crops, such as corn, sugarcane, etc 2. Trees or other woody biomass
3. Waste materials, such as animal manure, bagasse, etc 4. Others, such as algae
When biomass is used for energy production, the biomass resources above are commonly referred to as feedstocks. All of the feedstocks above have been studied in the past and will be extensively studied in the future, as they might prove to be our future “fossil fuel.”
1.1.2
Woody Biomass Feedstocks
Using wood to create energy is far from a new idea. In fact, burning wood to produce heat might be the earliest form of energy conversion known to man. Woody biomass and its derived fuels (from pulp and paper) make up 24% of renewable energy consumption, or 2% of total energy consumption in the United States [1]. There are countless numbers of woody biomass feedstocks that are available for energy production along with a number of ways to convert them to energy. Woody biomass resources can be easily broken into two segments: feedstocks specifically grown for energy production and feedstocks which are waste materials, as discussed in Section 1.2.
Woody Biomass Specifically Grown for Energy (Fuel Wood)
value, because trees have many other uses than just energy; including but not limited to: paper, lumber, engineered materials (MDF, OSB, etc) and furniture. In fact, for sawtimber grade softwood trees, sawmills might pay $110 per short ton and for pulpwood grade trees, paper mills might pay $50 per short ton. Based on a 40% moisture content, this is a cost of $10.50/MMBTU and $4.75/MMBTU, respectively [4]. For comparison, coal, whose inherent value is low because it can be used solely as a fuel, costs $31 per short ton, with a dollar per MMBTU1 cost of $1.25 [4; 5]. The lower the inherent value of the proposed fuel, the more cost effective energy production will be. The viability of woody biomass feedstocks specifically for energy production has been investigated, however will not be considered here as it is outside the scope of the study.
1.2
The Forestry Processing Industry and Forestry
Processing Residues
1.2.1
Primary Forestry Processing Industry
The primary forestry processing industry, in general, accepts raw trees, runs them through a process, and provides a wood product. These products include: lumber, paper or engineered woods such as fiberboard or particleboard. Primary forestry processing residues include sawdust, chip rejects, bark or other residues [7]. The wood can be processed green or dry, and thus the residues have widely varying moisture contents. In general, primary residues are at best, free. Many of them have a positive value, and can be used for mulch, wood pellets or animal bedding material [8]. The residues are generally cheaper than raw sawtimber trees. Pure, clean sawdust from the lumber mill might go for $50 per ton [8] versus $110 per ton for sawtimber grade trees. If the particle size is large enough and it is free of debris, it can be sold for use in engineered woods such as fiberboard and oriented-strand board. Because of its high-demand and positive value, it becomes a slightly less attractive feedstock for energy production, similar to wood grown specifically for energy production.
1.2.2
Secondary Forestry Processing Industry
have no inherent value other than fuel. Because of this, not only are there energy savings, but also potential waste and disposal savings. For the other residues discussed, the savings from selling or using the residue in the product would have to be deducted from the energy savings. All of these reasons result in secondary forestry processing residues being the most economical feedstock discussed. The waste stream is very site specific, and will vary in energy content, foreign matter (e.g. dirt, PVC) and moisture content. Two common examples are discussed below.
Wood Pulp with Fiberglass
Wood pulp with fiberglass is a common waste stream in the door skin industry, where exterior door skins are mixed with small levels of fiberglass to help with product life. For interior doors, the wood pulp is not mixed with fiberglass, and can be recycled and reused. However, once fiberglass is added, the pulp is sufficiently contaminated to warrant disposal instead of recirculation. Glue or binder along with wax is also mixed into the pulp, further contaminating the waste stream. The glue can result in undesired toxic emissions if the wood waste stream is burned.
Medium Density Fiberboard Sawdust with ABS/PVC Plastic
1.3
Alternative Solutions
Chapter 2
Overview of Conversion
Technologies
There are several ways that secondary forestry processing residues can be converted to energy, including but not limited to: liquid fuels (ethanol, butanol, biodiesel, etc), anaerobic digestion, and thermochemical conversion. Thermochemical conversion can be further broken down into: combustion, gasification and pyrolysis. All are valid methods; however some might be more feasible than others from the perspective of the industrial family being examined.
2.1
Ethanol, Butanol and Biodiesel
convert to biofuels. Lignin is still a valid fuel however. During paper production, lignin is separated and burned in the black liquor for the paper industry’s primary source of energy. A similar process could be used for liquid biofuels production. However, most companies that have a wood waste stream are not going to want to start a secondary company making and selling fuel, further much be a pioneer in the industry. Therefore, despite being options which might eventually generate the large majority of our transportation fuel, this route is not currently feasible.
2.2
Anaerobic Digestion
Anaerobic digestion converts organic compounds, such as wood, into a biogas that can be burned. The reaction occurs in a digester which is filled anaerobic microorganisms, and creates a gas mostly comprised of methane and carbon dioxide. It consumes very little energy and the product biogas is very easy to extract.
Anaerobic digestion is a potentially valid method for conversion of woody biomass; however it is better suited for animal wastes, starches, sugars or a mix of feedstocks instead of pure lignocellulosic materials [11]. Also very little, if any, of the lignin in the feedstock will be converted. This is a large amount of energy that will be lost, simply because the organisms have difficulty converting the lignin. Using just woody biomass will require a large amount of water, which is becoming more and more of an expensive resource. Anaerobic digesters also take a large amount of space compared to thermochemical conversion systems, and land is not always a luxury for industrial plants. Land might be close by, but transportation if at all possible should be avoided.
and requires expertise. It is easy to “sour” the digester and the biogas production will fall to zero. It is likely that a biological engineer would be required to manage the digester. Therefore, the plant personnel and management might be a little less intimidated by a thermochemical conversion process as compared to a biological conversion process.
2.3
Thermochemical Conversion
Chapter 3
Combustion Conversion and
Equipment
Combustion is a thoroughly implemented thermochemical conversion where the fuel is rapidly oxidized. The result is hot exhaust gases, which are composed mostly of carbon dioxide and water, along with any non-combustibles, usually in the form of ash. The hot exhaust gases can be used to create steam in a boiler or heat process equipment. For biomass, combustion occurs at temperatures up to 3,600°F, with hot exhaust gases between 1,500 and 1,800°F, depending on the moisture content and fuel composition [12]. The reason that combustion is extremely common is because it is far from a new technology and has been proven over and over throughout time.
The ideal combustion of a fuel composed of carbon, hydrogen and oxygen burned in the presence of air can be expressed as:
(
)
(
)
2 2
2 2 2 2
3.76 4 2
1 3.76 HEAT
2 4 2 4 2
C H O O N
CO H O O N
α β γ β γ λ α β β γ β γ α λ α λ α ⎛ ⎞ + ⎜ + − ⎟ + → ⎝ ⎠ ⎛ ⎞ ⎛ ⎞ + + − ⎜ + − ⎟ + ⎜ + − ⎟ + ⎝ ⎠ ⎝ ⎠ (3.1)
H2O. In real combustion, the fuel will always have a slight amount of nitrogen, sulfur and
other elements. Real combustion can also produce CO, NOx, SOx and other compounds.
Combustion equipment, also called burners or combustors, convert the chemical energy of the biomass into a high temperature exhaust gas. This high-temperature exhaust gas can be used for space heating or process heating, but is often used to create steam in a boiler. For an in-depth discussion on boiler operation and efficiency, see Section 5.1 entitled Boilers.
Biomass boilers range in size and style, depending on the type and quantity of biomass being fired. The style of boiler is most readily classified based on the bed type, which is where the biomass is combusted. Many of the biomass boiler manufacturers will not use the exact bed type discussed below, but will use a “hybrid” to obtain the best qualities of each.
No matter the bed type, generally all biomass boilers utilizing combustion operate the same way. The biomass is fed mechanically into a bed, where air is introduced. Generally, less than stoichiometric air is introduced initially, which results in an incomplete combustion process. The partially combusted exhaust gases rise, where they mix with more air and are fully combusted. Non-volatile carbon, or char, remains in the bed where it fully combusts. The volatile carbon combustion occurs at the tube bank, because when the exhaust gases fully combust a substantial amount of the energy leaves as radiation. Fully combusting the exhaust gases at the tube bank and not at the bed allows the radiation to be absorbed by the tube bank and water, instead of being absorbed by the bed or burner. The remaining heat is absorbed via conduction and convection. The exhaust exits the stack of the boiler and then enters the emission equipment or exits to atmosphere.
3.1
Bed (Burner) Types
fixed-3.1.1
Fixed-Bed Combustors (Stokers)
Fixed-bed combustors, also known as stokers, are the most common method of burning biomass [12]. All have the same general operating principle where the biomass is fed onto a grate, is partially oxidized, and then fully burned at the tube bank. Some types of fixed-bed combustors are, but not limited to: pile burners, grate burners and suspension-fired furnaces. In all types sufficient air is provided above (overfire air) and/or below (underfire air) the fuel to ensure eventual complete combustion.
Pile Burners or Dutch Ovens
Pile burners are the simplest and oldest way of converting biomass to energy, where the feedstock is burned literally in a pile below a set of burners. The pile is burned in reducing conditions, resulting in incomplete combustion and exhaust containing volatile gases. The gases are further combusted above the pile by the burners. The advantage to the pile burner is it can accept high moisture fuels and fuels mixed with dirt [12]. However, the burner demands high excess air and in turn has a low efficiency. Ash must be periodically removed and the boiler must usually be shut down to do so, as the ash collects where the wood burns.
Grate Burners
The most common combustor today is a grate burner utilizing either a fixed- or travelling-grate [12]. Grate burners have replaced pile burners because they are still simple in operation, but have a higher efficiency. In a fixed-grate burner, the combustion air enters from below the grate, passes through the biomass (which can be fed manually, but usually automatically), and partially combusts. The ash falls through the grate into an ash collection area. The grates are usually water cooled and made from cast iron. The stationary grate burners are simpler than the moving, and the boiler does not need to be shut down for ash removal.
travels through a retort (6) and enters the combustion chamber. Once ignited, the biomass volatizes and partially combusts. Some of the biomass and ash falls onto the cast grates at (5), and ash that falls through the grate is raked from under the grate at (11). Underfire air is fed at (7), while overfire air is also provided above the burner at (9). The heat is transferred in this case to create steam, but could also be used to provide process heat. This is simply one design of a fixed grate burner, many more manufacturers and styles exist.
Figure 3.1 – Fixed Grate Burner Schematic, Hurst Boiler Underfeed Stoker Model [13]
Suspension Burners
3.1.2
Moving-Bed Combustors
Moving-bed combustors operate essentially the same way as fixed-bed combustors. The main difference is in the ash removal. All fixed-bed boilers must have the ash removed manually, a small portion requiring partial shutdown to do so. Moving-bed boilers solve this problem by removing the ash mechanically. The most common form of moving-bed combustors is a moving-grate burner.
Moving Grate Burners
Moving-grate burners are very similar in operation to the fixed-grate burners discussed in Section 3.1.1 – Fixed-Bed Combustors (Stokers). Instead of a fixed-grate, the grate is now moved so that the ash is automatically dumped into a hopper for disposal. The grates must be cooled via air or water to reduce thermal stresses, but the boiler does not need to be shut down for ash removal. The grates can be driven by a chain and sprocket, hydraulic system or can be vibrated.
A moving grate burner schematic is shown in Figure 3.2. Here, a chain grate system is utilized, where the biomass is fed automatically (13) onto a chain grate system (3). Here, only overfire air is provided at (9). Ash removal is automatic (5), which reduces labor costs. Again, this represents one manufacturer and style of moving grate burners; many more exist.
3.1.3
Fluidized-Bed Combustors
In a fluidizing-bed, the biomass is fed into a hot bed of non-combustible media (sand for example). Air is injected at the bottom of the bed with sufficient speed to entrain the biomass and non-combustible media in the air stream. The biomass is then combusted where some of the heat leaves in the exhaust gas and some is transferred to the incombustibles. Fluidizing-beds claim to reduce SOx and NOx emissions because of reduced operating
temperatures, while increasing system efficiency via increased heat transfer and residence time [12; 14]. They also can handle varying feedstocks; such as changing particle size or composition, and are more apt for the combustion of high-fouling and low-energy fuels [12]. The disadvantage is a higher parasitic load due to the power to fluidize the bed, and higher cost than fixed- and moving-bed systems.
Bubbling Fluidized Bed
Figure 3.3 – Bubbling (a) and Circulating (b) Fluidizing-Bed Combustion System [12]
Circulating Fluidized Bed
Chapter 4
Gasification/Pyrolysis Conversion
and Equipment
Gasification is another thermochemical conversion method which uses high temperatures in a lower-than-stoichiometric environment to create a synthetic gas, better known as “syngas.” Gasification should not be confused with combustion. During combustion, about 6 to 7 pounds of air are supplied per pound of biomass, while gasification provides 1.5 to 1.8 pounds of air per pound of biomass. The result is a fully-combusted exhaust stream versus a burnable syngas. The syngas is a low to medium-BTU content gas, composed mostly of CO, H2, H2O, CO2, N2, NH3, CH4, tar vapor and ash particles [12; 14]. If necessary, the tar vapor,
particulates and other undesired materials can be removed from the syngas. The syngas can be used for heating, electricity production, fuel for turbines or internal combustion engines, chemical synthesis, or can be potentially used in fuel cells.
provided indirectly which increases the cost of pyrolysis. Also, keeping the pyrolysis reactor well sealed to prevent air infiltration increases costs.
The advantage of pyrolysis is a high value, high-BTU content liquid fuel that can be easily transported, as compared to the solid biomass or syngas from gasification. However, the majority of industrial companies will not want to start a side business of selling liquid fuel. Even if the liquid fuel is to be burned onsite, it still requires a substantial amount of cleanup and processing, even more so than gasification. For the industrial family considered, producing electricity or heat and using it in the plant or putting electricity back on the grid is a much easier option than selling liquid fuel. The char can be burned to create hot exhaust gases, and the gaseous portion can be burned or cleaned for direct use in engines; however, there is no reason for pyrolysis if the ultimate goal is a solid or gaseous fuel source.
Figure 4.1 – Gasification Chemistry Steps [12]
remaining fixed carbon turns to char. Note that the pyrolysis reactions occur in the absence of oxidant, and increase the porosity of the biomass particles for the next step. Neither the drying nor the pyrolysis reactions are chemical in nature. Next, are gas-solid and gas phase reactions, where the pyrolysis gas reacts chemically with the solid char or other gaseous molecules to form the final composition of the syngas.
In a gasifier, gasification agents (typically air), in addition to the biomass, are added. For steam or electricity production, air will be used as a gasification agent because it is free. The use of pure hydrogen or oxygen is cost prohibitive but may be used in chemical synthesis for high dollar applications. Steam will sometimes be added to the gasifier to increase the amount of hydrogen formation for chemical synthesis. Gasifiers generally operate between 1,500 and 1,700°F [12]. Heat is added to the gasifier, where the gasification process occurs. The syngas is collected and either distributed or captured depending on its final use.
Other smaller products of gasification include solids and liquids. The solid product in combustion is a solid residue of non-combustible ash. In gasification, however, the solid is known as char, which contains ash, carbon and organic materials. Char still contains energy, and can sometimes be combusted internally or externally of the gasifier. Liquids in gasification include water vapor, tar and acids. Both the solid and liquid products present potential problems when using the syngas in an engine because they will condense in the intake system. Both the liquids and solids are less of an issue if the syngas is burned directly for heat.
Gasifiers have more classification divisions than the combustion equipment discussed earlier. Similar to combustors, the main division is the bed type. Gasifiers are also subdivided based on the number of stages (single-stage or two-stage) and how heat is applied to the gasifier (indirectly or directly).
4.1
Direct or Indirect Heat
No matter the bed type, the number of beds or the end use of the syngas, all gasifiers require heat in order to operate. This heat can be provided directly or indirectly. If direct heat is used, either the syngas or the char is oxidized within the gasifier. If the syngas is burned, then the amount of syngas is reduced because some of it is being consumed for heating the gasifier. If the char is used, then the amount of syngas is increased, but the potential for unwanted chemicals in the syngas is also increased as they are released during the burning of the char. Direct heat is the simpler of the two types, and requires extra air to be added for the oxidation process. The excess air that is not used to burn the char or syngas leaves with the syngas and reduces its BTU content.
harmful chemicals do not enter the syngas. Indirect heat is most often done in a multi-bed gasifier, as discussed in Section 4.3 entitled Multi-Bed Gasifiers.
4.2
Single Bed Gasifiers
The main categorization for gasifiers is bed type, similar to combustion. In general, fixed-beds are the simplest, cheapest and most proven gasification technology, but they produce a lower energy content gas. Fluidizing-beds increase the BTU content, but are higher in cost and complexity and also have issues with non-combustible media carryover in the syngas. Entrained beds also increase the BTU content, but do not have the issue with incombustible media carryover.
4.2.1
Fixed Bed Gasifiers
Fixed-bed gasifiers have a grate that supports the biomass, which is nearly always fed from the top. Biomass particle size must be greater than 0.10 inches, so the particles do not fall through the grate, do not become entrained in the syngas or airflow, and do not pack too tightly, which significantly raises the pressure drop across the gasifier. They must also be less than 2 inches to maintain syngas quality [15].
Updraft (Counter-current)
char. The remaining solids are incombustible, and fall through the grate. Updraft gasifiers have low char production that contains little carbon, but produce a large amount of tars.
Downdraft (Co-current)
Downdraft gasifiers seen in Figure 4.2 consist of a dual-shell (not pictured) with a grate at the bottom of the inner shell. The biomass is fed at the top along with air. The air is pulled down through the biomass, where gasification occurs, and the syngas travels up the outer shell. In this process, the pyrolysis tars pass indirectly through the oxidation zone and are thermally cracked, unlike updraft gasifiers, which do not pass the tars through the oxidation zone. Another difference is that the syngas is combusted, which reduces the syngas flow, and the char is discarded from the bottom of the gasifier. Downdraft units are difficult to scale up, because getting air to the center of the gasifier is difficult, and results in “hot spots” and uneven temperature distributions. Tar production is reduced because of the cracking process, but char production increases and contains a higher carbon percentage than updraft gasifiers, which decreases gasifier efficiency. However, the char can be combusted in a dual gasifier setup, as discussed in Section 4.3 – Multi-Bed Gasifiers.
4.2.2
Moving Bed Gasifiers
Moving-bed gasifiers operate nearly identically to fixed-bed gasifiers, but the grate is driven or vibrated for the automated removal of ash, similar to combustion. They are also classified into updraft and downdraft gasifiers, and operate in the same fashion as the fixed-bed gasifiers above. The automatic removal of ash is done at the price of added complexity and cost.
4.2.3
Fluidized-Bed Gasifiers
Fluidizing-bed gasifiers, as with combustion, can handle a greater range of feedstocks and improved overall conversion efficiency. They reduce the syngas tar content, but increase the particulate concentration in the gas due to the added incombustibles. Once out of the start-up phase, the amount of noncombustible carryover is greatly reduced but still greater than its counterparts. The mixing is very turbulent, which results in good temperature distributions, an issue with fixed and moving beds.
Bubbling Fluidized Bed
Figure 4.3 – Bubbling and Circulating Fluidized Bed Schematics [15]
Circulating Fluidized Bed
Circulating beds seen in Figure 4.3 use a higher velocity than bubbling beds, so larger particles leave in the syngas stream. However, these particles are collected, usually through a cyclone separator, and fall back down into the incombustible media to be further gasified. This helps increase fuel conversion rates.
4.2.4
Entrained Bed Gasifiers
4.3
Multi-Bed Gasifiers
Multi-bed gasifiers use two fixed or fluidized-beds, or a combination of the two. The primary bed is where the gasification occurs. The char and ash leave the primary bed, where they are separated from the syngas, and fed into a secondary bed. Here, the char is fully combusted, which provides heat either directly or more appropriately, indirectly, to the primary bed. This has great advantages because the char is utilized, nitrogen in the syngas is reduced because of indirect heating, and the overall efficiency is increased. Yet, costs are also greatly increased.
4.4
Single-Stage and Two-Stage Gasifiers
Closed-coupled, or single-stage gasifiers, gasify the wood and then directly burn it for space heating, steam or other heating requirements. They are cheaper than two-stage gasifiers, but the gas cannot be used for turbines or internal combustion engines. This is due to the high particulate, tar and/or alkali metal content. In fact, nearly all biomass combustors discussed earlier do something similar to this. The fuel is partially burned, in essence gasified, and then fully combusted at the tube bank. The char combustion provides the heat for the gasification process. This takes advantage of gasification’s attributes of lower harmful emissions because of lower operating temperatures and combustion’s ease and proven technology.
4.4.1
Syngas Cleanup
Gas cleanup, since the invention of gasification, still remains one of the prime issues preventing the technology from moving forward [15]. Cheap, low pressure drop clean-up is essential for use economically in thermo-mechanical devices. Dirty fuels will result in shortened engine life and poor operation. During gas cleanup, tars and particulates are removed along with hazardous materials, such as alkali metals. Low alkali content in the fuel is key in controlling blade fouling in turbines [15]. Currently, gas cleanup is done via wet and dry scrubbing and filtering, which provides acceptable gas quality. Generally, gas cleaning is done hot, because cold cleaning condenses the tars onto the filters and clogs them. This greatly increases the pressure drop over the gasifier and requires frequent shutdown to clean or replace filters. This makes it more expensive, because the filters and other materials must be robust enough to handle the hot syngas. Table 4.1 summarizes the requirements of the syngas before entering any type of thermo-mechanical device.
Table 4.1 – Particulate Gas Sizes [15]
Internal-Combustion Engine Gas Turbine Particulate Matter (ppm) <30 (preferably <5) <30 (preferably <2)
Particle Size (μm) <10 (preferably <5) <5 Tar (mg Nm-3) <100 (preferably <5) --
Chapter 5
Mechanical Equipment
With intermediate products obtained through thermochemical conversion, the next step is to use an application to obtain a final energy source desired. These applications include thermodynamic, thermomechanical and chemical applications. However, all of them require some sort or combination of mechanical equipment. The systems discussed below are the major pieces of equipment, but many more exist. Each piece of equipment is required for one or more of the applications discussed in Chapter 6.
5.1
Boilers
Boilers are classified into firetube and watertube boilers. Firetube boilers are extremely common in small and medium sized industrial facilities. Biomass boilers are generally watertube, which consist of a steam drum, mud drum and tube bank as seen in Figure 5.1. The water is inside of the tube bank, which consists of thousands of tubes (only one riser and one downcomer pictured). The hot exhaust gases pass and surround the tube and the water absorbs the heat. As the saturated liquid evaporates, it rises to the steam drum and collects. Particulates in the water come out of solution and fall to the mud drum. The mud drum is periodically blown down to remove the collecting sludge. As equipment requires steam, the steam exits the steam drum, travels to the process equipment via the pressure gradient and is condensed in the equipment.
Figure 5.1 – Water Tube Boiler Innards Schematic [16]
fuel fired, and is a strong function of makeup water quality and pretreatment. Radiation loss is a result of the boiler shell being very hot and radiating some of that heat to the surrounding area. The outside of the boiler is well insulated, and accounts for only about 0.5% at full fire for firetube boilers, or around 1% for watertube boilers, as they are generally larger in physical size. Stack loss accounts for the majority of the losses in a boiler. As the fuel is burned, it turns into hot exhaust gases. Much of this heat is absorbed by the water, but some leaves the stack at a greater temperature than the saturated water in the boiler. The heat not recovered and lost through the stack is the stack loss, and can account for 10-30% of the losses in a boiler, depending on the fuel and boiler type.
is a function of the firing rate [14]. The longer the hot exhaust gases remain in the boiler, the more time the water can absorb the heat.
Parasitic losses are losses as a result of extra equipment on the boiler required for operation. Generally, wood fired boilers on an industrial scale will have larger parasitic losses than their fossil fuel equivalents, usually natural gas and no. 2 fuel oil (diesel). Examples of parasitic losses include but are not limited to: fans, soot blowers and emission control equipment. On a 600 bhp1 natural gas boiler, there will a 15 hp forced draft fan. Outside of controls, this is essentially the main parasitic loss. For a wood fired boiler, there will generally be an underfire and overfire fan, along with an induced draft fan. Wood fire boilers operate under negative pressure, which increases tramp air, but is necessary to prevent blowback. Blowback is when the hot exhaust gases travel backwards through the fuel system and ignite the fuel supply [13]. There will also be conveyors, motors and hydraulics for the wood feed system. A substantially more complex emission control system will also be installed on a wood fired boiler. Electric consumption on a 600 bhp wood-fired boiler might be upwards of 150 kW, depending on the steam generation conditions [13].
5.2
Deaerators
As their name suggests, deaerators remove air from the feedwater to the boiler. Air in the feedwater absorbs heat that otherwise would go into the steam. More importantly, it prevents the steel steam piping from excessive exposure to rust inducing oxygen. Air’s solubility in water is a function of temperature. In turn, the deaerator usually operates at 220 to 230°F, which drives air out of solution. Make-up water is also added to the deaerator to prevent thermal shock to the boiler. Deaerators consume steam and in turn energy, that otherwise could have been used for process equipment or turbines; however deaerators are required for
1 bhp=boiler horsepower. Equivalent to 33,475 BTU per hour or 33.475 pounds of steam per hour at 1000
maintaining good boiler operation in industrial scale steam systems. The boiler feedwater pump is generally directly below the deaerator tank to reduce cavitation risk.
5.3
Turbines
Turbines are thermo-mechanical devices that convert a high energy fluid into mechanical work. The high energy fluid can be multiple things, usually either steam or hot pressurized exhaust gases. In an impulse style turbine stage seen in Figure 5.2, the high energy fluid travels through the stator blades which form converging nozzles, which converts energy stored as pressure into velocity. Stator blades are fixed blades on the turbine. The fluid accelerates to a high velocity, where it contacts a blade connected to the rotor. The rotor blade captures the kinetic energy of the fluid and converts it to rotational energy.
pressure drops across each stage as compared to impulse stages. The type of stage used depends on the entering fluid pressure and temperature. If only one stage is used, it is known as a single-stage turbine. If more than one stage is used, the stages are connected in series, and can be all impulse stages, all reaction stages or a mix of both. If multiple stages are used it is referred to as a multi-stage turbine.
The primary classification type for turbines is based on the working fluid. Steam turbine types are further classified into backpressure, extraction backpressure, condensing, and extraction condensing. In a backpressure turbine, the steam enters the turbine at a high pressure and temperature and exits above atmospheric pressure. Backpressure turbines can be one or multiple stages. The more stages, the greater the efficiency, but the greater the initial capital cost. Extraction backpressure turbines have two or more exits, pulling steam off at different pressures; both above atmospheric. These turbines are used in place of expansion valves when steam might be needed at varying pressures in a facility. Condensing turbines allow steam to exit at a pressure below atmospheric. At the exit of the turbine, the steam is condensed, usually in a water-cooled (sometimes air-cooled) condenser. This condensation process substantially decreases the specific volume of the fluid, pulling a vacuum on the exit of the turbine, decreasing the outlet pressure to below atmospheric. This extra pressure drop across the turbine increases the mechanical output, as there is a substantial amount of energy that can be obtained below atmospheric pressure. Because of the added cost of a condenser, along with multiple potentially more complex stages, condensing turbines are typically more costly than backpressure turbines. Just like backpressure turbines, there are also extracting condensing turbines, which pull some of the steam off at an intermediate pressure, while the remaining steam goes through the turbine and condenses.
without leaving any trace on its surroundings [18]. If a turbine operates isentropically, its isentropic efficiency is 100%. Of course, no turbine is perfectly insulated, which rules out adiabatic operation, and no turbine operates reversibly. Therefore, all turbines will operate with an isentropic efficiency of less than 100%. Isentropic efficiency, seen in the equation below, is the amount of actual work obtained over the ideal amount of work. Isentropic efficiencies range from 30 to 80% [19], depending on the number of stages and pressure drop across the turbine.
actual isentropic
isentropic
W W
η = (5.1)
5.4
Condensers and Cooling Towers
vacuum pulled by the condensation process. Cooling water can be provided from a neighboring water source, such as a lake or pond, or by way of cooling towers. Since they operate below atmospheric pressure, they require a booster condensate pump to increase the pressure of the condensed steam before entering the deaerator or condensate tank. The condensing process of the steam helps pull a large portion of the vacuum. The condenser is also equipped with liquid ring vacuum pumps and/or steam jet air ejectors reduce pressure even further. The condenser is well sealed, but some air is inevitability pulled into the condenser around seals and through valves as it is below atmospheric pressure. As air enters, the mass in the condenser increases. As the mass increases and volume remains constant, the condenser operating pressure also increases. In turn, the turbine exit pressure increases and produces less power. Hence, the vacuum equipment helps remove the noncondensable gases in the condenser. Steam jet air ejectors, seen in Figure 5.3, are installed close to the cooling tower water inlet, which is the coldest part of the condenser. High pressure steam, the motive fluid, is expanded through a nozzle, and the Venturi effect causes the air and low-pressure steam mixture to be pulled across the cold tubes inside the condenser. The turbine exit steam condenses before entering the ejector, while the air does not, and enters the ejector and is exhausted along with the expanded high pressure steam to the surrounding atmosphere. Inevitably, some of the low pressure steam from the turbine will not condense and will be instead exhausted from the condenser.
Cooling towers are one method to reject the heat from the condenser. Cooling towers utilize evaporation to cool water. As warm water falls through a cooling tower, the water deflects and splashes off of a fill material which causes the water to form miniscule droplets. Air is pulled through the fill, either via natural or often forced convection, where it evaporates the water. The evaporation process absorbs energy, which lowers the temperature of the falling water stream. The cooler water collects in the bottom of the tower, or sump, where it can be circulated and used in an industrial process or condenser. Cooling towers are an extremely cost effective method for cooling water to moderate temperatures, but are limited to above the ambient wet-bulb temperature. In the winter, the wet-bulb temperature is low, which results in a lower cooling tower water temperature, and a higher temperature gradient in the condenser, so heat transfer increases. During the humid summer the opposite occurs. The wet-bulb temperature increases, which decreases the temperature gradient in the condenser and decreases heat transfer. Therefore, cooling towers are sized based on maximum summer design wet-bulb temperature.
5.5
Pumps
Pumps are simple mechanical devices that increase the pressure of a fluid. Generally pumps increase pressure for liquids whereas compressors increase pressure for gases. The power consumption of a pump can be closely approximated by:
pump
p p
gQH mgH
P ρ
η η
= = (5.2)
Where ρ is the density of the fluid, g is the gravitational constant, Q is the volumetric flow through the pump per unit time, H is the head across the system, ηp is the pump efficiency
The head across a pumping system can be calculated based on Bernoulli’s Equation:
pump f m
p
H z h h
g ρ
Δ
= + Δ + + (5.3)
Where Δp is the pressure rise across the system, Δz is the elevation change over the system, hf
is the friction loss in the pipe and hm is the minor friction losses from elbows, valves and
Chapter 6
Applications
Once the original biomass feedstock has undergone combustion or gasification (or pyrolysis), it is now in the form of a combination of gasses and remaining organic material. These are just the intermediate products for the utilization of biomass. They require additional conversion processes to be of real utility as a source of energy. There are many different applications existing to convert the intermediate thermochemical conversion product into a final energy source. Applications can be strictly thermodynamic, thermo-mechanical or chemical in nature. The application chosen is dependent on the desired final energy source, which is a function of the plant’s requirements. For example, if a plant does not have a process that requires heating, then the plant should not use the biomass to create steam for process heating. Several different thermodynamic and thermo-mechanical applications are discussed below.
6.1
Process Heating or Steam Production
The most logical application for biomass is creating process heat, which in the majority of facilities will be accomplished via steam. Steam is always generated in a boiler, which in most industrial facilities is generated via oil or natural gas. However, as discussed in Chapter 5, this can also be accomplished via a wood boiler. Conversion efficiencies for wood-fired boilers are high as compared to power generation cycles (~55 to 85% versus ~15 to 35% for a steam Rankine cycle, depending on the size), which could increase economic feasibility. Comparing these two efficiencies is somewhat unfair, as they are very different cycles and heating is generally less expensive than electricity. Hence, they should both be examined to determine actual economic feasibility on a case by case basis. The only disadvantage is that not all facilities need process heating. There are many facilities, including many in the forestry processing industry, that do not have a process heating load. In some cases, the steam could be sold to a neighboring industry; however piping costs can quickly get cost prohibitive. In order for process heating to be viable, the facility will likely already have a boiler burning some sort of fossil fuel.
site being considered. Two-stage gasification will not be used, because no syngas cleanup is required, since fouling is less of an issue in a boiler than in a thermo-mechanical device.
Steam has other uses than just process heating however. Steam can also be used for space heating and cooling. Both are less economical options than process heating, because the majority of industrial facilities will need very little space heating. Cooling is accomplished via adsorption or absorption cooling, which uses two hot gas streams (hot return air and steam) to create two cold ones (condensate and cool supply air). The efficiencies are very low and only economical if the heat is “free” and has no other potential use in the plant. However, cooling via adsorption or absorption is extremely upfront capital intensive.
Depending on the scale of the process heating or steam system, it might be more economical to do Cogeneration (Combined Heat and Power), as discussed later.
6.2
Steam Rankine Cycle
Figure 6.1 – Steam Rankine Cycle [18]
The mechanical work of the turbine can be used to drive equipment, such as fans or pumps, or can be used to drive a generator to create electricity. Since a boiler is used to combust the biomass, both combustion and gasification are valid options as thermochemical conversion methods for this application, as argued in the previous section.
Typical conversion efficiencies for steam turbine power plants are between 15 and 35%, depending on the size and manufacturer [14]. The efficiency is dictated by the individual efficiencies of each piece of equipment, mainly the turbine and boiler, along with the operating pressure of the boiler and condenser. The higher the boiler pressure and the lower the condenser pressure, the higher the efficiency.
6.3
Brayton Cycle (Gas Turbines)
Gas turbines are essentially skid-mounted airplane engines. The gas turbine cycle is known as the Brayton cycle, and can be seen in Figure 6.2. A compressor accepts a surrounding gas, nearly always air at the inlet (point 1), and compresses the gas to between 15 and 30 atmospheres. At point 2, fuel is introduced to the compressed gas and burned in the combustor at extremely high excess air. This dilutes and lowers the temperature of the hot exhaust gases, so they do not damage the turbine blades. The hot, pressurized combustion products exit the combustor, and enter the turbine at point 3. The turbine extracts energy from the combustion products and releases the products to its surroundings at point 4. Part of the work generated by the turbine drives the compressor, and the remaining work can be used to drive equipment, such as pumps and fans, or drive a generator to create electricity.
Figure 6.2 – Gas Brayton Cycle [18]
leave as a vapor in the exhaust gases also condense in the turbine, which can reduce turbine life. In turn, only two-stage gasification is applicable. However, work is underway to create Brayton cycles which can have external heat transfer in place of the combustion chamber, but are not commercially available.
Generally, two-stage, fixed-bed, downdraft gasifiers are used, because of their inherently cleaner syngas, but the syngas still requires substantial cleaning. Issues with the disposal of the removed tars and particulate matter are being investigated. To reduce tar, the cracking zone in the gasifier must be improved. Another cracking method is to introduce combustion air downstream of the gasifier, creating a “hot spot” that the syngas passes through, creating a secondary cracking zone [15].
As with boilers, burning the cleaned syngas in an engine designed for a different fuel will decrease the engine’s power and efficiency. This is a result of a lower adiabatic flame temperature and energy density of the syngas as compared to an equivalent fossil fuel, such natural gas. Since the engine operates between different heat sinks and cannot burn the same amount of energy per pound of fuel, the power and efficiency reduces.
6.4
Combined Cycle
6.5
Organic Rankine Cycle
Organic Rankine cycles (ORCs) are fairly new, and operate the same way as a steam Rankine cycle. However, they use a lower temperature operating fluid as compared to steam cycles. The efficiencies are low, but ORCs can be used on a waste heat stream that otherwise would not be cost effective for a HRSG. Because of their low efficiency, high cost and low-heat source specialty application, steam Rankine cycles are a more economical option, especially since all heat streams are of high quality.
6.6
Cogeneration (Combined Heat and Power)
Cogeneration, or Combined Heat and Power (CHP), is the easiest way to increase cycle efficiency. In a steam Rankine cycle or gas Brayton cycle, ~65% or more of the heat generated is thrown away to the atmosphere. The components themselves (compressors, boilers, turbines, etc) can be 60 to 80% efficient. The reason that so much energy is lost is because of inherent thermodynamic laws. Coal Rankine cycle power plants are 33 to 36% efficient, and are theoretically limited to 60% [22]. However, if the heat rejected can be used for process heat, then the cycle efficiency can increase to as high as 65 or 75%. This is because the heat is now being utilized versus being thrown away to the atmosphere. This greatly improves economics; however there must be a demand for heating. Otherwise, there is nowhere to reject the heat, and the cycle will work as a basic Rankine cycle.
Chapter 7
Market Feasibility of
Thermochemical Conversion
Methods
7.1
Combustion versus Gasification
Combustion is advantageous because it is a proven and simple technology, and is widely implemented throughout the world for various purposes. The biomass feedstock can enter the combustion chamber at various moisture contents and sizes without issue. However, when used solely for power generation, cycle efficiencies can be low. Generally a Rankine cycle is implemented, which requires a large amount of water not needed in a gas turbine or other engine. Water is needed to cool the condenser in the Rankine cycle, where in a turbine the exhaust from the turbine is emitted to atmosphere and not cooled.
has lower emissions of sulfur, nitrogen oxide, particulates, dioxins and furans as they remain in the char. If the char is combusted however, whether for the gasifier or another application, emissions between combustion and gasification are comparable. Although, gasification’s emissions are still likely lower because of the reduced operating temperatures. If the char is not combusted, then the syngas has a lower fouling potential, as the alkali metals in the wood waste are not released. Depending on the piece of equipment used to convert the syngas to energy, overall cycle efficiency can be higher than combustion. Generally a Rankine cycle is not used if power production is the sole purpose of the syngas, which helps reduce the need for water.
The disadvantage to gasification is that some of the feedstock being gasified must be burned to create the heat for the gasification conditions. The syngas burned becomes sensible heat in the syngas stream leaving the gasifier, so little energy is lost; however the syngas must be cooled when used in a turbine or other engine, in which case the sensible energy is wasted and the syngas flow to the turbine is reduced. Also, the syngas contains ash and tar vapors, which must be removed before running the gas through a turbine or other engine. Tar and ash content will be even higher if the char is burned directly in the gasifier. Gasifiers are also particular about the size of the biomass feedstock, which might require that the feedstock be hogged to a certain size.
7.2
Market Feasibility of Gasification
Two-stage systems, where the syngas is cleaned for use in a thermo-mechanical device, have been promised to the industry for quite some time, but are still not truly commercially available. Some systems exist, but are generally for small applications and not wide-spread in use. The good news is that the systems are currently in the demonstration and pilot phases. The issue, as it has been since its introduction, is removing the impurities from the combustible gas economically, as well as the low heating value of the cleaned syngas. There are a handful of 5 to 100 kW biomass systems in the United States currently [14]. These systems are much smaller than the case study presented. Since two-stage gasification is not a proven technology, the industries considered are going to see it as a risk to implement such a system, as opposed to an asset. Hence, two-stage gasification systems are not considered in the case studies.
7.3
Market Feasibility of Combustion
7.4
Feasible Pathways for Secondary Forestry Process
Residues
Chapter 8
Emissions and Regulations
8.1
United States Emission Regulation History
On December 31, 1970, President Richard Nixon signed the Clean Air Act into law, 28 days after creating the Environmental Protection Agency (EPA). The Clean Air Act, or CAA, was designed to improve human health and the environment while not crippling the American economy or preventing the growth of industry. The CAA covered multiple sectors, including industry, automotive, commercial and others. The CAA was heavily amended in 1990, perhaps most notably with the introduction of CAA Title V. Title V set a threshold on the amount of annual emissions an industrial facility could potentially release. All large industrial facilities above the threshold are required to obtain costly permits to operate.
day appeal process and at the time of writing this study, many trade organizations and associations are coming forward and requesting a stay on the ruling. Obviously, the Boiler MACT rules are a contentious topic of debate, and the only sure thing is that more change will be coming.
8.2
Emissions from Secondary Forestry Processing Residues
No matter the fuel, when combusted, all fuels may emit some toxic chemicals or HAPs. Multiple studies [24; 25] has shown that secondary forestry processing residues have the potential to emit ammonia, nitrogen oxides, formaldehyde, hydrogen cyanide, isocyanates, phenol, volatile organic compounds, dioxins, furans, various acids and other harmful toxins. However, the majority of these toxins are emitted in extremely small amounts. Therefore, the more important question is not if the fuel will have harmful emissions, but what is the concentration of toxic chemicals emitted. In turn, the EPA limits the amount of HAPs which can be emitted on a concentration or per MMBTU of fuel fired basis. These limits are what the Boiler MACT rule covers.
8.3
CAA Section 112, Section 129 and Boiler MACT
This is very important, since the tighter the emission requirements, the higher the upfront capital costs for emission prevention equipment.
The solid waste definition was revised, just as the Boiler MACT and CISWI were, after their proposal in December 2010. The proposed rule treated resinated wood wastes as non-solid wastes, as long as they were combusted within the control of the generator (i.e. who made the waste). However, if the resinated wood wastes were transferred off-site, say to another facility which might have more of a need for the fuel, they would then be treated as a solid waste, and subject to the CISWI guidelines. However, this was altered from the proposal in the final ruling so that the fuel could be combusted off-site. This is extremely important, because facilities which have a huge waste stream might not have an interest in harnessing that energy. However, the wood waste could be sold to another facility that did. This ruling allows that to be feasible. If the resinated wood waste would have become solid waste according to the EPA by simply crossing a property line, this would have greatly affected the economics and overall feasibility.
8.3.1
Current Boiler MACT Rulings for Biomass
For the purpose of the case studies, the amount of emission control must be determined in order to develop upfront capital costs. However, with the Boiler MACT rule being under such debate, it will likely change over the coming months and years. In fact, many of the rulings have been altered since the December 2010 proposal, especially for biomass. Therefore, a “best guess” must be established as to what rules will stand and which will change.
area source requirements. Emissions can be determined via the EPA’s AP-42 Emission Factor tables, or can be measured by a qualified emission test company. The AP-42 Emission Factors for wood are fairly overprotective, meaning that they likely overestimate the amount of emitted pollutants. Therefore, it is likely that a qualified emission test company will be required to test for actual HAP amounts. The EPA AP-42 Emission Factor tables for wood can be seen in Appendix A – EPA Reference Tables.
There are many air toxins, but the EPA has grouped them into five categories of hazardous air pollutants (HAPs) for the Boiler MACT rule:
1. Mercury (Hg) 2. Dioxins/Furans
3. Particulate Matter (PM) (as a surrogate for non-mercury metals) 4. Hydrogen Chloride (HCl) (as a surrogate for acid gases)
5. Carbon Monoxide (CO) (as a surrogate for non-dioxin organic air toxics)
Depending on the fuel, boiler type, size and location, the boiler might be subject to all or some numerical limits for these 5 HAPs.
Area Source Biomass Boilers
![Figure 3.1 – Fixed Grate Burner Schematic, Hurst Boiler Underfeed Stoker Model [13]](https://thumb-us.123doks.com/thumbv2/123dok_us/1408312.1173431/26.612.142.494.212.507/figure-fixed-grate-burner-schematic-boiler-underfeed-stoker.webp)
![Figure 3.2 – Moving Grate Burner Schematic, Hurst Boiler Chain Grate System [13]](https://thumb-us.123doks.com/thumbv2/123dok_us/1408312.1173431/27.612.115.509.375.634/figure-moving-grate-burner-schematic-hurst-boiler-chain.webp)
![Figure 3.3 – Bubbling (a) and Circulating (b) Fluidizing-Bed Combustion System [12]](https://thumb-us.123doks.com/thumbv2/123dok_us/1408312.1173431/29.612.95.535.73.311/figure-bubbling-and-circulating-fluidizing-bed-combustion-system.webp)
![Figure 4.1 – Gasification Chemistry Steps [12]](https://thumb-us.123doks.com/thumbv2/123dok_us/1408312.1173431/31.612.94.537.328.542/figure-gasification-chemistry-steps.webp)
![Figure 4.2 – Updraft and Downdraft Gasifier Schematics [15]](https://thumb-us.123doks.com/thumbv2/123dok_us/1408312.1173431/35.612.129.500.413.634/figure-updraft-and-downdraft-gasifier-schematics.webp)

![Figure 10.3 – Hurst Boiler Co. 600 bhp Biomass Reciprocating/Moving Grate Boiler [13]](https://thumb-us.123doks.com/thumbv2/123dok_us/1408312.1173431/94.612.70.727.102.397/figure-hurst-boiler-biomass-reciprocating-moving-grate-boiler.webp)