Article
1
Paleoenvironment Variability during Termination I
2
at the Reykjanes Ridge, North Atlantic
3
Alexander Matul 1,*, Max S. Barash 1, Tatyana A. Khusid 1, Padmasini Behera 2, Manish Tiwari 2
4
1 Shirshov Institute of Oceanology, Nahimovskiy prospekt 36, 117997 Moscow, Russia; AM: [email protected],
5
MSB: [email protected], TAK: [email protected]
6
2 National Centre for Antarctic and Ocean Research, Vasco-da-Gama, 403 804 Goa, India; PB:
7
;
MT: [email protected]8
*Correspondence:
9
Alexander Matul, Shirshov Institute of Oceanology, Nahimovskiy prospekt 36, 117997 Moscow, Russia;
10
E-mail: [email protected]; Tel. +7-499-1292172
11
12
Abstract:
13
The micropaleontological study (radiolarians and foraminifera) of the sediment core AMK-340,
14
Reykjanes Ridge, North Atlantic, combined with the radiocarbon dating and Oxygen/Carbon
15
isotopic record, provided data for the reconstruction of the summer paleotemperature on the water
16
depth of 100 m, and paleoenvironments during the Termination I in the age interval of 14.5-8 ka. The
17
response of the main microfossil species on the paleoceanographic changes within the
18
Bølling-Allerød (BA) warming, the Younger Dryas (YD) cold event, and final transition to the warm
19
Holocene was different. The BA warming was well reflected in the radiolarian and benthic but not
20
planktic foraminiferal record. The high abundances of the cold-water radiolarian species
21
Amphimelissa setosa as the Greenland/Iceland Sea indicator marked a cooling at the end of the BA and
22
within the start of the YD at 13.2-12.3 ka. The micropaleontological and isotopic data together with
23
the paleotemperature estimates for the Reykjanes Ridge at 60°N document that, after the warm BA,
24
the middle YD ca. 12.5-12.2 ka was the next significant step toward the Holocene warming. Start of
25
the Holocene interglacial conditions was reflected in abundant occurrence of the microfossils being
26
indicators of the open boreal North Atlantic environments and lower oxygen isotope values
27
indicating increasing warmth.
28
Keywords: global warming and environmental change; Late Quaternary paleoenvironments;
29
Termination I; sea-water paleotemperature; marine microfossils; North Atlantic; stable isotopes
30
31
1. Introduction
32
Our study presents new results on the North Atlantic paleoceanography during the last
33
deglaciation which was time of the abrupt climatic changes (general warming superimposed by
34
sudden short glacial reversals). Climatic situation in the North Atlantic, through the Atlantic
35
thermohaline circulation or North Atlantic meridional overturning circulation (NAMOC), mediates
36
climate on the surrounding land, and climatic connections between hemispheres [1]. The sea surface
37
conditions in the North Atlantic significantly influence the major modes of regional atmospheric
38
circulation (meridional or zonal) [2] causing warming or cooling episodes. Rapid changes in the
39
NAMOC and on the North Atlantic surface during the last deglaciation could be strongly related to
40
the changes of the climatic conditions (global warming, melt-water discharge from land ice, sea-ice
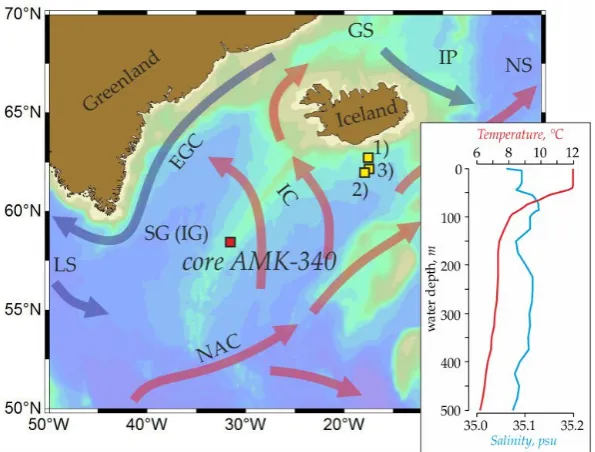
41
distribution) [3]. Overpeck et al. (1998) [4] postulated an apparent synchroneity of the rapid climate
42
events in the circum-North Atlantic during the last deglaciation but called for new high-resolution
43
studies to prove this.
44
We use the micropaleontological data from the sediment core AMK-340, combined with the
45
radiocarbon dating of the absolute age and oxygen/carbon isotopic record, to estimate the sea
46
subsurface summer temperature and to describe the paleoenvironmental changes within the
47
Termination I on the Reykjanes Ridge, at ca. 60°N of the North Atlantic. Multiple publications on the
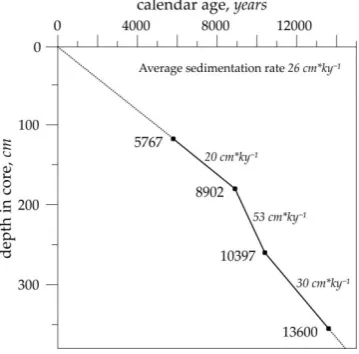
48
Late Quaternary paleoceanography of the subpolar to polar North Atlantic revealed main
49
characteristics of the climatic trends and variations during the last glacial cycle based on the
50
extensive analysis of the micropaleontology and paleotemperature reconstructions [5, and
51
references therein). Our aim is to get an additional quantitative information on the local
52
paleoenvironments (sea subsurface temperature), and compare it with the global/regional
53
paleoclimatic archives. Working approach is a reconstruction of the paleotemperature based on the
54
factor analysis of the radiolarian and planktic foraminiferal data in the same samples of the sediment
55
core. The radiolarian distribution and paleotemperature estimates on the radiolarians (old
56
“graphical” paleotemperature method, and method of spline interpolations as a modification of the
57
Q-mode analysis) for the core AMK-340 was presented by Matul [6], and Matul and Yushina [7].
58
This paper uses a deeply reworked modern radiolarian database, corrected radiolarian data in the
59
method of the Q-mode analysis and transfer functions realized as a software PanTool Box [8], and
61
involves unpublished data on the planktic and benthic foraminifera in the core.
62
The study area is located on the eastern margin of the Subpolar (Irminger) Gyre. The western
63
branch of the Irminger Current, splitted from the warm North Atlantic Current, influences a modern
64
oceanographic situation on the Reykjanes Ridge [9]. Conversion of surface/deep warm/cold waters
65
of the Irminger Current, East Greenland Current, and Labrador Sea Water within the Irminger Gyre
66
is unstable exhibiting large interannual variability of the water flows on the sea surface and deeper
67
levels thus complicating the local features of the NAMOC [10]. The average summer sea surface
68
temperature in the location of the core AMK-340 is ca. 12°C [11]. At the end of the last glacial period,
69
before ca. 14 thousand years ago (ka), sea surface temperatures south of Iceland dropped down to
70
0-2°C [12], and we expect to get a picture of the prominent temperature and environmental changes
71
within the transition from the last glacial to the Holocene interglacial on the Reykjanes Ridge.
72
2. Material and Methods
73
The sediment gravity core AMK-340, 4th cruise of the Russian RV “Akademik Mstislav
74
Keldysh” in 1982, was obtained from the central area of the Reykjanes Ridge, North Atlantic
75
(58°30.6’N, 31°31.2’W; water depth of 1689 m; core length of 387 cm) (Figure 1). A general lithology
76
of the core is (1) 0 to 241 cm pelitic calcareous muds with CaCO3 content of 40-50%, (2) 241 to 307 cm
77
pelitic weakly calcareous muds with CaCO3 content of 10-25%, (3) 307 to 387 cm pelitic muds with
78
CaCO3 content of ≈10% intermittent by the thin layers of the pelitic weakly siliceous muds.
80
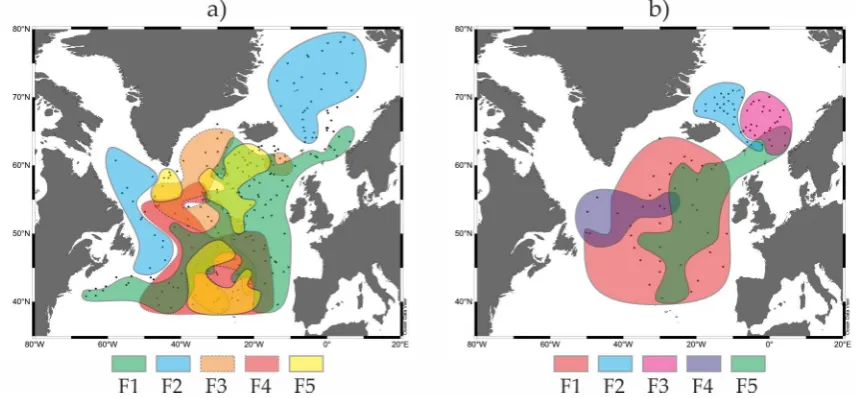
Figure 1. Core location (red square) and modern regional oceanographic conditions. Sediment cores (yellow
81
squares) which were mentioned in the paleoceanographic interpretations: 1) RAPiD-10-1P, 62.9755°N,
82
17.5895°W, 1237 m water depth; 2) RAPiD-12-1K, 62.09°N, 17.82°W, 1938 m water depth; 3) RAPiD-15-4P:
83
62.293°N, 17.134°W, 2133 m water depth [13-14]. Vertical summer salitity/temperature profiles are extracted
84
from the World Ocean Atlas 2013 [11, 15]. Red and blue arrows schematically show flows of the warm and cold
85
waters, respectively. GS is Greenland Sea, IP is Iceland Plateau, NS is Norwegian Sea, EGC is East Greenland
86
Current, IC is Irminger Current, SG (IG) is Subpolar (Irminger) Gyre, LS is Labrador Sea, NAC is North Atlantic
87
Current.
88
Chronology of the core has been established from the four AMS 14C-datings of the planktic
89
foraminifera Neogloboquadrina (N.) pachyderma (sin.) shells in the Leibniz Laboratory for Radiometric
90
Dating and Stable Isotope Research at the Christian-Albrechts-University of Kiel, Germany (Table 1).
91
Table 1. List of the accelerator mass spectrometer 14C-datings of the absolute age of the sediment core
92
AMK-340. Conversion of 14C-datings to the calendar ages was made according [16].
93
Depth in core 14C-datings, years Calendar age, years Dating code
118 cm 5480±50 5767 KIA4187
181 cm 8030±60 8902 KIA4188
260 cm 9220±60 10397 KIA4189
Radiocarbon ages were converted to the calendar ones by the calibration program CALIB 7.1
94
using MARINE13 scale (standard reservoir age correction R is 405 years with ∆R of 85±79 years) [16].
95
Age-depth plot is presented in Figure 2. The core AMK-340 spans from ca. 5.7 to ca. 14.5 ka, which is
96
the mid-Holocene and the end of the last glacial period including most part of the Bølling-Allerød
97
(BA) warming, and Younger Dryas (YD) cooling. To identify the above-mentioned paleoclimatic
98
intervals, we have used the standard ages of the Greenland stadials and interstadials from the
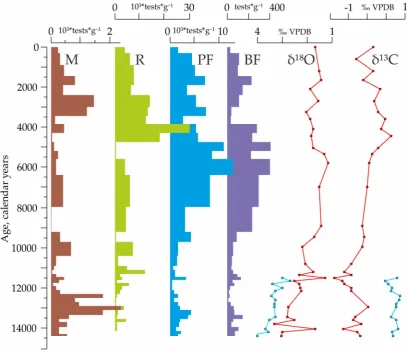
99
INTIMATE event stratigraphy [17]: start of the BA is at ca. 14.7 ka, start of the YD is at ca. 12.9 ka,
100
and start of the Holocene is at ca. 11.7 ka. Average sedimentation rate of the core is ≈26 cm*ky-1. The
101
planktic foraminiferal species N. pachyderma (sin.) and Globigerina (G.) bulloides tests were picked out
102
for the oxygen and carbon isotopic analysis in the Marine Stable Isotope Lab (MASTIL) of the
103
National Centre of Antarctic and Ocean Research, Vasco-da-Gama, Goa, India. The size range of the
104
planktic foraminiferal tests chosen is >100 μm. The external precisions of δ18O and δ13C analysis are
105
±0.15‰ and ±0.09‰, respectively (1σ standard deviation) obtained by repeatedly running NBS-19 as
106
the Standard (n=33). The δ18O and δ13C values are reported with respect to V-PDB.
107
108
Figure 2. Age-depth plot for the core AMK-340 based on the AMS 14C-datings converted to the calendar ages
109
(black squares). Sedimentation rates are displayed.
110
We studied the marine microfossils (polycystine radiolarians as siliceous microorganisms, and
111
benthic and planktic foraminifera as calcareous microorganisms) in 37 sediment samples of 2-cm
112
thickness throughout the core with the best time resolution of 133 years. The interpretation of the
113
changes occurred within the transition between conditions of the last glacial time and recent
115
Holocene interglacial state.
116
For the radiolarian analysis, air-dried sediment samples of 1-2 g were boiled in a solution of
117
30% hydrogen peroxide and sodium pyrophosphate, and the carbonates were removed by adding
118
solution of 10% hydrochloric acid. The residue was washed through a 50 μm sieve, and then limited
119
part of the washed fraction was settled on the cover glass and mounted on the slide in Canada
120
balsam. As a rule, at least 250-300 radiolarians tests were counted under the transmitted light
121
microscope at the x300-600 magnification.
122
For the foraminiferal analysis, air-dried sediment samples of available weight were washed
123
through 100 μm sieve, and then numbers of the benthic and planktic species, and mineral grains
124
were counted.
125
The sea paleotemperature was reconstructed by a method of Q-mode factor analysis and
126
transfer functions. A PaleoTool Box software with its latest PC-version [8] provides complete
127
facilities to make a statistical environmental analysis of the micropaleontological data and to
128
estimate conditions of the marine paleohabitat.
129
Transfer functions which allow paleotemperature estimates are based on the treatment of the
130
modern micropaleontological datasets. The North Atlantic reference datasets on the microfossils in
131
our study are counts of (1) 36 polycystine radiolarian species in 91 bottom surface sediment samples
132
from the area between 40 and 73°N [18], and (2) 23 planktic foraminiferal species in 237 bottom
133
surface sediment samples from the area between 40 and 80°N as a compilation from the Atlantic
134
Ocean database of the Shirshov Institute of Oceanology, Moscow, Russia (134 stations from [19]) and
135
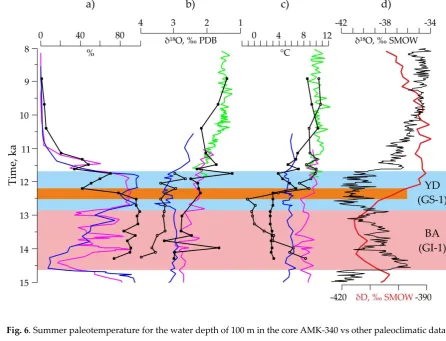
World Ocean database (103 stations from [20]. Stations are presented in Figure 3. Limitations to the
136
construction of modern datasets are described in details by Matul and Mohan [18] regarding the
137
radiolarians study but they also can be applied to the planktic foraminifera. The southern boundary
138
of stations in our datasets is approximately 40°N because, north of this latitude, the North Atlantic
139
was an area of the extremely pronounced environmental changes associated with movements of the
140
Subpolar Front during the Late Quaternary glacials [e.g., 21]. We used the micropaleontological
141
information from those stations which were sampled before 1980th, i.e., before an instability of the
142
environmental (climatic) signal, may not be affected by the significant short-term intra-decadal
144
hydrological changes within the last decades. A temperature at the subsurface depth of 100 m is
145
chosen as a basic parameter for the interpretation because this depth can be a median level of the
146
prevailed habitat of radiolarians [23] and planktic foraminifera [24]. In the North Atlantic, the
147
highest abundances of the marine microzooplankton were found during May-September [25-26],
148
and we operate with summer temperature. The World Ocean Atlas 2013 [11] provides data on the
149
modern summer temperature in the North Atlantic and Nordic Seas averaged for 1955-1964.
150
3. Results and Discussion
151
3.1. Modern distribution of the radiolarian and planktic foraminiferal factors (= assemblages) as a base for the
152
paleotemperature estimates
153
Factor analysis revealed 5 Factors in the modern distribution of both planktic foraminifera and
154
radiolarians (Figure 3). They describe main oceanographic provinces within the studied area.
155
156
Figure 3. Generalized areas of Factors (≈ assemblages): a) planktic foraminiferas (PF) (this study), b)
157
radiolarians (R) (modified from [18] with simplification) in the bottom surface sediments of the North Atlantic.
158
F1 is Factor 1 with loadings >0.6 and >0.8 for PF and R, respectively, F2 is Factor 2 with loadings <-0.9 and >0.9
159
for both PF and R, respectively, F3 is Factor 3 with loadings >0.5 for both PF and R, F4 is Factor 4 with loadings
160
>0.4 for both PF and R, F5 is Factor 5 with loadings >0.1 for both PF and R.
161
Cold-water end-member is Factor 2, with a leading foraminiferal species N. pachyderma (sin.)
162
are typical for Greenland, Iceland, western and northern Norwegian, and Labrador Sea. Similarly,
164
radiolarian assemblages of Factor 2 occur in the southern Greenland and Iceland Seas but not in the
165
Labrador Sea. The Polar/Arctic waters occupy these areas contacting with branches of the warmer
166
Atlantic waters. Temperate-water Factor 1 lies within the boreal open North Atlantic, where the
167
dominant species are foraminiferal N. pachyderma (dex.) and radiolarian Lithelius (L.) spiralis/minor
168
group. Other factors give an additional view on the regional patterns of the microfauna in the open
169
North Atlantic. Foraminiferal Factors 3, 4, and 5 are distributed in the western, southern to
170
southwestern, and central parts of the North Atlantic between latitudes of 40 and 65°N with leading
171
species Turborotalia quinqueloba, G. bulloides, and Globigerinita glutinata, respectively. Radiolarian
172
Factors 4 (dominated by Artostrobium tumidulum and Phorticium clevei) and 5 (dominated by
173
Lithomelissa setosa and Stylodictya validispina) indicate the mixing waters of the Labrador Sea and
174
western North Atlantic, and eastern North Atlantic, respectively. Radiolarian Factor 3 (dominated
175
by Pseudodictyophimus gracilipes and Actinomma boreale/A. leptoderma group) is typical for the southern
176
Norwegian Sea, an area of the active interaction of the warmer Atlantic and colder Arctic waters; it
177
has no counter partner in the foraminiferal distribution.
178
Patterns in the distribution of Factors (= microfaunal assemblages) clearly reflect the
179
biogeographic realms of the open North Atlantic and Nordic Seas inferred from different groups of
180
the marine animals and plants [27], radiolarians [28], and planktic foraminifera [29, and references
181
therein]. We present here only generalized areas of the factors as details both on factors and typical
182
species distribution were described in [e.g., 30] for planktic foraminifera, and in [18, 31] for
183
radiolarians. For our purposes it is important to fix that the microfaunal assemblages are closely
184
related to the different environments associated with the cold Polar/Arctic (the Nordic and Labrador
185
Seas with temperatures of 0-5°C on 100-m depth level) and warm temperate (the open North
186
Atlantic with temperatures of 8-15°C on 100-m depth level) water masses. This conclusion gives us a
187
possibility to estimate, based on the transfer functions, the paleotemperature shifts at the principal
188
climatic transitions like the sharp global warming (Termination I) between the last glacial maximum
189
21 ka and the Holocene as recent interglacial time (start at 11.7 ka) when the temperatures on
190
sea-surface in the high latitudes and air temperatures in Greenland could increase at least on 3-6°C
191
3.2. Main indications of the warm and cold-water events in the down-core records covering Termination I
193
14.5-11.7 ka.
194
The most prominent warming event within the Termination I (BA), and the following cold YD
195
event as a return to the quasi-glacial state had a weak reflection in the records of the total
196
microfaunal abundances (Figure 4). Associated changes in the accumulation of radiolarians and
197
planktic/benthic foraminifera were subtle with small peaks during the BA and stable low values
198
during the YD.
199
200
Figure 4. Main initial micropaleontological and isotopic data on the core AMK-340. M is a number of the
201
mineral grains in the sediment fraction >100 μm calculated per 1 g of dry bulk sediment. R, PF and BF are total
202
abundances of radiolarians, planktic and benthic foraminiferas, respectively, calculated per 1 g of dry bulk
203
sediment. δ18O and δ13C were measured in the shells of the planktic foraminiferas G. bulloides (red line) and N.
204
pachyderma sin. (blue line).
The response of the main species characterizing the microfossil factors on the paleoclimatic
206
changes within the BA and YD was different (Figure 5). The boreal radiolarian indicator L.
207
spiralis/minor group had high abundances comparable to the modern ones during the BA warming,
208
then decreased in numbers during the cold YD before reaching its typical percentages at the
209
beginning of the Holocene (Figure 5a). Similar changes can be recognized in the distribution of the
210
benthic foraminifera Cassidulina (C.) teretis which feed on the bacterias from the soft, enriched by the
211
organic matter sediments [33]. In contrast, the polar species N. pachyderma (sin.) permanently
212
dominated (40 to 100%) the planktic foraminiferal assemblages both during the warm BA and cold
213
YD indicating the persistent cold-water conditions on the subsurface depths. But the radiolarian
214
species A. setosa, which is typical for cold-water Greenland and Iceland Seas [31], had a very
215
prominent peak just at the final part of the BA and earlier part of the YD ca. 13.2-12.3 ka up to 40%
216
being rare or absent before and after.
217
218
Figure 5. Down-core distribution of the main radiolarian, planktic and benthic foraminiferal species. Temperate
219
North Atlantic species: a) radiolarian L. spiralis/minor group, and b) planktic foraminifera N. pachyderma dex.
220
Subpolar/Polar species: c) radiolarian A. setosa, and d) planktic foraminifera N. pachyderma sin. Benthic
221
foraminiferas: e) G. subglobosa as marker of spring phytodetrital fluxes [34], and f) C. teretis as dweller in soft
222
surface sediment, rich on bacterias, being abundant during the summer [33].
We may suppose that a specific oceanographic situation existed on the Reykjanes Ridge during
224
this 1-ky long time as high percentages of A. setosa in the Nordic Seas mark environments of the
225
active mixing of cold (down to ca. -2°C), relatively refreshed Arctic/Polar waters and warmer saline
226
North Atlantic water [35]. Together with A. setosa, a significant increase in the abundances of the
227
mineral grains in the sediment fraction of >100 μm marks interval of the YD (Figure 4). Probably, this
228
can be an indication of the Heinrich-like event H-0 as a massive accumulation of the ice-rafted
229
sediment material on the bottom of the northwestern Atlantic Ocean occurred during the YD [36].
230
Andrews [37] proposed the Hudson Bay as a source area for the ice-rafted sediments. However, high
231
abundances of the Greenland cold-water radiolarian species A. setosa, which is rare now in the
232
Labrador Sea, could point on the southern Nordic Seas to be main origin place of the ice-rafting
233
within the YD on the Reykjanes Ridge.
234
The final transition toward the recent interglacial state occurred coincidently in all
235
micropaleontological records of the core AMK-340 at the end of the YD. But the first changes
236
indicating the warming started in the middle YD chronozone just after time level of 12.5 ka (Figure
237
5). For example, the indicator of the open North Atlantic waters, planktic foraminiferal species N.
238
pachyderma (dex.), and benthic foraminiferal species G. subglobosa as a marker of high phytodetrital
239
fluxes [34] significantly increased percentages or even appeared (in the latter case) from this level.
240
Thus, according to our data on the distribution of the microfossils, the final half of the YD might be
241
an interval of the progressed warming on the Reykjanes Ridge at the latitude of ca. 60°N.
242
The oxygen isotopic signal δ18O in the planktic foraminiferal shells of both N. pachyderma (sin.)
243
and G. bulloides exhibits rather monotonous shift (with short deviations) to the “lighter” values from
244
14.5 to ca. 11 ka (Figure 6). Time interval of 8 to 5.5 ka with lower δ18O values of 1.5-1 ‰ (Figure 4)
245
can represent a thermal optimum of the middle Holocene within the Atlantic chronozone [38]. This
246
is supported by the prominent peak of the elevated total abundances of the planktic and benthic
247
foraminifera. We are aware that the δ18O changes can’t act as a conclusive paleotemperature index
248
because δ18O of the foraminiferal shells reflect the δ18O of sea water as well governed predominantly
249
by ice volume change on land [39]. Nevertheless, both the temperature increase and hence lesser
250
ice-volume will lower the δ18O values, which we observe during 8-5.5 ka. Interpretation of the δ13C
251
photosynthesis vs respiration ratio in the surface to subsurface waters, δ13C of the dissolved
253
inorganic carbon, carbonate system parameters, and also temperature [39-40]. Temperature though
254
has a very small effect on the δ13C values with a slope of 0.1‰ increase per degree Celsius decrease
255
in temperature [39]. Though, it is advisable to use δ13C variability in combination with other proxies.
256
In our study, δ13C of G. bulloides increases from early Holocene to mid-Holocene and declines
257
slightly thereafter (Figure 4). The total abundances of radiolarians, planktic and benthic foraminifera
258
also show a similar variability (Figure 4). The abundance of benthic foraminiferal species G.
259
subglobosa – marker of spring phytodetrital fluxes, and C. teretis – inhabits surface sediments rich on
260
bacterias, also increase during the Holocene (Figure 5). During BA warming, the δ13C values as well
261
as the abundances of planktic and benthic foraminifera, and percentages of benthic foraminifera C.
262
teretis increase slightly. Thus, we infer that the δ13C values of planktic foraminifera G. bulloides reflect
263
the increased photosynthetic activity during the warm periods.
264
3.3. Paleotemperature estimates for the core AMK-340 and correlation with other paleoclimatic archives.
265
As discussed in the previous subsection, a reaction of the radiolarian and foraminiferal
266
assemblages from the core AMK-340 on the paleoceanographic oscillations during the Termination I
267
was not concurrent. Our micropaleontological records do not coincide in details with the
268
conventional warmings and coolings, the Greenland Stadials and Interstadials [17], at the transition
269
to the Holocene. Reconstructions of the paleotemperature for 100-m water depth (Figure 6) are also
270
272
Fig. 6. Summer paleotemperature for the water depth of 100 m in the core AMK-340 vs other paleoclimatic data:
273
a) down-core distribution of the polar planktic foraminifera N. pachyderma sin. in the cores AMK-340, black line
274
with black dots [this study], RAPiD10-1P, blue line, RAPiD-12-1K, green line, and RAPiD15-1P, purple line
275
[13-14]; b) oxygen isotopic curves for the cores AMK-340, black line with solid black dots based on G. bulloides
276
shells and black line with open dots based on N. pachyderma sin. shells [this study], RAPiD10-1P, blue line based
277
on N. pachyderma sin. shells, RAPiD-12-1K, green line based on G. bulloides shells, and RAPiD15-1P, purple line
278
based on G. bulloides shells [13-14]; c) paleotemperature for the cores AMK-340, black line with solid black dots
279
based on the planktic foraminifera and black line with open dots based on the radiolarians (this study),
280
RAPiD10-1P, blue line based on Mg/Ca in N. pachyderma sin. shells, RAPiD-12-1K, green line based on Mg/Ca in
281
G. bulloides shells, and RAPiD15-1P, purple line based on Mg/Ca in G. bulloides shells [13-14]; d) oxygen isotopic
282
curve for the Greenland NGRIP ice core, black line [41], and deuterium curve for the Antarctic EPICA ice core
283
[42]. Light-blue stripe is an interval of the cold YD (Greenland Stadial GS-1), rose stripe is an interval of the
284
warm BA (Greenland Interstadial GI-1), and light-brown stripe is a transition to the warmer conditions [this
285
study] within the conventional cold YD.
The foraminiferal temperature had monotonous, low values of 2-3°C from 14.5 to ca. 12.2 ka,
287
and then it started to increase, with some fluctuations, up to 8-10°C at the beginning of Holocene.
288
Low but weakly variable foraminiferal temperature could arise from the stable dominance of the
289
polar species N. pachyderma (sin.). The monospecific (N. pachyderma (sin.)) planktic foraminiferal
290
assemblages now are distributed in the cold-water Labrador and Seas within the wide range of
291
summer sea-surface temperatures of 6 to -2°C [43] or, in our database, summer temperature at 100 m
292
depth of 3 to -1°C. It could be that the statistical program of the paleotemperature calculations,
293
operating with N. pachyderma (sin.) dominance, may not provide the proper values from this
294
temperature range.
295
The radiolarian paleotemperature at the BA start, in contrast to the foraminiferal one, exhibits
296
high values of about 8°C being comparable with modern and Holocene numbers in the area. It
297
dropped steadily toward the BA end, and was very low of 0 to -2°C from ca. 13.5 to 12.5 ka, i.e., just
298
until the middle YD cold interval.
299
The next warming step after the BA, as documented both by the radiolarian and foraminiferal
300
temperatures, occurred in the area of core AMK-340 12.5-12.2 ka (Figure 6) or considerably earlier
301
than the Holocene started. Neither oxygen isotopic records nor sea-surface paleotemperature
302
estimates on Mg/Ca in the planktic foraminifera, and percentages of the polar N. pachyderma (sin.)
303
from the North Atlantic cores south of Iceland [13-14] fixed such event. But some other studies can
304
support our results. Pearce et al. [44] found the start of the pre-Holocene warming at the time level of
305
12.2 ka based on the diatom study of the sediment core south of Newfoundland. They concluded the
306
evident difference of the early to late YD local paleoceanography. Ebbesen and Hald [45] reported
307
similar results on the cold YD before 12.5 ka and warmer conditions after this level in the Norwegian
308
Sea. We may see a good visual correlation of this warming step with a sharp change from lower to
309
higher δD values in the Antarctic EPICA ice-core records [42]. This can allow us to suspect in our
310
records of the subsurface paleotemperature a teleconnection to the paleoclimatic changes in the
311
Southern Hemisphere which was proposed, e.g., by Rickaby and Elderfield [46] for the coolings
312
during the pre-BA Heinrich-1 event and YD, and by Barker et al. [47] for some abrupt paleoclimatic
313
4. Conclusions.
315
The North Atlantic areas of the radiolarian and planktic foraminiferal assemblages or main
316
Factors, as defined by the Q-mode analysis of the PanTool Box software, match together in their
317
general outlines and reflect a regional biogeography, distribution and interaction of the major cold-
318
and warm-water masses. However, there is a dissimilarity possibly arising from the specific habitat
319
of different radiolarian and foraminiferal species.
320
The response of the main microfossil species on the paleoceanographic changes within the
321
transition from the BA warming BA through the cold YD to the warm Holocene was different. The
322
BA warming was well reflected in the radiolarian and benthic but not planktic foraminiferal record.
323
The cold-water radiolarian species A. setosa as the Greenland Sea indicator is, probably, alone to
324
mark cooling at the end of the BA and within the start of the YD event 13.2-12.3 ka. Our
325
micropaleontological and isotopic data along with the paleotemperature estimates for the Reykjanes
326
Ridge at ca. 60°N document that, after the warm BA, the middle YD ca. 12.5-12.2 ka is the next
327
significant step toward the Holocene warming. Probably, the paleoceanographic changes in the area
328
of study during the global warming within the Termination I occurred on the subsurface depths
329
earlier than on the sea surface.
330
Author Contributions: Conceptualization, Alexander Matul; Methodology, Alexander Matul, Max S. Barash,
331
and Manish Tiwari; Investigation, Alexander Matul, Max S. Barash, Tatyana A. Khusid, Padmasini Behera, and
332
Manish Tiwari; Writing – Original Draft Preparation, Alexander Matul, and Manish Tiwari; Writing – Review &
333
Editing, Alexander Matul, and Manish Tiwari.
334
Funding: This research was funded the Russian Science Foundation and Department of Science and
335
Technology of the Ministry of Science and Technology of India, Joint Project No. 16-47-02009. The funds for the
336
same were extended by National Centre for Antarctic and Ocean Research (NCAOR), Goa, Ministry of Earth
337
Sciences. Funding of the work on the initial micropaleontological data was from the Russian Agency of the
338
Scientific Organization, Project № 0149-2018-0016 for the Shirshov Institute of Oceanology, Moscow, Russia.
339
Acknowledgments: The authors are grateful for support from the Russian Government, the Russian Science
340
Foundation and the Administration of Shirshov Institute of Oceanology. MT and PB would like to thank the
Secretary, Ministry of Earth Sciences, Govt. of India and the Director, National Centre for Antarctic and Ocean
342
Research for extending support to this project (NCAOR Contribution No. XX/XXXX). The authors thank Dr.
343
R.F. Spielhagen, GEOMAR Helmholtz Centre for Ocean Research, Kiel, Germany, and Dr. H. Erlenkeuser, The
344
Leibniz Laboratory for Radiometric Dating and Stable Isotope Research, Christian-Albrechts-University of Kiel,
345
Germany, for providing of the 14C-datings.
346
Conflicts of Interest: The authors declare no conflict of interest. The founding sponsors had no role in the
347
design of the study; in the collection, analyses, or interpretation of data; in the writing of the manuscript, and in
348
the decision to publish the results.
349
References
350
1. Delworth, T.L.; Zeng, F. The Impact of the North Atlantic Oscillation on Climate through Its Influence
351
on the Atlantic Meridional Overturning Circulation. J Climate 2016, 29, 9412-962. DOI:
352
10.1175/JCLI-D-15-0396.1.
353
2. Löfverström, M.; Lora, J.M. Abrupt regime shifts in the North Atlantic atmospheric circulation over the
354
last deglaciation. Geophys. Res. Lett. 2017, 44, 8047-8055. DOI:10.1002/2017GL074274.
355
3. Knorr, G.; Lohmann, G. Rapid transitions in the Atlantic thermohaline circulation triggered by global
356
warming and meltwater during the last deglaciation. Geochem. Geophys. Geosyst. 2007, 8, Q12006: 22.
357
DOI:10.1029/2007GC001604.
358
4. Overpeck, J.T.; Peterson, L.C.; Kipp, N.; Rind, D. Climate change in the circum-North Atlantic region
359
during the last deglaciation. Nature 1989, 338, 553-557. DOI:10.1038/338553a0.
360
5. Bauch, H.A.; Kandiano, E.S.; Helmke, J.P. Contrasting ocean changes between the subpolar and polar
361
North Atlantic during the past 135 ka. Geophys. Res. Lett. 2012, 39, L11604: 7.
362
DOI:10.1029/2012GL051800.
363
6. Matul, A.G. On the problem of paleoceanological evolution of the Reykjanes ridge region (North
364
Atlantic) during the last deglaciation based on a study of radiolaria. Oceanology 1995, 34, 806-814.
365
7. Matul, A.G.; Yushina, I.G. Radiolarians in North Atlantic sediments. Ber. Polarforsch. 1999, 306, 35-45.
366
8. Sieger, R.; Grobe, H. PanTool – a Swiss Army Knife for data conversion and recalculation. PANGAEA:
367
Alfred Wegener Institute, Helmholz Center for Polar and Marine Research (AWI), Bremerhaven,
Center for Marine Environmental Sciences, University Bremen (MARUM), Bremen, Germany, 2012.
369
Available online: https://doi.org/10.1594/PANGAEA.787549 (accessed on 31 July 2018).
370
9. Krauss, W. Currents and mixing in the Irminger Sea and in the Iceland Basin. J. Geophys. Res. 1995,
371
100(C6), 10,851-10,871.
372
10. Våge, K.; Pickart, R.S.; Sarafanov, A.; Knutsen, Ø.; Mercier, H.; Lherminier, P.; van Aken, H.M.;
373
Meincke, J.; Quadfasel, D.; Bacon, S. The Irminger Gyre: Circulation, convection, and interannual
374
variability. Deep-Sea Research I 2011, 58, 590-614. DOI:10.1016/j.dsr.2011.03.001.
375
11. Locarnini, R.A.; Mishonov, A.V.; Antonov, J.I.; Boyer, T.P.; Garcia, H.E.; Baranova, O.K.; Zweng, M.M.;
376
Paver, C.R.; Reagan, J.R.; Johnson, D.R.; et al. World Ocean Atlas 2013. NOAA, U.S. Department of
377
Commerce: Washington, DC, USA, 2013; NOAA Atlas NESDIS 73, Volume 1: Temperature. Available
378
online: https://www.nodc.noaa.gov/OC5/woa13 (accessed on 31 July 2018).
379
12. Weinelt, M.; Vogelsang, E.; Kucera, M.; Pflaumann, U.; Sarnthein, M.; Voelker, A.; Erlenkeuser, H.;
380
Malmgren, B.A. Variability of North Atlantic heat transfer during MIS 2. Paleoceanography 2003, 18,
381
1071: 18. DOI:10.1029/2002PA000772.
382
13. Thornalley, D.J.R.; McCave, I.N.; Elderfield ,H. Freshwater input and abrupt deglacial climate change
383
in the North Atlantic. Paleoceanography 2010, 25, PA1201. DOI:10.1029/2009PA001772.
384
14. Thornalley, D.J.R.; Elderfield, H.; McCave, I.N. Reconstructing North Atlantic deglacial surface
385
hydrography and its link to the Atlantic overturning circulation. Global Planet. Change 2011, 79, 163-175.
386
DOI: 10.1016/j.gloplacha.2010.06.003.
387
15. Zweng, M.M.; Reagan, J.R.; Antonov, J.I.; Locarnini, R.A.; Mishonov, A.V.; Boyer, T.P.; Garcia, H.E.;
388
Baranova, O.K.; Johnson, D.R.; Seidov, D.; Biddle, M.M. World Ocean Atlas 2013.NOAA, U.S.
389
Department of Commerce: Washington, DC, USA, 2013; NOAA Atlas NESDIS 74, Volume 2: Salinity.
390
Available online: https://www.nodc.noaa.gov/OC5/woa13 (accessed on 31 July 2018).
391
16. Stuiver, M.; Reimer, P.J.; Reimer, R.W., CALIB 7.1 [WWW program], 2018. Available online:
392
http://calib.org (accessed on 31 July 2018).
393
17. Rasmussen, S.O.; Bigler, M.; Blockley, S.P.; Blunier, T.; Buchardt, S.L.; Clausen, H.B.; Cvijanovic, I.;
394
Dahl-Jensen, D.; Johnsen, S.J.; Fischer, H.; et al. A stratigraphic framework for abrupt climatic changes
395
during the Last Glacial period based on three synchronized Greenland ice-core records: refining and
extending the INTIMATE event stratigraphy. Quaternary Sci. Rev. 2014, 106, 14-28.
397
http://dx.doi.org/10.1016/j.quascirev.2014.09.007.
398
18. Matul, A.; Mohan, R. Distribution of Polycystine Radiolarians in Bottom Surface Sediments and Its
399
Relation to Summer Sea Temperature in the High-Latitude North Atlantic. Front. Mar. Sci. 2017, 4, 330:
400
1-330: 12. DOI:10.3389/fmars.2017.00330.
401
19. Barash, M.S. Fossil Plankton Stratigraphies. NOAA/NGDC Paleoclimatology Program: Boulder, CO,
402
USA, 1993; IGBP PAGES/World Data Center-A for Paleoclimatology Data Contribution Series # 93-037.
403
Available online:
404
https://www1.ncdc.noaa.gov/pub/data/paleo/paleocean/fossil_plankton/russian_fossil_plankton
405
(accessed on 31 July 2018).
406
20. Pflaumann, U.; Duprat, J.M.; Pujol, C.; Labeyrie, L.D. Distribution of planktic foraminifera in surface
407
sediments of the Atlantic Ocean. 1996. PANGAEA: Alfred Wegener Institute, Helmholz Center for
408
Polar and Marine Research (AWI), Bremerhaven, Center for Marine Environmental Sciences,
409
University Bremen (MARUM), Bremen, Germany, 1996. Available online:
410
https://doi.org/10.1594/PANGAEA.51621 (accessed on 31 July 2018).
411
21. Labeyrie, L.; Vidal, L.; Cortijo, E.; Paterne, M.; Arnold, M.; Duplessy, J.C.; Vautravers, M.; Labracherie,
412
M.; Duprat, J.; Turon, J.L.; et al. Surface and Deep Hydrology of the Northern Atlantic Ocean during
413
the past 150 000 Years. Phil. Trans. R. Soc. Lond. B 1995, 348, 255-264. DOI:10.1098/rstb.1995.0067.
414
22. Stocker, T.F.; Knutti, R.; Plattner, G.-K. The Future of the Thermohaline Circulation – a Perspective. In
415
The Oceans and Rapid Climate Change: Past, Present, and Future, Geophysical Monograph Series 126, 1st ed.;
416
Seidov, D., Haupt, B.J., Maslin, M., Eds.; American Geophysical Union: Washington, DC, USA, 2013;
417
pp. 277-293, ISBN 0-87590-985-X.
418
23. Zas'ko, D.N. Quantitative distribution of radiolarians in the North Atlantic plankton. Oceanology 2001,
419
41(12), 86-93.
420
24. Rebotim, A.; Voelker, A.H.L.; Jonkers, L.; Waniek, J.J.; Meggers, H.; Schiebel, R.; Fraile, I.; Schulz, M.;
421
Kucera, M. Factors controlling the depth habitat of planktonic foraminifera in the subtropical eastern
422
North Atlantic. Biogeosciences 2017, 14, 827-859. DOI:10.5194/bg-14-827-2017.
423
25. Colebrook, J.M. Continuous plankton records: seasonal variations in the distribution and abundance
424
of plankton in the North Atlantic Ocean and the North Sea. J. Plankton Res. 1982, 4, 435-462.
26. Parsons, T. R., Takahashi, M., Hargrave, B. Biological oceanographic processes, 3rd Edition. Pergamon
426
Press: Oxford, UK, 1984, ISBN 9781483286174.
427
27. Costello, M.J.; Tsai, P.; Wong, P.S.; Cheung, A.K.L.; Basher, Z.; Chaudhary, C. Marine biogeographic
428
realms and species endemicity. Nat. Commun. 2017, 8, 1057: 1-1057: 10.
429
http://doi.org/10.1038/s41467-017-01121-2.
430
28. Boltovskoy, D.; Correa, N. Biogeography of Radiolaria Polycystina (Protista) in the World Ocean.
431
Prog. Oceanogr. 2016, 149, 82-105. DOI:10.1016/j.pocean.2016.09.006.
432
29. Boltovskoy, D. Foraminifers (Planktonic). In Encyclopedia of Marine Geosciences; Harff, J., Mesched, M.,
433
Petersen, S., Thiede, J., Eds.; Springer Science+Business Media: Dordrecht, Netherlands, 2014; pp. 1-9,
434
ISBN 978-94-007-6238-1.
435
30. Kipp, N.G. New Transfer Function for Estimating Past Sea-Surface Conditions from Sea-Bed
436
Distribution of Planktonic Foraminiferal Assemblages in the North Atlantic. Mem. Geol. Soc. Am. 1976,
437
145, 9-42. DOI:10.1130/MEM145-p3.
438
31. Bjørklund, K.R.; Cortese, G.; Swanberg, N.R.; Schrader, H.J. Radiolarian faunal provinces in surface
439
sediments of the Greenland, Iceland and Norwegian (GIN) Seas. Mar. Micropaleontol. 1998, 35, 105-140.
440
32. Clark, P.U.; Shakun, J.D.; Baker, P.A.; Bartlein, P.J.; Brewer, S.; Brook, E.; Carlson, A.E.; Cheng, H.;
441
Kaufman, D.S.; Liu, Z.; et al. Global climate evolution during the last deglaciation. P. Natl. A. Sci. USA
442
2012, 109 (19), E1134-E1142. DOI:10.1073/pnas.1116619109.
443
33. Gooday, A.J.; Lambshead, P.J.D. Influence of seasonally deposited phytodetritus on benthic
444
foraminiferal populations in the bathyal northeast Atlantic: the species response. Mar. Ecol. Prog. Ser.
445
1989, 58, 53-67.
446
34. Suhr, S.B.; Pond, D.; Gooday, A.J.; Smith, C.R. Selective feeding by benthic foraminifera on
447
phytodetritus on the western Antarctic Peninsula shelf: evidence from fatty acid biomarker analysis.
448
Mar. Ecol. Prog. Ser. 2003, 262, 153-162.
449
35. Bjørklund, K.R.; Hatakeda, K.; Kruglikova, S.B.; Matul, A.G. Amphimelissa setosa (Cleve) (Polycystina,
450
Nassellaria) – a stratigraphic and paleoecological marker of migrating polar environments in the
451
northern hemisphere during the Quaternary. Stratigraphy 2015, 12, 23-37.
452
36. Hillaire-Marcel, C.; de Vernal, A. 2008. Stable isotope clue to episodic sea ice formation in the glacial
453
North Atlantic. Earth Planet. Sc. Let. 2008, 268, 143-150. https://doi.org/10.1016/j.epsl.2008.01.012.
37. Andrews, J.; Jennings, A.E.; Kerwin, M.; Kirby, M.; Manley, W.; Miller, G.H.; Bond, G.; MacLean, B. A
455
Heinrich-like event, H-0 (DC-0): Source(s) for detrital carbonate in the North Atlantic during the
456
Younger Dryas Chronozone. Paleoceanography 1995, 10, 943-952. https://doi.org/10.1029/95PA01426.
457
38. Jansen, E.; Andersson, C.; Moros, M.; Nisancioglu, K.H.; Nyland, B.F.; Telford, R.J. The Early to
458
Mid-Holocene Thermal Optimum in the North Atlantic. In Natural Climate Variability and Global
459
Warming: A Holocene Perspective; Battarbee, R.W., Binney, H.A., Eds. Wiley-Blackwell: Chichester, UK,
460
2008; pp. 123-137, ISBN 9781405159050.
461
39. Ravelo, A.C.; Hillaire-Marcel, C. The Use of Oxygen and Carbon Isotopes of Foraminifera in
462
Paleoceanography. In Developments in Marine Geology; Hillaire-Marcel, C., de Vernal, A., Eds.; Elsevier:
463
AE Amsterdam, Netherlands, 2007. Volume 1, Proxies in Late Cenozoic Paleoceanography, pp.
464
735-764. ISBN 978-0-444-52755-4.
465
40. Jonkers, L.; van Heuven, S.; Zahn, R.; Peeters, F.J.C. Seasonal patterns of shell flux, δ18O and δ13C of
466
small and large N. pachyderma (s) and G. bulloides in the subpolar North Atlantic. Paleoceanography
467
2013, 28, 164-174. DOI: 10.1002/palo.20018.
468
41. NGRIP members. High-resolution record of Northern Hemisphere climate extending into the last
469
interglacial period. Nature 2004, 431, 147-151. DOI:10.1038/nature02805.
470
42. EPICA community members. Eight glacial cycles from an Antarctic ice core. Nature 2004, 429, 623-628.
471
DOI:10.1038/nature02599.
472
43. Eynaud, F. Planktonic foraminifera in the Arctic: Potentials and issues regarding modern and
473
Quaternary populations. IOP C. Ser. Earth Env. 2011, 14, 1-12. DOI:10.1088/1755-1315/14/1/012005.
474
44. Pearce, C.; Seidenkrantz, M.-S.; Kuijpers, A.; Masser, Reynisson, N.F.; Kristiansen, S.M. Ocean lead at
475
the termination of the Younger Dryas cold spell. Nat. Commun. 2013, 4, 1664: 1-1664: 6.
476
DOI:10.1038/ncomms2686.
477
45. Ebbesen, H.; Hald, M. Unstable Younger Dryas climate in the northeast North Atlantic. Geology 2004,
478
32, 673-676. https://doi.org/10.1130/G20653.1.
479
46. Rickaby, R.E.M.; Elderfield, H. Evidence from the high-latitude North Atlantic for variations in
480
Antarctic Intermediate water flow during the last deglaciation. Geochem. Geophys. Geosyst. 2005, 6,
481
Q05001: 12. DOI:10.1029/2004GC000858.
47. Barker, S.; Diz, P.; Vautravers, M.J.; Pike, J.; Knorr, G.; Hall, I.R.; Broecker, W.S. Interhemispheric
483
Atlantic seesaw response during the last deglaciation. Nature 2009, 457, 1097-1102.
484
DOI:10.1038/nature07770.
485
48. Matul, A. Distribution of the polycystine radiolarian species in the Quaternary sediment cores of the
486
subarctic North Atlantic and Sea of Okhotsk. Data in Brief 2018, 17, 438-441.
487
https://doi.org/10.1016/j.dib.2018.01.041.