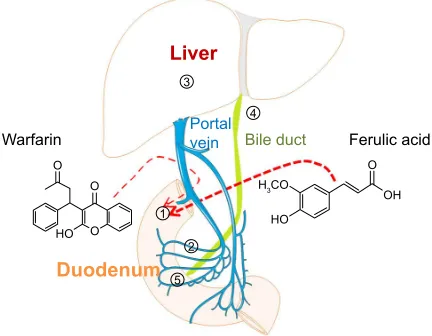
The effects of ferulic acid on the pharmacokinetics of warfarin in rats after biliary drainage
Full text
Figure
Related documents
In this study, we examined the effect of NDRG2 expression on cell viability in MDA-MB-231 human breast cancer cells under conditions that are similar to the microenvironment of
wideband (SWB) antenna comprising exponentially tapered feed region and patch printed monopole antenna was designed to cover a bandwidth of 2.5–80 GHz with overall dimensions of 40 ×
Until now, all dwarf galaxies that have been adequately searched for variable stars have yielded RR Lyrae stars, which confirms that these systems predominantly contain old,
Prevalence of partial edentulism in the upper jaw according to the Kennedy and Applegate classification in patients treated at the Dental Clinic of Universidad San Martín de
Figure 3.5 Number of septic tanks within a half-mile and a mile buffer or radius of each water quality monitoring station ...32.. Figure 3.6 Number of Enterococcus density
The Estimation of the Optimum Mesh Size Selectivity of a Drift Net for Yellow Croaker ( Larimichthys polyactis ) Using by the SELECT Model.. Gill Net
The other non-inflammatory musculoskeletal disease and respiratory disease controls were matched to the age of the case at the time of interview and were asked to think back to
An accurate, highly sensitive, precise, simple, efficient and reproducible, isocratic Reversed Phase High Performance Liquid Chromatography method was developed
