Abstract
KAHLER, SUSAN ELIZABETH. A Comparison of Knowledge Acquisition Methods for the Elicitation of Procedural Mental Models. (Under the direction of Sharolyn A. Converse-Lane.)
This study compared the effectiveness of two different knowledge acquisition methods in terms of their ability to measure the structure of a student’s procedural mental model of computer programming as it evolved in a classroom setting over the course of a semester. Ratings and backward thinking tasks were used to estimate the structure of students’ procedural mental models at several points throughout an introductory
programming course. For both methods, comparisons between the student’s procedural mental model and a prototype model (i.e., the instructor’s conceptual model of the
course of the semester. This hypothesis was not supported because the index of similarity never increased beyond the value obtained at test time one. The third hypothesis was that as the student completed each successive project, the coherence index would increase. This hypothesis was not supported, as no main effect of test time on the coherence index was found. The fourth hypothesis was that there would be a negative correlation between the project score and the number of steps out of sequence. The number of steps out of sequence was excluded from further analysis due to low inter-rater reliability. Therefore this hypothesis cannot be evaluated. Lastly, it was hypothesized that the index of
similarity would correlate more positively with student's performance than the number of steps out of sequence. Again, without the number of steps out of sequence, this
A COMPARISON OF KNOWLEDGE ACQUISITION METHODS FOR THE ELICITATION OF PROCEDURAL MENTAL MODELS
By
SUSAN ELIZABETH KAHLER
A dissertation submitted to the Graduate Faculty of North Carolina State University
in fulfillment of the requirements for the Doctorate of Philosophy
PSYCHOLOGY DEPARTMENT
Raleigh 2002
APPROVED BY:
______________________________ _______________________________
______________________________ _______________________________
ii
BIOGRAPHY
iii
Table of Contents
LIST OF TABLES... vi
LIST OF FIGURES ... viii
INTRODUCTION ...1
Learning: The Development of Mental models...1
Knowledge Acquisition ...2
Acquisition of Procedural Mental Models...8
Evaluations of Procedural Knowledge Acquisition Methods ...9
Overview of Study ... 14
Hypotheses ... 15
METHOD... 23
Participants ... 23
Cumulative Attrition Rate ... 24
Knowledge Acquisition Task... 25
Experimental Design ... 24
Apparatus ... 26
Materials... 27
Procedure ... 32
iv
Data Analysis ... 38
Results ... 40
Pathfinder Index of Similarity (Ratings Task) ... 40
Pathfinder Coherence Index (Ratings Task)... 41
Number of Steps Missing (Backward Thinking Task) ... 42
Backward thinking score (Backward Thinking Task)... 42
Project Score ... 43
Post-test Score... 44
Final Score... 46
Correlational Analysis ... 47
Subjective Ratings... 50
Discussion... 59
Evaluation of Hypotheses... 59
Evaluation of Backward Thinking ... 63
Effect of Task Order ... 64
Gender Effects ... 65
Subjective Ratings... 68
Summary... 81
Recommendations for Conducting Knowledge Acquisition Research... 72
v
REFERENCES ... 76
Appendix A: Demographics Questionnaire ... 82
Appendix B: Pre-Test... 85
Appendix C: Ease of Use Questionnaire ... 89
Appendix D: Consent Form... 92
Appendix E: Participant instructions... 95
vi
LIST OF TABLES
Table 1. Procedural Knowledge Acquisition Methods: A Review of Empirical Studies . 18
Table 2. Attrition Rate by Gender ... 24
Table 3. Attrition Rate Across Conditions Over the Course of the Study... 24
Table 4. Attrition Rate for Each Combination of KA Task and Task Order Over the Course of the Study... 25
Table 5. Programming Procedures for Ratings Task... 40
Table 6. Coherence Indices for the Prototype Model... 31
Table 7. Inter-rater Reliability ... 38
Table 8. ANOVA Results for Pathfinder Index of Similarity (Ratings Task) ... 41
Table 9. Means for Indices of Similarity: Gender x Task Order ... 41
Table 10. ANOVA Results for Pathfinder Coherence Indices (Ratings Task)... 42
Table 11. ANOVA Results for Number of Steps Missing (Backward Thinking Task)... 43
Table 12. ANOVA Results for Backward Thinking Score (Backward Thinking Task).. 44
Table 13. ANOVA Results for Project Score ... 45
Table 14. Means for Project Score: Gender x Task Order ... 46
Table 15. ANOVA Results for Post-test Score... 46
Table 16. ANOVA Results for Final Score... 47
Table 17. Pearson Correlation Coefficients for Project One... 48
Table 18. Pearson Correlation Coefficients for Project Two ... 49
vii
Table 20. ANOVA Results for Clarity of KA Task Instructions... 52 Table 21. ANOVA Results for Difficulty of the KA Task... 53 Table 22. Means for Difficulty of the KA Task: Gender x KA Task x Task Order ... 54 Table 23. ANOVA Results for Satisfaction with Time Spent Performing the KA Task . 54 Table 24. Means for Satisfaction with Time Spent Performing the KA Task: Gender x KA Task x Task Order... 55 Table 25. ANOVA Results for Helpfulness of the KA Task in Understanding the Course
Materials ... 57 Table 26. Means for Helpfulness of the KA Task in Understanding the Course Materials:
viii
LIST OF FIGURES
1
INTRODUCTION
Learning: The Development of Mental models
A mental model is the student’s cognitive representation of a task or system, and is developed through experience (Wilson and Rutherford, 1989). A mental model can allow humans to describe a system's purpose and form, explain system function and states, and predict future system states (Rouse and Morris, 1986). The development of a student’s mental model is influenced by the structure of the knowledge (i.e., conceptual model, Young, 1983) that is presented to the student during interaction with the learning environment.
Mental models contain multiple types of knowledge. In the literature, these types of knowledge have been referred to as declarative or conceptual (Anderson, 1983), procedural or task, and strategic (Converse and Kahler, 1992; Kraiger, Ford, and Salas, 1991; Shadbolt and Wielinga, 1990). Declarative knowledge contains information about concepts and their defining features, and the relationships among those features and concepts (Shadbolt and Wielinga, 1990). From a systems perspective, examples include information about a system’s components, functions, behaviors, states and layout (Kieras, 1988). Declarative knowledge has been characterized as being (1) a network of
interconnected concepts (Anderson, 1983; Norman and Rumelhart, 1975), (2) static (Gordon, 1992), and (3) easy to verbalize (Gordon, 1992).
2
performed (Shadbolt and Wielinga, 1990), including the order in which the actions should be performed (Modrick, 1991). Procedural knowledge is often represented in the form of IF-THEN production rules, with the IF side of the rule representing conditions of a situation and the THEN side of the rule representing the corresponding actions to be performed (Anderson, 1983).
Strategic knowledge is the combination of procedural and declarative knowledge that has become compiled, tacit, and automatic due to the continued rehearsal of routine activities (Converse and Kahler, 1992). Gordon (1992) summarizes the relationship between declarative and procedural knowledge as the direct association between the system conditions and system responses, which also encompasses the steps required to obtain a system response. Strategic knowledge is also the knowledge that enables experts to monitor and control problem solving (Shadbolt and Wielinga, 1990). In situations where information is incomplete or inappropriate, strategic knowledge guides the identification of alternative solutions to the problem (Shadbolt and Wielinga, 1990). However, strategic knowledge may be so well learned that it is automatic and not available for verbal report (Bainbridge, 1979; Anderson, 1985).
Knowledge Acquisition
3
environment. Knowledge acquisition methods can be incorporated into studies to elicit, structure, and represent a student’s mental model (Gammock and Young, 1985).
There are several knowledge acquisition methods from which to choose.
According to the differential access hypothesis, each method has a degree of suitability for the type of knowledge to be acquired (Cooke, 1994; Converse and Kahler, 1992;
Hoffman, 1992). In her knowledge acquisition taxonomy, Cooke (1994) incorporated a matrix of knowledge acquisition methods mapped to the type of knowledge to be elicited. For example, card sorting and scaling techniques were hypothesized to be methods
appropriate for eliciting the conceptual structure of a domain (i.e., declarative knowledge) while thinking aloud during task performance (i.e., verbal protocol) was hypothesized to be an appropriate method for eliciting procedural knowledge.
Cooke (1994) emphasized the need to conduct empirical studies that compare knowledge acquisition methods in terms of their ability to elicit a particular type of knowledge. As an example of such a study, Wilt (1998) examined the validity of verbal protocols and laddered grids (a form of structured interviewing which focuses on the relationship between concepts) in terms of their ability to capture declarative and procedural knowledge across several domains. Results were that laddered grids were more effective at eliciting declarative knowledge than verbal protocols. However, there was no difference between the two methods in terms of their ability to elicit procedural knowledge. Regretfully, this comparison study is a rarity in the domain.
4
acquisition is structural knowledge assessment (Goldsmith and Kraiger, 1997). During structural assessment, the participant is asked either to rate concepts according to their similarity or to sort the concepts into related groups. Scaling algorithms are used to calculate the spatial coordinates of concepts. The spatial coordinates are represented in graphical form to show the strength of the relationships between the concepts, with the degree of spatial proximity indicating the degree of positive or negative relationship between two concepts or features. Positive relationships are depicted with close spatial proximity. Scaling methods can be applied to group data as well as individual data, thus allowing comparisons at the group level (Cooke and McDonald, 1986). The advantage of using a scaling algorithm is that it has a high reliability; multiple researchers who use the same rating or distance measures and the same algorithm will produce nearly identical representations (Cooke and McDonald, 1986).
Structural knowledge assessment is commonly used to acquire declarative mental models (Converse and Kahler, 1992; Kahler, Converse, Lester, Cheatham, and Stelling, 2000) but has typically not been used to acquire procedural mental models. However, there is no empirical evidence to suggest that structural knowledge assessment cannot be used to acquire procedural mental models. In fact, researchers (Goldsmith and Kraiger, 1997; Acton, 1991) have identified the need to evaluate structural knowledge assessment in terms of its ability to represent procedural knowledge.
5
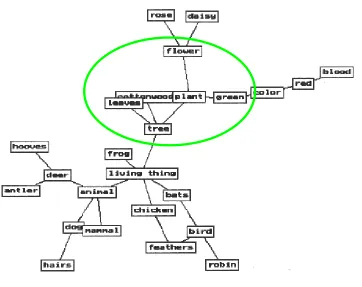
and their links. When the links are labeled, the Pathfinder networks can then be referred to as semantic nets (Cooke and McDonald, 1986). An example of a Pathfinder network is shown in Figure 1. Concepts that are closely related are located in close proximity to each other, either directly linked or superimposed together. For example, cottonwood, plant, and leaves are closely related because they overlap one another. Additionally, flower, green, and tree are also closely related because they are linked directly to plant. However, green is more closely related to plant than to either flower or tree because it has the shortest link of the three concepts connected to plant.
6
Pathfinder networks have been used to identify the differences in mental models between expert and novice computer programmers (Cooke and Schvaneveldt, 1986) and between expert and novice users of commands for specifying the formatting of a document (Kellogg and Breen, 1990). Cooke and Schvaneveldt (1986) found that the networks revealed critical associations between concepts understood by the expert programmers, and incorrect understandings of associations of concepts among naive programmers.
The Kellogg and Breen (1990) study used Pathfinder to evaluate the performance of participants who either had experience or did not have experience with document formatting commands. Participants were asked to sort the concept cards into piles of related concept cards. Each group’s network was compared to a prototype network, which represented the ideal conceptual model of the commands for specifying the layout of a document. To perform this comparison, Pathfinder generated an index of similarity. The index of similarity is the degree of agreement or correlation between group A’s classification of the relationships between relevant concepts and group B’s classification of those same concepts, or between and expert’s and novice’s classification of the concepts. By comparing the novice and the expert groups’ index of similarity to the ideal index of similarity, which was created by the system designer, Kellogg and Breen (1990) found that the expert users’ network more closely matched the prototype network than did the novices’ network.
7
Coherence Index measures the consistency of a set of similarity ratings (Goldsmith and Kraiger, 1997). Coherence provides information on the consistency of a student's mental model by reflecting how consistent the student was when assigning similarity ratings to pairs of concepts. The underlying assumption of coherence is based on the triangle inequality law. For example, if a student rates concepts A and B as highly related, and B and C as highly related, one would expect that the student would rate concepts A and C as highly related. This same logic can be applied to an entire set of concepts. Pathfinder measures coherence by correlating the student ratings to a set of expected ratings. The expected ratings for each pair of concepts (e.g., concepts A and B) are derived from the comparison of the linked concepts surrounding A and B. For example, Pathfinder would compare the linked concepts surrounding A and the linked concepts surrounding B to calculate an expected rating for concepts A and B. The higher the correlation between the student and expected ratings, the higher the coherence of the student's network.
Therefore, the coherence index is the degree of agreement or correlation between the student’s ratings and the expected ratings calculated by Pathfinder (automated by PCKNOT 4.3).
The coherence index has been used to investigate how students’ mental models developed over a period of two semesters in courses in introductory methods and
8
coherence index is a valid measure of mental models in a procedural domain such as computer programming.
Acquisition of Procedural Mental Models
There are three general categories of knowledge acquisition methods that have been used to acquire procedural mental models: structured interviews and questionnaires, verbal protocols, and observation (Converse and Kahler, 1992). During interviews and questionnaires, the participant is asked to respond to a series of questions about the steps required to perform a task. Verbal protocols are transcripts of the participant's
verbalization of his or her thoughts either during task performance (concurrent) or shortly after task performance (retrospective). During observation, the participant performs the task (without talking about the thought process either during or after task performance) in the presence of observers who record the participant's task steps. These non-statistical methods require subjective analysis of the data by the researcher and inter-rater reliability must be established (Converse and Kahler, 1992).
9
has been specified. Each step in the path is present only because it was derived from a higher level or more recent step. Andrus (1988) suggests that backward thinking makes for a more efficient method than forward thinking (e.g., verbal protocols), as the
opportunities for branching onto new paths are limited due to the constraints imposed by existing steps in the path.
Evaluations of Procedural Knowledge Acquisition Methods
Table 1 provides a summary of empirical studies that have investigated the predictive validity of procedural knowledge acquisition methods. Only one study used backward thinking (Andrus, 1988). The remaining studies had participants perform a ratings task, which in some cases, the ratings served as the input into the Pathfinder algorithm. The studies in Table 1 are discussed in further detail.
In Barker and van Schaik (1999), an unknown number of college students participated in KA tasks designed to elicit their mental models of a word processing software package. Each student completed all of the KA tasks in the order listed: rating, sorting, laddering, concept mapping, and teachback interviewing. Task performance was evaluated by having students complete basic word processing tasks, which were scored by a panel of judges. However, correlations were not calculated between all KA and
performance task measures. Therefore, no specific conclusions or recommendations can be drawn from this study regarding the predictive validity of KA methods.
10
selecting their choices via menu driven software. These menu selections were translated into action sequences, which were then input into the Pathfinder algorithm to generate the participant’s Pathfinder network. Over the course of the study, participants’ indices of similarity increased, when compared against a gold standard. However, in this study, the number of tasks and their difficulty were not reported.
The second study reported in Cooke, Neville, and Rowe (1996) was an analysis of the verbal protocols produced by thirty two Air Force technicians who were engaged in avionics troubleshooting. As in study one, troubleshooting steps were translated into action sequences which were then input into the Pathfinder algorithm to generate the participant’s Pathfinder network, which was then compared to a gold standard network. The main finding of the second study was that the correlation between the index of similarity and the score assigned to task performance was significant for one of the problems. However, the archival data analysis was incomplete, as participants completed a total of ten problems, but only two of those problems were examined during the analysis. As with study one, task difficulty was not reported.
11
Vortac, Edwards, and Manning (1994) had ten air traffic controllers simulate air traffic control situations using a high and a low complexity scenario, in that complexity was defined by the number of departures, arrivals, etc. Action sequences, as recorded by observers, were input into the Pathfinder algorithm to generate Pathfinder networks which were visually inspected to identify common links. The researchers concluded that the Pathfinder networks were similar across task difficulty. The Pathfinder index of similarity was not used to evaluate the similarity of the networks generated by participants for the low and high complexity tasks.
In the last study, Andrus (1988), six media selection experts worked through four media selection problems using one KA method per problem: backward thinking,
constrained processing (the participant is given a finite time in which to solve a task problem), verbal protocols, and behavioral event interviews (similar to critical incidents). The transcripts for each of the KA methods were analyzed to identify the number of media selection rules generated. It was reported that backward thinking generated two
additional rules that were not identified by the other KA methods.
12
is the general state of the domain, where experimental evaluations of knowledge acquisition methods are sparse (Shadbolt, O'Hara, and Crow, 1999). Additionally, the number of participants (N<20) used in four of the six studies was quite small. Shadbolt, O'Hara, and Crow (1999) suggest that a sample size of larger than twenty participants is needed to achieve statistical significance. One study (Barker and van Schaik, 1999) does not even report the number of participants; this does not allow the reader to determine the study's statistical power or to evaluate the generalizability of the study results.
In some studies using the Pathfinder scaling algorithm (Cooke, Neville, and Rowe, 1996; Rowe, Cooke, Hall, and Halgren, 1996; Vortac, Edwards, and Manning, 1994), the data input into the algorithm were behavioral rather than cognitive indices such as
similarity or distance values. Instead, action sequences generated during task performance were input into the scaling algorithm. Action sequence, when collected during task
13
may be detected more rapidly, and the relationship between model structure and
performance can be more fully explored. Therefore, more experimental studies need to be conducted that include both knowledge acquisition and performance measures.
In studies whereby KA methods were used instead of action sequences (Barker and van Schaik (1999); Rowe, Cooke, Hall, and Halgren (1996)) and whereby a separate task performance measure was generated, the KA tasks were completed prior to
completing the performance task. Johnson (1995) speculated that perhaps performing the KA task prior to the performance task provides some type of advantage in structuring the problem. This type of speculation points to the need to incorporate task order as an independent variable when conducting KA studies, in that comparisons should be made between participants who perform the KA task before and after the performance task.
14
knowledge acquisition domain. Of the studies cited in Table 1, only one study was conducted over multiple data collection sessions (Cooke, Neville, and Rowe, 1996) but the duration of that study was only three weeks. Although Shadbolt, O'Hara, and Crow, (1999) suggest methods for improving the experimental design of studies that evaluate knowledge acquisition methods, they omit any reference to the need for longitudinal studies. However, there is a need in the knowledge acquisition domain to conduct longitudinal studies to examine the structural changes in mental models over time so that the relative effectiveness of conducting such a study can be assessed and communicated to other researchers.
Overview of Study
This study compared the effectiveness of two different knowledge acquisition methods in terms of their ability to measure the structure of a student’s procedural mental model of the task of computer programming and to compare the changes in model
structure to potential changes in performance on a programming task. The measures of mental model structure were repeated over the course of a semester in which students were enrolled in a class that teaches this skill. Ratings and backward thinking tasks were used to measure students’ procedural mental models throughout the introductory
15
how closely the student’s mental model matched the prototype model at various points in the semester. Additionally, this study investigated the relationship between performance and knowledge acquisition measures at various points in the semester to establish the validity of the two knowledge acquisition methods employed in this study for identifying and capturing procedural knowledge.
Hypotheses
H1: When a student’s project score is high, the index of similarity (generated from the ratings task) will be high as well, thus implying more similarity with the instructor's conceptual model of the course. This hypothesis will be supported if the correlation between the project score and the index of similarity is significantly higher for students who performed well on the project than for students who performed poorly on the project. This hypothesis was adopted because researchers have found that the similarity between students' and experts' mental models can serve as a predictor of course performance (Goldsmith and Kraiger, 1997, Acton, 1991). Additionally, this appears to be the case for procedural domains, such as computer programming, as well as declarative domains (Acton, 1991).
16
for Project 1. Due to the cross-sectional nature of studies that have evaluated procedural knowledge acquisition methods, this hypothesis has not been investigated. A longitudinal study provides the opportunity to do so. Action (1991) found that a related metric, the index of coherence, did increase over the course of his longitudinal study.
H3: As the student completes each successive project, the coherence index (generated from the ratings task) will increase, thus implying a more internally consistent mental model. This hypothesis will be supported if the coherence index for project 3 is significantly higher than the coherence index for project 2, which is significantly higher than the coherence index for project 1. Acton (1991) found that students’ index of coherence did increase over the period of two semesters. Again, this finding held for procedural as well as declarative domains.
H4: When a student’s project score is high, the number of steps out of sequence (generated from the backward thinking task) will be low, thus implying more congruence with the instructor's conceptual model of the course. This hypothesis will be supported if the negative correlation between the project score and the number of steps out of
sequence is significantly higher for students who performed well on the project than for students who performed poorly on the project. There are no studies on backward thinking to support or refute this hypothesis. However, if the backward thinking measure has predictive validity, this relationship should be found.
17
18 Table 1
cedural Knowledge Acquisition Methods: A Review of Empirical Studies
Authors KA Methods
Evaluated
Methodology Results and Conclusions Critique
Barker and van Schaik (1999) --rating --sorting --laddering --concept mapping --teachback interviews
--Number of S's not reported --S's completed tasks related to knowledge acquisition, then S's completed a performance task --DV's included:
1. ratings of task performance
2. number of concepts used during task
performance
--Correlation between task performance and the number of concepts used during task performance was significant
--Not all of the results for the different knowledge acquisition methods were reported
--No baseline measures of S's pre-existing knowledge --No gold standard for comparison
19 Table 1 Cont.
Authors KA Methods
Evaluated
Methodology Results and Conclusions Critique
Study 1: Cooke, Neville, and Rowe (1996)
--action sequences --4 S's over 3 weekly 4 hour sessions
-- S's interacted with a NASA mission control simulation to identify and diagnose faults -- S's chose the faults and their corrective actions from a pre-defined menu of choices -- DV's included:
1. the Pathfinder Index of Similarity
2. % correct fault identification 3. % correct fault
diagnosis 4. % correct actions
taken
-- Over sessions, S's index of similarity increased and more closely approximated the ideal network (gold standard) --The more closely S's procedural networks approximated the ideal network, the better the performance as the index of similarity correlated
significantly with the fault identification, diagnosis and corrective action DV's
--Small sample
20 Table 1 Cont.
Authors KA Methods
Evaluated
Methodology Results and Conclusions Critique
Study 2: Cooke, Neville, and Rowe (1996)
--action sequences --archival data of verbal protocols for pre/post test design
--32 Air Force technicians in the Avionics troubleshooting domain
--1 pretest and 1 post-test problem out of 10 problems available for analysis
--DV's included:
1. the Pathfinder Index of Similarity
2. score assigned to task performance
--Networks of high and low performers have distinct characteristics
--Correlation between the index of similarity and the worksheet score was
significant for pretest problem
21 Table 1 Cont.
Authors KA Methods
Evaluated
Methodology Results and Conclusions Critique
Rowe, Cooke, Hall, and Halgren (1996)
--laddering interview --concept relatedness ratings
--diagramming --think aloud and verbal troubleshooting
--19 Air Force technicians in F-15 avionics troubleshooting --Technicians went through all of the KA methods --DV's included:
1. For laddering, the ratio of shared to different items was calculated
2. Ratings were submitted to Pathfinder and the index of similarity was calculated 3.For diagramming, the proportion of shared connections between two models was calculated 4. For think aloud, the transition probabilities on the action sequences were calculated
5. Experts scored task performance on 1 problem
--think aloud not predictive of performance (dissociation between task performance and protocol)
--ratings and laddering were predictive of performance
22 Table 1 Cont.
Authors KA Methods
Evaluated
Methodology Results and Conclusions Critique
Vortac, Edwards, and Manning (1994)
--action sequences --10 air traffic controllers in an air traffic control
environment using problems with 2 levels of task difficulty --DV's included:
1.Pathfinder networks aggregated across S's
--Pathfinder networks were similar across task difficulty
--Small sample
--the Pathfinder Index of Similarity was not used to compare the 2 networks representing the 2 levels of task difficulty
--Task difficulty did not vary over a continuum Andrus (1988) --backward thinking
--constrained processing
--protocol analysis --behavioral event interview
--6 media selection experts --DV's included:
1. number of rules generated
--Backward thinking
generated an additional two rules
23
METHOD
Participants
Sixty-nine students who were enrolled in an introductory computer programming class at North Carolina State University initially participated in the study. Several students dropped out of the study because they dropped out of the course. Other students simply did not show up and therefore there was no communication as to why they dropped out of the study. By the end of the semester, only forty-four students (twenty-seven males, seventeen females) had completed all of the knowledge acquisition tasks; forty-two
students had completed all of the experimental tasks including the post-test and the ease of use questionnaire.
For their participation in the study, students received two points extra credit which was applied to their course average for the semester. For example, if a student had an average of 89 in the class, the additional two points increased the average to 91. As an option, students could have completed an additional project for the same two points of extra credit if they chose not to participate in the study. Two students completed all but the post-test; they received one point extra credit.
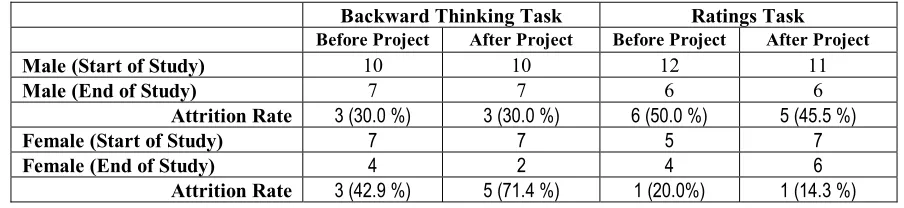
24 Table 2
Attrition Rate by Gender
Backward Thinking Task Ratings Task
Before Project After Project Before Project After Project
Male (Start of Study) 10 10 12 11
Male (End of Study) 7 7 6 6
Attrition Rate 3 (30.0 %) 3 (30.0 %) 6 (50.0 %) 5 (45.5 %)
Female (Start of Study) 7 7 5 7
Female (End of Study) 4 2 4 6
Attrition Rate 3 (42.9 %) 5 (71.4 %) 1 (20.0%) 1 (14.3 %)
Table 3
Attrition Rate Across Conditions Over the Course of the Study
Tasks in the Study Number of Participants Cumulative Attrition Rate
Complete Pre-test 69
Complete KA session 1 51 18 (26.1 %)
Complete KA session 2 46 23 (33.3 %)
Complete KA session 3 44 25 (36.2 %)
Complete Post-test 42 27 (39.1 %)
Experimental Design
25
delay between the lecture and the project due date. Therefore, students were asked to perform the knowledge acquisition task either before or after the project due date. Subjects were randomly assigned to combinations of knowledge acquisition task and task order. The within-subjects variable was testing time (project one, project two, project three).
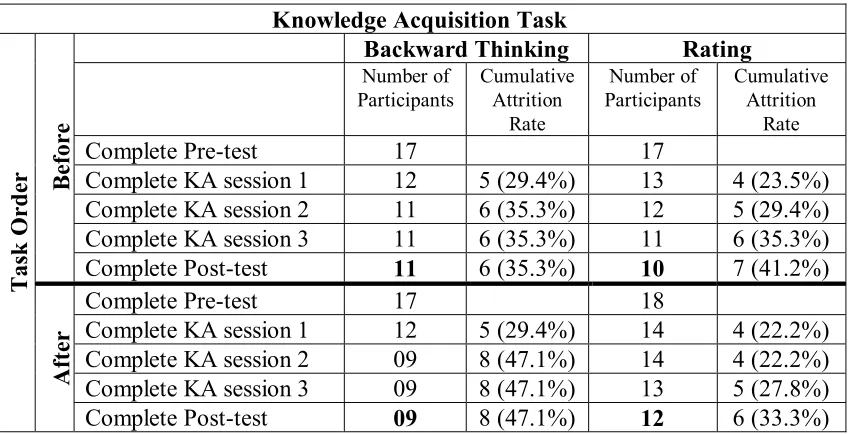
Table 4
Attrition Rate for Each Combination of KA Task and Task Order Over the Course of the Study
Knowledge Acquisition Task
Backward Thinking Rating
Number of Participants Cumulative Attrition Rate Number of Participants Cumulative Attrition Rate
Complete Pre-test 17 17
Complete KA session 1 12 5 (29.4%) 13 4 (23.5%) Complete KA session 2 11 6 (35.3%) 12 5 (29.4%) Complete KA session 3 11 6 (35.3%) 11 6 (35.3%)
Bef
ore
Complete Post-test 11 6 (35.3%) 10 7 (41.2%)
Complete Pre-test 17 18
Complete KA session 1 12 5 (29.4%) 14 4 (22.2%) Complete KA session 2 09 8 (47.1%) 14 4 (22.2%) Complete KA session 3 09 8 (47.1%) 13 5 (27.8%)
Tas k O rd er Af ter
Complete Post-test 09 8 (47.1%) 12 6 (33.3%)
26
variables unique to the ratings task were the Pathfinder Index of Similarity (henceforth referred to as the index of similarity) and the Pathfinder Coherence Index (henceforth referred to as the coherence index). The dependent variables unique to the backward thinking task were the number of steps out of sequence, the number of steps missing, and the backward thinking score.
Apparatus
Data collection room for tasks requiring a computer. The ratings and backward thinking tasks were performed on a computer workstation, which had Windows 98 installed as the operating system. Three individual workstations were set-up in a small room (approximately 10’ x 12’), as shown in Figure 2. Each workstation contained a computer, with processor speeds of 100, 200, or 300 Mhz. The processor speed did not make a visible difference as to how either the operating system or any of the software applications performed. The monitors were 17” on the diagonal and were set to a 1028 X 768 screen resolution. A two-button mouse was attached to the computer workstation to serve as the input device. The participant worked individually at a workstation that contained a chair and table for the computer workstation.
27
Figure 2. Data Collection Room for Tasks Requiring a Computer Materials
Participants’ computer programming experience was assessed in a paper and pencil demographics questionnaire. The demographics questionnaire is shown in Appendix A. In addition, participants were asked to provide their gender, college, department, and college level on the demographics questionnaire.
28
This test was also administered via paper and pencil. The exams from a previous year's introductory C ++ programming class were used to develop the pre-test, which was done in conjunction with the course instructor. The exams were designed to be taken in a three-hour test period. However, for this study, a pre-test, which could be taken in an three-hour or less, was created. Therefore, the questions on the pre-test were a randomly selected subset of the exam questions. The pre-test is shown in Appendix B. The pre-test and the post-test were identical in content. The order of the pre-test questions was randomized during the creation of the post-test.
Projects. There were three computer programming projects assigned by the course instructor during the semester. The first project was the video store project, which asked students to create a program that would calculate the cost of video rentals based on a discount scheme. The second project was the stock traders project, which asked
students to create a program to plot stock price highs and lows. The third project was the poker project, which asked students to create a program for playing blackjack.
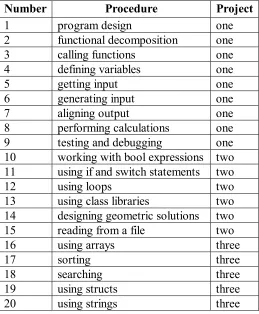
Ratings task. Materials for the ratings task were created by asking the course instructor to identify the programming procedures and the relationships amongst those procedures that he expected students to understand in order for a student to successfully complete a project. The programming procedures are shown in Table 5. For project one, students rated the relatedness of concepts one through nine. For project two, students rated the relatedness of concepts one-fifteen. For project three, students rated the relatedness of all twenty concepts.
29
response scale was a five-point Likert scale using anchors of slightly related and highly related. A separate button was provided for the student to indicate that two concepts were not related. The pairwise comparisons were performed using an online ratings tool (Single Relatedness Software, Version 1.0) developed by Dr. Nancy Cooke in conjunction with Sandia Research Corporation. A training instrument was created using four procedures (taking a quiz, taking an exam, preparing a report, and making a presentation) to familiarize the student with the online ratings tool. The software on which the ratings task was performed in shown in Figure 3.
An optimal or prototype Pathfinder network was created using the instructor’s ratings to represent the optimal rating of relationships between the procedures. This prototype network was used in the data analysis only and was not presented to participants. Upon inspection of the
coherence indices derived from the prototype network for each of the three projects, the values of the indices were too low for projects one and three to be considered stable, as shown in Table 6. Goldsmith (2001), who participated in the development of the coherence index, sets a .400 criterion level for the coherence index when the prototype model is generated from experts. Therefore, the course instructor was asked to re-rate the concepts for projects one and three to improve the consistency of the prototype model. The values of the coherence indices from the first and second rating sessions are shown in Table 6. The values input into the data analysis for projects one and three were the values generated during the second rating session, while the value used in the project two data analysis was from the first rating session.
30
you would go through to complete the project, starting with the most recent step first and working backwards to the initial step?”. Two training backward thinking tasks were created to familiarize the student with the backward thinking task. The first task asked the student to describe a path to the data collection room, and the second task was to describe the procedure of picking up a package from the post office.
Table 5
Programming Procedures for Ratings Task
Number Procedure Project
1 program design one
2 functional decomposition one
3 calling functions one
4 defining variables one
5 getting input one
6 generating input one
7 aligning output one
8 performing calculations one
9 testing and debugging one
10 working with bool expressions two 11 using if and switch statements two
12 using loops two
13 using class libraries two 14 designing geometric solutions two
15 reading from a file two
16 using arrays three
17 sorting three
18 searching three
19 using structs three
31 Figure 3. Online Ratings Task
Table 6
Coherence Indices for the Prototype Model
Project First Rating Session
Second Rating Session
1 .145 .558
2 .478 N/A
32
Materials for an optimal or prototype model for the backward thinking task were created by asking the course instructor to identify the sequence of steps (from latest to earliest) necessary to complete each of the three course projects. These prototype models were used in the data analysis only and were not presented to participants.
Subjective measures. Participants’ opinions on the ease of use of the knowledge acquisition task were assessed in a paper and pencil evaluation questionnaire. The ease of use questionnaire is shown in Appendix C. The ease of use questionnaire has five
questions, with each response using a five-point Likert rating scale. The questionnaire covers five aspects of the knowledge acquisition task: clarity of the task instructions, ease of task performance, time spent during task performance, contribution of the task to understanding the course material, and integration of the task with the course. Procedure
During the first week of the course (two class periods), the researcher introduced the study. Participants completed a written consent form prior to participating in the study. This consent form can be found in Appendix D. The consent form and
demographics questionnaire were attached to the course syllabus; students could return both at the end of the first class period or they had the option of returning them at the beginning of the next class period. The consent form assured them of their anonymity and confidentiality in this study.
33
times. Participants were given one hour to take the pre-test.
Participants were tested in groups of three to complete the KA tasks. Each
participant worked at an individual workstation. Each testing session lasted approximately 30-45 minutes. The instructions read by the researchers are shown in Appendix E. The instructions guided the participants through the sequence of tasks they completed during all of the sessions.
For each of the three projects, participants completed either the ratings or backwards thinking task. At each of the three testing times throughout the semester, measures were collected for the project score for all participants. In addition, the index of similarity and the coherence index were calculated at each of the three testing times for those participants who performed the ratings task, while the number of steps out of sequence, the number of steps missing, and a backward thinking score were calculated at each of the three testing times for those participants who performed the backward thinking task. At each of the three testing sessions, students were given training to practice the knowledge acquisition task prior to completing the knowledge acquisition task for the programming project. Half completed the knowledge acquisition task before the
programming project; the other half completed the knowledge acquisition task after the programming project had been completed, but prior to receiving the graded project results. Students were given a five-minute break for every half hour spent performing the knowledge acquisition task. The length of time between the testing sessions was
34 September, October, and November.
Prior to the week of final exams, participants completed the post-test. Participants were asked to complete the post-test in the conference room during scheduled hours. Participants were given one hour to take the post-test. Upon completion of the post-test, participants completed the ease of use questionnaire to provide their opinions on the ease of use of the knowledge acquisition task. At the conclusion of the session, participants were given the opportunity to ask any questions they may have had about the study and were added to the list of students who were eligible for receiving extra credit for their participation in the study.
Preparation for Data Analysis
Pre- and post- tests. Participants’ responses from the pre and post- tests were
graded by the two course graders, who used a grading key provided by the course
instructor. The researcher is not an subject matter expert in C++ computer programming, hence two course graders were requested to perform the grading tasks. Each grader scored every test.
Number of steps missing. The number of steps missing was converted to a
percentage, as the number of steps for projects one and three was ten, while the number of steps for project two was eight.
35 that can be purchased from Interlink, Inc.
The coherence index provides an indication of whether or not the student is evaluating the pairs of concepts using a consistent criteria for the comparison. The Pathfinder Algorithm calculates the coherence index by comparing indirect and direct measures for each pair of concepts. The direct measure for each pair of concepts is the actual rating entered in by the student. The indirect measure for each pair of concepts is the rating that the Pathfinder Algorithm predicts or expects for the pair of concepts based on how those concepts were rated against other concepts. To generate the coherence index, the indirect and direct measures are correlated with each other. The coherence index can range from zero to one. The higher the correlation, the more consistent the direct measure is with the indirect (or expected) measure, which implies that the student is consistent with the evaluation of the pairs of concepts.
The Pathfinder Algorithm can generate an index of the similarity between two networks. In this study, the two networks used for comparison were the participant’s network and the
prototype network, which was derived from the instructor’s ratings of the concepts. Similarity of the networks is determined by the number of links that are common between the two networks, divided by the number of total links in the two networks minus the number of common links. For example, if network A has 25 links, network B has 26 links, and there are 14 links in common, the network similarity is calculated as 14/ (25+26-14) = .378. This is the proportion of the links in either network that are in both networks. If the networks are identical, similarity will equal one, if the networks have no links in common, then similarity will equal zero.
36
while a low rating implies that the concepts are less related. The similarity ratings are automatically converted into a distance matrix by PC-KNOT. Distance is the relationship between the rating and its minimum and maximum values. It is calculated as X’ = min + max –X, where X is the rating. Ratings that are slightly related are not close while ratings that are more closely related are closer. The distances of the concepts are symmetrical, as the distance between concepts i and j is no different than the distance between j and i, for all pairs of (i,j). Hence the links in the network have the same interpretation regardless of the direction in which they are read (i.e., reading from i to j is the same as reading from j to i).
Networks are created from the spatial coordinates, with nodes representing the concepts and the links among the nodes representing the type of relationships that exist between concepts. Links are assigned weights based on the strength of the relationship, as indicated by the entries in the distance matrix.
37
created with specific values of parameters r and q is referred to as a Pfnet (r,q). Knowledge acquisition measures for the backward thinking task. For each participant, a backward thinking score was calculated using a standardized protocol scoring key developed in conjunction with the course instructor. The backward thinking protocol scoring keys and guidelines are shown in Appendix F. The researcher and course instructor piloted the backward thinking protocol scoring key by using it themselves and making comparisons to each other’s findings. The output of this comparison was the revision of the backward thinking protocol scoring sheets with the addition of guidelines prior to their use by the course graders. The additional guidelines are shown in the project scoring keys that are shown in Appendix F. The backward thinking protocol scoring key lists the items the protocol must contain and the order in which those items should be mentioned, with each item having a point value. The evaluation of the pre-test, post-test, and backward thinking protocols used two course graders, who were recommended by the course instructor because of their exceptional prior grading experience in the introductory C++ computer programming class.
38
out of sequence project 2” and “number of steps out of sequence project 3”. For those two projects, graders varied mainly in their determination of when the participant
performed the step of testing the program in the process. When to test a program was a critical step in the project, and performing the testing in the incorrect sequence resulted in the loss of seven to eight points, depending on the project. Due to the low inter-rater reliability, the number of steps out of sequence was excluded from further data analysis. Table 7 Inter-rater Reliability pre -t es t bw t s core proj ec t1 st ep s out of se que nc e proj ec t 1 st ep s m issi ng in proj ec t 1 bw t s core proj ec t 2 st ep s out of se que nc e proj ec t 2 st ep s m issi ng in proj ec t 2 bw t s core proj ec t 3 st ep s out of se que nc e proj ec t 3 st ep s m issi ng in proj ec t 3 po st-tes t Corr coef
.96 .99 .77 .98 .97 .41 .96 .99 .53 .99 .97
# in cell 44 20 20 20 20 20 20 20 20 20 41
Data Analysis
mixed-39
model MANCOVA using pre-test score as the covariate.
Ratings data. The means for the index of similarity and the coherence index were first calculated for each combination of gender, testing time, and task order, and were then submitted to a mixed-model MANCOVA using pre-test score as the covariate.
Project scores. For all students, the means for the project score were calculated for each combination of gender, KA task, task order, and testing time, then submitted to a mixed-model ANCOVA using pre-test score as the covariate.
40
RESULTS
Unless otherwise stated, all ANOVA results are reported with an alpha level of .05. Post hoc comparisons of significant results were conducted using Tukey’s
Studentized Range Test.
Pathfinder Index of Similarity (Ratings Task)
A significant main effect was found for test time for the index of similarity, as shown in Table 8. The means for test times one through three for the index of similarity were .287, .191, and .254 respectively. The index of similarity was significantly lower at test time two than at test times one or three. There were no significant differences between the indices of similarity when comparing test time one and test time three. However, it is interesting to see the trend that the index of similarity is at its highest at test time one.
41 Table 8
ANOVA Results for Pathfinder Index of Similarity (Ratings Task)
Source DF ANOVA SS F Value P
Gender 1 .0009 .15 .6979
Task Order 1 .0016 .27 .6068
Test Time 2 .1077 8.96 .0004*
Task Order x
Test Time 2 .0073 .61 .5454
Gender x Task
Order 1 .0372 6.19 .0157*
Gender x Test
Time 2 .0088 .73 .4850
Gender x Task Order x Test
Time 2 .0279 2.33 .1063
Table 9
Means for Indices of Similarity: Gender x Task Order
Before Project After Project
Male .222 .259
Female .276 .219
Pathfinder Coherence Index (Ratings Task)
42 index, as shown in Table 10.
Number of Steps Missing (Backward Thinking Task)
A significant main effect was found for gender for the number of steps missing, as shown in Table 11. The means for males and females for the number of steps missing were 62.512 and 45.999 respectively. Females had a significantly lower percentage of steps missing than did males. No other significant main effects or interaction effects were found for the number of steps missing.
Table 10
ANOVA Results for Pathfinder Coherence Index (Ratings Task)
Source DF ANOVA SS F Value P
Gender 1 .0389 .68 .4122
Task Order 1 .0952 1.67 .2018
Test Time 2 .0150 .13 .8766
Task Order x
Test Time 2 .0003 .00 .9969
Gender x Task
Order 1 .0003 .01 .9413
Gender x Test
Time 2 .0190 .17 .8472
Gender x Task Order x Test
Time 2 .2152 1.88 .1612
Backward thinking score (Backward Thinking Task)
43
shown in Table 12. The means for males and females for the backward thinking score were 44.484 and 61.375 respectively. Females had a significantly higher backward thinking score than did males. No other significant main effects or interaction effects were found.
Table 11
ANOVA Results for Number of Steps Missing (Backward Thinking Task)
Source DF ANOVA SS F Value P
Gender 1 2856.1091 4.06 .0497*
Task Order 1 29.1871 .04 .8395
Test Time 2 1292.4312 .92 .4062
Task Order x
Test Time 2 606.2243 .43 .6525
Gender x Task
Order 1 632.7405 .90 .3478
Gender x Test
Time 2 1672.6036 1.19 .3136
Gender x Task Order x Test
Time 2 560.5346 .40 .6737
Project Score
44
differences between the project scores when comparing test time one and three, or when comparing test time two and three. It is interesting to note the trend that the project score decreased over test time.
A significant interaction effect was found for Gender x Task Order for project score as shown in Table 13. The means for Gender x Task Order for project score are shown in Table 14. The post hoc test confirmed that males who completed the KA task after the project had significantly higher project scores than females who completed the KA task after the project.
Table 12
ANOVA Results for Backward Thinking Score (Backward Thinking Task)
Source DF ANOVA SS F Value P
Gender 1 2988.2385 5.46 .0238*
Task Order 1 146.8406 .27 .6070
Test Time 2 1357.6203 1.24 .2987
Task Order x
Test Time 2 260.0917 .24 .7895
Gender x Task
Order 1 849.9194 1.55 .2189
Gender x Test
Time 2 2097.0203 1.92 .1586
Gender x Task Order x Test
Time 2 462.5447 .42 .6579
Post-test Score
45
Table 15. The means for males and females for the project score were 24.341 and 26. 059, respectively. Females had a significantly higher post-test score than did males. No other significant main effects or interaction effects were found for post-test score.
Table 13
ANOVA Results for Project Score
Source DF ANOVA SS F Value P
Gender 1 531.9677 2.00 .1607
KA Task 1 49.4018 .19 .6677
Task Order 1 32.4627 .12 .7278
Test Time 2 2518.6703 4.72 .0108*
Gender x KA Task 1 14.4028 .05 .8167
Gender x Task
Order 1 1124.2266 4.22 .0425*
KA Task x Task
Order 1 3.1099 .01 .9142
Gender x KA Task
x Task Order 1 104.9420 .39 .5318
Gender x Test Time 2 494.0708 .93 .3991
KA Task x Test
Time 2 175.3702 .33 .7205
Task Order x Test
Time 2 71.7081 .13 .8743
KA Task x Task
Order x Test Time 2 774.1080 1.45 .2388
Gender x Task
Order x Test Time 2 621.9123 1.17 .3155
Gender x KA Task
x Test Time 2 207.7766 .39 .6783
Gender x KA Task x Task Order x Test
46 Table 14
Means for Project Score: Gender x Task Order
Before Project After Project
Male 87.161 92.574
Female 89.248 81.629
Table 15
ANOVA Results for Post-test Score
Source DF ANOVA SS F Value P
Gender 1 77.1417 3.97 .0488*
KA Task 1 15.6302 .80 .3719
Task Order 1 36.7366 1.89 .1720
Gender x KA
Task 1 3.8793 .20 .6560
Gender x Task
Order 1 45.1041 2.32 .1306
KA Task x Task
Order 1 34.7013 1.78 .1843
Gender x KA Task x Task
Order 1 .1814 .01 .9232
Final Score
47 Table 16
ANOVA Results for Final Score
Source DF ANOVA SS F Value P
Gender 1 61.2650 .82 .3677
KA Task 1 4.7796 .06 .8010
Task Order 1 212.3180 2.83 .0950
Gender x KA
Task 1 18.9442 .25 .6160
Gender x Task
Order 1 34.4698 .46 .4989
KA Task x Task
Order 1 177.9814 2.38 .1260
Gender x KA Task x Task
Order 1 40.4239 .54 .4641
Correlational Analysis
For each project, a correlational analysis was performed to examine the
48
task). All significant correlations are positive and above .500.
Table 17
Pearson Correlation Coefficients for Project One
Project 1
Score Index of Similarity (Ratings Task) Coherence Index (Ratings Task) Backward thinking score (Backward Thinking Task) Steps Missing (Backward Thinking Task)
Project 1 Score 1.000 Index of Similarity (Ratings Task) 0.396 0.055 1.000 Coherence Index (Ratings Task) -0.042 0.844 0.076 0.725 1.000 Backward thinking score (Backward Thinking Task) -.058 0.807 Not applicable Not applicable 1.000 Steps Missing (Backward Thinking Task) -0.137 0.565 Not applicable Not applicable -0.756 0.0001* 1.000
Note. Within each table cell, the correlation coefficient is reported as the top number and the P value is reported as the bottom number. A cell entry of “Not Applicable” means that a correlation between the two dependent measures was not possible as participants
49 Table 18
Pearson Correlation Coefficients for Project Two
Project 2
Score Index of Similarity (Ratings Task) Coherence Index (Ratings Task) Backward thinking score (Backward Thinking Task) Steps Missing (Backward Thinking Task) Project 2 Score 1.000 Index of Similarity (Ratings Task) -0.131 0.541 1.000 Coherence Index (Ratings Task) 0.239 0.261 -0.206 0.335 1.000 Backward thinking score (Backward Thinking Task) -0.152 0.949 Not applicable Not applicable 1.000 Steps Missing (Backward Thinking Task) 0.136 0.566 Not applicable Not applicable -0.915 <0.0001* 1.000
Note. Within each table cell, the correlation coefficient is reported as the top number and the P value is reported as the bottom number. A cell entry of “Not Applicable” means that a correlation between the two dependent measures was not possible as participants
50 Table 19
Pearson Correlation Coefficients for Project Three
Project 3
Score Index of Similarity (Ratings Task) Coherence Index (Ratings Task) Backward thinking score (Backward Thinking Task) Steps Missing (Backward Thinking Task)
Project 3 Score 1.000 Index of Similarity (Ratings Task) 0.501 0.013* 1.000 Coherence Index (Ratings Task) -0.344 0.100 -0.057 0.792 1.000 Backward thinking score (Backward Thinking Task) 0.201 0.396 Not applicable Not applicable 1.000 Steps Missing (Backward Thinking Task) -0.159 0.503 Not applicable Not applicable -0.863 <.0001* 1.000
Note. Within each table cell, the correlation coefficient is reported as the top number and the P value is reported as the bottom number. A cell entry of “Not Applicable” means that a correlation between the two dependent measures was not possible as participants
performed either the ratings or the backward thinking task, but not both. Subjective Ratings
51
for how participants perceived the clarity of KA task instructions (ease of use question one), as shown in Table 20. A higher mean value means that the participant rated the instructions as being less clearly stated. The means for clarity of KA task instructions for the backward thinking and ratings group were 1.019 and 1.345respectively. Participants
who performed the ratings task rated the instructions as significantly less clearly stated than participants who performed the backward thinking task. No other significant main effects or interaction effects were found for clarity of KA task instructions.
Difficulty of the KA task. A significant main effect was found for KA task for how participants perceived the difficulty of the KA task (ease of use question two), as shown in Table 21. A higher mean value means that the participant rated the task as being more difficult to perform. The means for difficulty of the KA task for the backward thinking and ratings group were 1.777 and 2.684,respectively. Participants who performed the ratings
task rated the KA task as significantly more difficult to perform than participants who performed the backward thinking task.
52
project. There were no significant differences when comparing males and females who completed the backward thinking task after the project. The post-hoc test also confirmed that the ratings task was significantly more difficult to perform than the backward thinking task, with the only exception being the comparison of females who performed either the ratings task or the backward thinking task after the project; no significant differences were found between those two groups.
Table 20
ANOVA Results for Clarity of KA Task Instructions
Source DF ANOVA SS F Value P
Gender 1 .4631 2.91 .0906
KA Task 1 2.7085 17.03 <.0001*
Task Order 1 .0096 .06 .8064
Gender x KA
Task 1 .3063 1.93 .1678
Gender x Task
Order 1 .1317 .83 .3648
KA Task x Task
Order 1 .0133 .08 .7725
Gender x KA Task x Task
Order 1 .1295 .81 .3687
53
prior to completing the project. However, females who performed the ratings task prior to completing the project rated it as being significantly more difficult to perform than females who performed the ratings task after the project. No significant differences were found when comparing females who performed the backward thinking task before or after the project.
Table 21
ANOVA Results for Difficulty of the KA Task
Source DF ANOVA SS F Value P
Gender 1 .2021 .29 .5900
KA Task 1 20.9454 30.26 <.0001*
Task Order 1 .0099 .01 .9052
Gender x KA
Task 1 .7287 1.05 .3070
Gender x Task
Order 1 20.9073 30.21 <.0001*
KA Task x Task
Order 1 .0243 .04 .8517
Gender x KA Task x Task
Order 1 2.7890 4.03 .0471*
Satisfaction with time spent performing KA task. A significant main effect was found for KA task for participant’s satisfaction with time spent performing KA task (ease of use question three), as shown in Table 23. A higher mean value means that the
54
time spent for performing the KA task for the backward thinking and ratings group were 1.457 and 1.720,respectively. Participants who performed the ratings task were
significantly more dissatisfied with the amount of time spent performing the task than participants who performed the backward thinking task.
Table 22
Means for Difficulty of the KA Task: Gender x KA Task x Task Order
Backward Thinking
Ratings
Before After Before After
Male 1.359 1.935 2.082 3.369 Female 2.205 1.607 3.236 2.049
A significant interaction effect was found for Gender x KA Task x Task Order for satisfaction with time spent performing the KA task as shown in Table 23.
Table 23
ANOVA Results for Satisfaction with Time Spent Performing the KA Task
Source DF ANOVA SS F Value P
Gender 1 .7376 1.68 .1970
KA Task 1 1.7527 4.00 .0478*
Task Order 1 .5167 1.18 .2796
Gender x KA
Task 1 .0813 .19 .6673
Gender x Task
Order 1 1.4503 3.31 .0714
KA Task x Task
Order 1 .0236 .05 .8168
Gender x KA Task x Task
55
The means for Gender x KA Task x Task Order for ease of use question three are shown in Table 24.
Table 24
Means for Satisfaction with Time Spent Performing the KA Task: Gender x KA Task x Task Order
Backward Thinking
Ratings
Before After Before After
Male 1.544 1.259 1.366 1.848 Female 1.481 1.543 2.244 1.420
The post-hoc test confirmed that females who performed the ratings task prior to completing the project and males who performed the ratings task after completing the project were significantly less satisfied with the time spent performing the KA task than participants in all other conditions. There was no significant difference between the
females who performed the ratings task prior to completing the project and the males who completed the ratings task after the project. The post-hoc test also confirmed that males who performed the ratings task after the project were significantly less satisfied with the time spent performing the KA task than males who performed the backward thinking task after completing the project. Yet, females who performed the ratings task prior to
56
after the project were significantly less satisfied with the time spent performing the KA task than males who performed the ratings task prior to completing the project. However, females who performed the ratings task prior to the project were significantly less satisfied with the time spent performing the KA task than females who performed the ratings task after the project. There were no significant differences with the satisfaction of the time spent performing the KA task, when comparing males and females who performed the backward thinking task, either before or after the project.
Helpfulness of the KA task in understanding course material. A significant main effect was found for gender for helpfulness of the KA task in understanding the course material (ease of use question four), as shown in Table 25. A higher mean value means that the participant rated the helpfulness of the KA task in understanding the course
material as less helpful. The means for males and females for helpfulness of the KA task in understanding the course material were 2.655and 2.398respectively. Males rated the helpfulness of the knowledge acquisition task as significantly less helpful in learning the course materials than did females.
57
who completed the KA task prior to completing the project. Table 25
ANOVA Results for Helpfulness of the KA Task in Understanding the Course Material
Source DF ANOVA SS F Value P
Gender 1 1.7262 4.94 .0283*
KA Task 1 .0269 .08 .7821
Task Order 1 .0264 .08 .7841
Gender x KA
Task 1 .0086 .02 .8758
Gender x Task
Order 1 2.6328 7.53 .0071*
KA Task x Task
Order 1 1.1071 3.17 .0779
Gender x KA Task x Task
Order 1 .6154 1.76 .1873
Table 26
Means for Helpfulness of the KA Task in Understanding the Course Material: Gender x Task Order
Before Project After Project
Male 2.833 2.477
Female 2.252 2.544