Conditions. (Under the direction of Dr. Douglas J. Gillan)
A cognitive map is a mental representation of an external environment which aids in spatial navigation and performance in large-scale spaces. Multidimensional scaling is a statistical technique which represents a set of input proximities as a map-like set of points configured spatially while Pathfinder is a statistical technique which represents a set of input proximities as a network of weighted relationships between pairs of items. The current study examined the ability of both MDS and Pathfinder to measure and represent cognitive maps. 79 participants took part in an experiment in which they learned the layout of a fictitious environment from either a map or a text-based narrative and were subsequently asked to both create a sketch map, which required placing landmarks spatially, and estimate the distance between pairs of landmarks from memory. Results indicated that distances between landmarks in MDS solutions were more highly correlated with sketch map distances than were Pathfinder networks. Additionally, both MDS and Pathfinder more accurately represented sketch maps from the map learning condition than the narrative learning
by
Caleb Samuel Furlough
A thesis submitted to the Graduate Faculty of North Carolina State University
in partial fulfillment of the requirements for the degree of
Master of Science
Psychology
Raleigh, North Carolina 2015
APPROVED BY:
_______________________________ _______________________________ Dr. Anne McLaughlin Dr. Christopher Mayhorn
_______________________________ Dr. Douglas Gillan
DEDICATION
To my wife, Faith, for always believing in me, motivating me, and enduring the long days and nights alongside me.
BIOGRAPHY
ACKNOWLEDGMENTS This research was funded in part by User-View Inc.
I would like to thank Dr. Janey Barnes, Glenn Barnes, and User-View Inc. for both financial and directional support throughout.
TABLE OF CONTENTS
LIST OF TABLES ... vii
LIST OF FIGURES ... viii
Introduction & Background ...1
Spatial Knowledge & Cognitive Mapping ...1
Measuring Cognition ...3
Relationship between Acquisition & Testing Conditions ...6
Competing Measures of Spatial Cognition ...8
Measurement Implications & Research Questions ...10
Spatial Orientation, Sense of Direction, & Spatial Representation Accuracy ...12
Spatial Navigation Strategies ...13
Spatial Learning & Spatial Abilities – Secondary Research Questions ...14
Methods...15
Research Design and Variable Description ...15
Participants ...15
Materials ...16
Instruments & Consent ...16
Demographic & Verification Questionnaires ...16
Spatial Environments ...16
Distance Estimation ...20
Map Sketch ...20
Perspective Taking and Spatial Orientation Test ...21
Santa Barbara Sense-of-Direction Scale ...21
Questionnaire on Spatial Representation ...22
Procedure ...22
Results ...23
Deriving Pairwise Distance Data ...23
Predicting Sketch Map Pairwise Distances...26
Discussion ...32
Implications for Measuring Spatial Knowledge ...32
Spatial Representation ...33
Spatial Abilities and Map Error ...34
Limitations & Future Research ...35
References ...37
Appendices ...42
Appendix A. Verification Questions...43
Appendix B. Examples of Distances Estimate Matrix Tasks ...45
Appendix C. KU Mapper Map Sketch Task ...46
Appendix D. Perspective Taking and Spatial Orientation Test ...47
Appendix E. Santa Barbara Sense-of-Direction Scale ...48
Appendix F. Spatial Representation Questionnaire ...49
LIST OF TABLES
LIST OF FIGURES
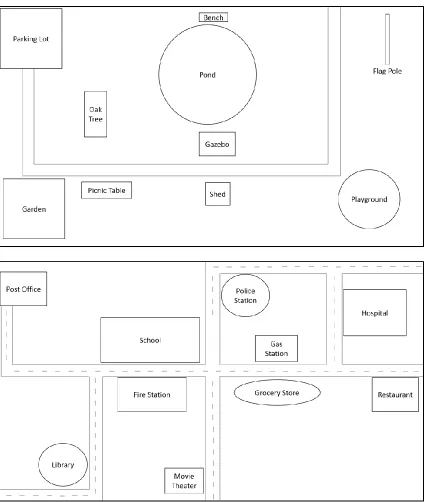
Figure 1. Environment maps ...17
Introduction & Background Spatial Knowledge & Cognitive Mapping
Traveling from one place to another is a central part of human day-to-day activity. Such travel requires the use of numerous cognitive abilities including orientation, navigation, distance estimation, and memory of spatial layouts. Even with a fully functioning motor control system, the simple task of traveling from one location to another would become exceedingly difficult without such spatial cognitive abilities. This holds true not merely for extreme conditions such as being lost in the jungle but also for more common, everyday experiences such as driving to work. Among these critical cognitive capacities is that of acquiring, storing and accessing spatial knowledge.
property of one being a mental construct, is that cognitive maps are mental images while physical maps are pictorial. Mental images have high plasticity but are typically only perceived in a single way as opposed to pictures which are more fixed but contain many perceptual possibilities (Kosslyn, 1977).
Representations of spatial knowledge can be distinguished from other kinds of representations in memory. Differences have been shown in verbal and spatial codes in memory and attention (e.g. Paivio, 1986; Henderson, 1972; Smith, Jonides, & Koeppe, 1996; Wickens & Liu, 1988). The distinction between the different codes in memory is important when studying spatial knowledge because specific issues and concerns for spatial
representations may not be raised concerning a verbal, or semantic, code. For example, verbal stimuli place more demand on the verbal resource in memory as opposed to spatial stimuli which place more demand on spatial resources in memory (Salthouse 1974; Salthouse 1975). Additionally, spatial reasoning can involve mental image or object spatial
manipulation which would not occur in verbal reasoning (Shepherd & Metzler, 1971). There is also evidence for analogs between use of visual mental representation and physical images (e.g. Kosslyn, 1976; Kosslyn, Ball, & Reiser, 1978). With separate codes come separate cognitive processes. Therefore, when examining the execution of a spatial task such as navigation it is necessary to focus on the code that is most relevant to that task.
is fundamental to both basic scientific and applied purposes. However, in order to understand how people use cognitive maps, those maps need to be measured and represented in some meaningful way. Developing measurements of cognitive maps is crucial in the pursuit of a deeper understanding of spatial knowledge acquisition and structure and the applications of that understanding for real-world navigational strategies, navigational devices, maps, and spatial layouts (including virtual environments).
Measuring Cognition
Measurement is critical to any science. However, measurement of representations in memory is especially challenging (Anderson 1978). At a foundational level, cognitive constructs are not directly observed but rather are inferred from a measure based on overt behavior such as response time or accuracy of a response. Thus, evaluating whether a cognitive measurement tool is valid – that it measures what it is intended to measure –. We can only view mental constructs through the lens of a behavioral measurement instrument or method. This holds true for spatial cognitive constructs such as cognitive maps as well. One might attempt to measure a cognitive map through collecting map drawings, estimates of distances, verbal directions, or by observing navigational strategies. These methods are all simply ways of trying to measure a construct that is not directly observable. Thus, the forefront of the discussion turns to the pursuit of the tool or method which best captures spatial knowledge.
2010; Kruskal & Wish, 1978; Togerson, 1952; Schvaneveldt, Durso, & Dearholt, 1989;
Montello, 1991). One such statistical tool is that of Multidimensional Scaling (MDS). MDS is a multivariate technique which takes proximities between pairs of objects as inputs and as an output produces a map-like set of points that are configured geometrically (Kruskal & Wish, 1978; Torgerson, 1952). For the purposes of this paper, MDS will be assumed to be non-metric, as opposed to metric. Metric MDS solutions attempt to produce a model replicating Euclidean pair distances as much as accurately as possible. Non-metric algorithms, on the other hand, may sacrifice some Euclidean accuracy in an attempt to preserve ordinal positioning (Kruskal & Wish, 1978; Torgerson, 1952).
A second multivariate method for measuring and representing psychological structures is Pathfinder networks (PFnets) (Schvaneveldt et al., 1989). Similar to MDS, the Pathfinder algorithm takes proximities between pairs of objects as inputs. Pathfinder, unlike MDS, ignores spatial positioning and global Euclidean distances, focusing on representing the relationships between pairs of objects in a network representation. PFnets contain three key features: nodes, links, and link weights. Nodes are input objects or points to which proximities are relative. A link is a weighted path between two nodes. The weight of a link represents the strength of the relationship between the two nodes. In the case of
there is a direct link between node A and node B. If the cumulative weight between nodes A, C and B, in that respective order, is stronger (or closer, in the case of distance) than the link between nodes A and B alone, then the direct link between A and B would be eliminated as it is weaker (or longer) than an alternative path. Thus, when PFnets are generated the only links shown are those which are the strongest by this process of elimination. Pathfinder operates under two constraints (r and q parameters) which can alter how links are eliminated and networks are constructed. The description given here of how Pathfinder networks are derived assumes the most common parameter settings r = ∞, q = n-1, which creates the most minimal Pathfinder network. All Pathfinder networks created and discussed in the current study operate under these parameters. More detail on these parameters can be found in Schvaneveldt et al., 1989.
There are also several methods specific to measuring cognitive maps and spatial knowledge. One such method is a sketch map. A sketch map is a map that is drawn, typically using pen and paper, of the layout of an environment from memory. Sketch maps have been shown to be reliable in measuring cognitive maps (Blades, 1990; Lohmann, 2011; Howard, Chase, & Rothman, 1973; Gillan, 1994; Billinghurst & Weghorst, 1995; Montello, 1991). Additionally, the validity of sketch maps has been supported through demonstrations of their ability to predict spatial performance and spatial abilities such as subjective ratings of
distance ratings based solely on the judgment of the individual as to the distances between pairs of objects. Distance estimates are also suggested to be a reliable method of measuring cognitive maps and spatial knowledge in individuals (Montello, 1991). A complete set of pairwise distance estimates used an inputs can yield both a MDS solution and a Pathfinder network.
Due to our inability to directly access spatial constructs there is a necessity for a testable standard to which measurement methods can be compared. For the purposes of this study the map sketch task will be considered the benchmark measurement of cognitive maps due to its allocentric representation, inclusion of both directional and distance information, validity, and reliability (Blades, 1990; Lohmann, 2011; Howard, Chase, & Rothman, 1973; Gillan, 1994; Billinghurst & Weghorst, 1995; Montello, 1991; Coluccia et al., 2006; Rovine & Weisman, 1989). In testing the efficacy of measurement methods all methods will be compared directly to the benchmark standard of map sketches.
Relationship between Acquisition & Testing Conditions
Both the conditions under which knowledge is acquired and the relation between acquisition and testing conditions are important factors that influence psychological
environment. Research on spatial knowledge should not be based on the assumption that acquisition conditions are the same across all people, unless that has been controlled or manipulated as a part of the experimental design.
Our previous research examined the relation of three measurement techniques (MDS, Pathfinder, distance estimates) to drawn sketch maps (Furlough & Gillan, 2015). In that study participants both estimated the distances between and drew map sketches from memory of the location of buildings on a college campus. Using the distance estimates as inputs, MDS solutions and Pathfinder networks were generated. MDS, Pathfinder, and distance estimates were then related to the distances between buildings in the map sketches by directly comparing point-to-point distances. Results from this study suggested that the MDS solution was more strongly related to the sketch map distances than were the other methods.
However, a limitation of this study was the lack of control over how participants acquired spatial knowledge of the campus. So, although results supported MDS as a method for measuring cognitive maps, possible effects of acquisition condition on measurement of spatial knowledge still needs to be examined.
environment. Participants who learned about an environment from a map were able to more accurately judge distance between two points than those who learned from direct navigation, although with additional experience the navigation group reached the same performance level. Taylor & Tversky (1992) had participants learn about an environment from reading a description or looking at a map. They found that participants performed equally well on spatial judgment tasks across all conditions. Their results were interpreted to suggest that people manage to form similar spatial mental models from different learning conditions. The conditions under which spatial knowledge is acquired is therefore relevant to both
measurement and spatial task performance. Competing Measures of Spatial Cognition
Pathfinder and MDS have been widely used in previous research to represent semantic knowledge structures (e.g. Gillan, Breedin, & Cooke, 1994; Schvaneveldt, Durso, & Dearholt, 1989; Paulsen et al., 1996; Steven-Adams, Goldsmith & Butler, 2012; Louwerse & Benesh, 2012). In addition, research that has compared MDS and Pathfinder suggests that Pathfinder networks are more closely related to performance on semantic memory tasks than are MDS or the original similarity ratings used to derive the MDS and Pathfinder
certain types of memory organization than MDS. More specifically, Cooke’s 1992 study concluded that the Pathfinder network provided better prediction of judgment times for categorical and dimensional memory tasks than either the MDS solution or the original relatedness ratings. Cooke argues that the advantage for Pathfinder was because its algorithm gives more weight to data at the highly related end of the scale, whereas MDS has to take into account pairwise relatedness ratings and attempts to fit them into a global representation which may distort pairwise relationships in favor of a more accurate global representation.
code as semantic memory. It is important to notice any lack of parallel between both codes and formats. This is an especially crucial point when discussing measurements of cognitive maps due to being imaginal spatial representations.
Measurement Implications & Research Questions
The previous sections have been dedicated to defining spatial knowledge, examining measurement methods, exploring measurement issues, and laying an initial foundation for the current research project. As emphasized previously it is currently unclear what effect
The present research compares the effects of knowledge acquisition condition on the ability of MDS, Pathfinder, and distance estimates alone to predict sketch maps. The two acquisition conditions examined in this study are a birds-eye-view map and a descriptive text. If, as has been discussed throughout this paper, there are effects of acquisition condition on measurement veracity then there may be an expected outcome. Given the spatial and global nature of a birds-eye-view level map and the parallel qualities of MDS solutions it would seem reasonable that MDS would better measure knowledge acquired from that medium. A descriptive, second-person perspective text, though, might evoke more of a pairwise
understand between landmarks while also being more procedural and local by nature. This, in addition with the lack of an explicit global perspective, might result in Pathfinder producing more accurate measurements of spatial knowledge. This would be consistent with prior research which suggests cognitive maps and spatial knowledge are affected differently by certain types of acquisition conditions (Thorndyke & Hayes-Roth, 1982; Troberg & Gillian, 2007). In contrast, humans might consolidate spatial information gathered from a variety of formats into a cohesive knowledge base or cognitive map (Taylor & Tversky, 1992,
Pazzaglia et al., 2006), leading to no effect of acquisition condition on performance of tasks requiring spatial knowledge.
the potential effects of acquisition conditions on those measurements listed previously, the current study proposes an experiment to examine the following primary research questions regarding measurement of spatial knowledge and any effects of acquisition conditions on measurement efficacy:
1. Are the previous results that found that MDS is a better predictor of sketch maps than Pathfinder or distance estimates alone replicated and further supported?
2. Does the condition under which knowledge of a spatial layout is acquired, from either a map or a textual description, effect the ability of MDS, Pathfinder, or distance estimate ratings to accurately predict sketches of that spatial layout?
Spatial Orientation, Sense of Direction, & Spatial Representation Accuracy
Related to measures of cognitive mapping are measures that have been developed of spatial orientation and sense of direction. Spatial orientation “involves the comprehension of the arrangement of elements within a visual stimulus pattern, the aptitude to remain
unconfused by the changing orientations in which a spatial configuration may be presented, and the ability to determine spatial orientation with respect to one's body.” (McGee, 1979, p. 897) while sense of direction can be described as “. . . verbal expression of people’s
additional explanation for spatial representation accuracy could be provided in the form of spatial navigation strategy.
Spatial Navigation Strategies
Spatial navigation strategies are those mental operations performed which aid in guiding the individual in performing large-scale spatial way-finding tasks. Two primary spatial representations utilized during way-finding are survey and route strategies (Pazzaglia & De Beni, 2001). Survey representations are typically thought to be constructed from an allocentric, birds-eye-view perspective with an extrinsic frame of reference. Route
examining preference for either survey or landmark-centered spatial representations. Their results also found a spatial ability advantage for individuals with a survey preference for spatial representation. Additionally, they found that performance on a way-finding task was dependent not only on spatial representation strategy preference but also on learning
condition. Landmark-centered strategists outperformed survey strategists when spatial instructions were given via verbal description instead of a map. The results from both studies reveal two aspects of spatial navigation strategies that have implications for the current research. First, they show that spatial representation strategy is associated with spatial performance including performance on map drawing tasks. Secondly, they reveal the effect of learning condition on spatial performance and map drawing. These results further support a foundation for the current research.
Spatial Learning & Spatial Abilities – Secondary Research Questions
Prior sections have discussed previous research into how spatial knowledge
acquisition conditions, spatial orientation ability, sense of direction, and preference of spatial representation strategy relate to spatial judgments and cognitive map accuracy. The previous sections have laid a foundation for a set of secondary research questions which the current study addresses. The current research proposes the following research questions, secondary to those discussed prior, regarding the accuracy of cognitive maps:
2. Is there a relationship between spatial abilities/strategies and the accuracy of cognitive maps?
Methods Research Design and Variable Description
The experiment was a mixed-model 2x3 design. There were two training conditions: 1. Reading a short text narrative description of a spatial location and 2. Viewing a simple birds-eye-view map image of a spatial location. The training conditions were between-subjects. There were also three measurement methods: 1. MDS, 2. Pathfinder, and 3. Distance estimate ratings. Measurement methods were within-subjects. For each individual participant MDS solutions and PFnets were produced based on the input of distance estimate ratings entered by participants during the distance estimate half matrix task.
Participants
Seventy-nine participants took part in the study (male = 18, female = 61) between the ages of 18 and 71 (M = 38.5, SD = 14.3). Participants were local individuals who
volunteered to participate through a local business. Participants were informed of the basic nature of the experiment and also that they would be compensated fifty dollars for
Materials
Instruments & Consent
A simple consent form was distributed to participants with basic information about the study and experiments in general. A laptop with a Windows 8.1 operating system, screen size of fourteen inches, and screen resolution 1600x900 was used. A mouse and keyboard were used for all computer-based tasks.
Demographic & Verification Questionnaires
An online questionnaire was created using Qualtrics survey software for the
distribution of the demographic questionnaire and verification questions (Appendix A). The demographic questionnaire contained two questions concerning, respectively, participant gender and age. In addition to the demographic questionnaire there were also four sets of ten verification questions (two narratives, two maps), one for each training condition. These statements required true/false responses and serve as measures of learning of the narratives and map images. The questions were also non-locative, having to do with details of the narrative not related to spatial location (e.g. color or shape of a building). The non-locative nature of the questions avoid priming or relearning effects that might be caused by spatially related questions.
Spatial Environments
Table 1
Town and Park Environment Narratives
Town Narrative
A few miles outside of the state capitol lay a small town. You enter the town from the east and drive straight on Main Street noticing the local restaurant immediately on your left. The sign just outside of the restaurant indicates that the menu includes a variety of burgers and sandwiches. About 800 feet down the road you see a side road to the right and about 500 feet down that road, on the right hand side, you see a two story hospital. You continue on Main Street no more than 500 feet before encountering a grocery store on your left and a gas station on your right. The grocery store is plain with solid walls of red brick. The gas station only consists of two pumps and a small convenience store. Another 500 feet down the road you come to a four-way intersection. Down to the right, about 700 feet down that road, you make out a police station. A local police vehicle pulls in and parks. To the left, 1000 feet down the road, is a movie theater with a very crowded parking lot. You continue straight for another 600 feet coming to a fire station on your left and a large school on your right. The fire station is quiet with little activity. The school on the other hand was full of students walking about. In about 400 more feet you decide to turn left on a side road, just after passing the school. After 1100 feet of driving the road begins to turn to the right where a library sits at the corner. The door to the library has a small set of concrete stairs followed by two pillars at the top. You turn around and head back up in the direction you came from. When you reach the intersection you turn left back onto Main Street. 700 feet further the road turns right, leading to a dead end. At the end of the road, which stands about 600 feet away from you, you see a post office. You see a woman get out of her vehicle and enter the building holding a small box. You turn around and head back straight down Main Street through the town and exit the way you came.
Park Narrative
Table 1 Continued
before coming to a corner where the path turns left again. By the corner you see a large playground. The playground is filled with children playing in the sand and on the monkey bars. You take the left and walk realizing that a large pond sits in the middle of the field and can likely be seen from anywhere on the path. 1000 feet more of walking leads you to rather tall flag pole with the flag waving in the breeze. The path ends in another 400 feet and you decide to talk a walk towards the pond. After another 1000 feet of walking you find a standalone wooden bench sitting on the edge of the pond. You take a seat for a while before getting up, walking to the parking lot, and exiting the park.
Distance Estimation
A distance estimation task (Appendix B) was also administered through Qualtrics. The distance estimation task provided the participant with a half-matrix in which row and column labels are the set of landmarks from one of the locations. The participant rated the distance between each pair of landmarks based on knowledge gained from a prior learning task on a scale of 1 to 100 (1 being immediately adjacent and 100 being as separated as possible).
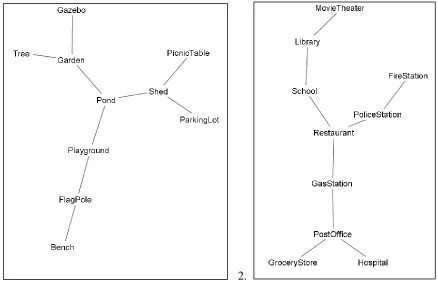
Map Sketch
KUmapper software (Appendix C) was used for the map sketch task. KUmapper software allowed for the participant to use a mouse to drag and place landmarks on a
Perspective Taking and Spatial Orientation Test
The Perspective Taking and Spatial Orientation Test (PTSOT) is a paper and pen test developed by Hegarty & Waller (2004) and was used to measure spatial orientation and perspective taking. Test items (Appendix D) consisted primarily of two sections. The top half of the page contains a picture with a set of items (e.g. cat, tree, car). The bottom half of the page contains instructions as well as a circle. The instructions for each item required the participants to imagine themselves in front of one of the objects in array and looking at another and subsequently pointing in the direction of a third object. The direction from the imagined perspective to the third object was drawn on the circle. There were twelve items total. Tests were scored for each participant by measuring the angular disparity between the drawn direction and the correct direction for each item. The total score for each test was the average angular disparity across all items with a higher score indicating more disparity (error).
Santa Barbara Sense-of-Direction Scale
reversed so that for all items a higher rating indicated more ability and vice versa. The total score is the average rating across all items (after reversals) so that a higher total score indicates more self-report sense-of-direction ability.
Questionnaire on Spatial Representation
In order to measure spatial strategy preference two items from the Questionnaire on Spatial Representation (QSR) (Pazzaglia, Cornoldi, & De Beni, 2000) were used (see Appendix F). Answers from each item fell into one of three spatial strategy categories: survey strategy, route strategy, landmark strategy. A survey representation is a global, birds-eye-view representation of the environment. A route-based representation is a representation focused on the connecting paths between landmarks. A landmark-based representation is one centered on prominent objects in the environment. Answers 3c and 4a were indicative of a survey-level mental representation strategy, answers 3a and 4b were indicative of a route-based mental representation strategy, and answers 3b and 4c were indicative of a landmark-based representation strategy. Individual scores for each strategy were summed across the two questions with a higher score indicating a higher preference for that representation strategy.
Procedure
After completing the consent form, a participant was seated in front of the computer and given one of the two learning conditions (map or narrative). The assignment of
environments (town, park) to conditions (map, narrative) were counterbalanced across
five minutes because they would be tested on it later. After five minutes, the experimenter removed the learning material and administered the set of ten verification questions. Next, the experimenter administered the distance estimate matrix task and map sketch task, with the order of the two tasks counterbalanced across participants. Participants were then given the demographic questionnaire. The PTSOT, SBSODS, and QSR were then administered, with the order of these materials randomized. When the PTSOT was administered
participants were asked to read the instructions and examine the example item. Participants were then asked if they had any final questions about the instructions before the test began. Participants were instructed to complete as many items as possible in five minutes, not spending too much time on any one item. The test session was five minutes in length after which time the experimenter removed the test. After spatial ability tests and questionnaires had been administered, the participants were debriefed and the experiment concluded.
Results Deriving Pairwise Distance Data
and the raw distance estimate ratings to predict cognitive maps each were compared to map sketch pairwise distances. This is to say, the drawn map served as the benchmark measure of a cognitive map. The distance estimate ratings were used as inputs for both MDS solutions and Pathfinder networks. Distances between points in MDS representations were calculated using the X and Y coordinates of each point and the distance formula d=√(x2 – x1)2 + (y2 –
y1)2. This was done for all pairs of points in each MDS representation so that pairwise
1. 2.
3. 4.
Pathfinder, in the same fashion as MDS, used the pairwise distance ratings as inputs. PFnet weights for all pairs of nodes were calculated using the Least Weight Sum (LWS) method. LWS requires that a path is assigned to any pair of nodes for which Pathfinder has not derived a direct link by finding the shortest possible multilink path for that pair. The LWS method assures that all pairs of nodes have corresponding links and weights whether these be derived from the direct links of the Pathfinder network or through a posteriori summing of links along a path.
After the above processes were performed there were pairwise distances measured from the map sketches, distance estimate ratings, pairwise distance ratings from PFnets, and MDS solutions. This resulted in four different sets of point-to-point distance data. In the same fashion as was performed in Furlough & Gillan (2015), three of the four point-to-point data sets (MDS, Pathfinder, and distance estimates) were correlated with the point-to-point distances in the drawn map (the fourth set).
Predicting Sketch Map Pairwise Distances
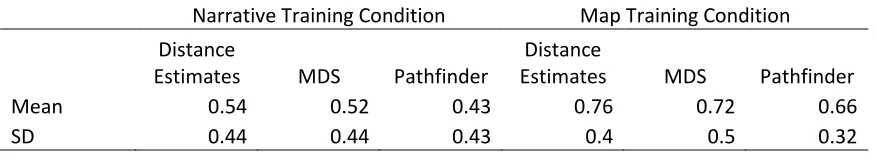
Table 2
Correlations between Measurement Methods and Map Sketch Pairwise Distances
Narrative Training Condition Map Training Condition
Distance
Estimates MDS Pathfinder
Distance
Estimates MDS Pathfinder
Mean 0.54 0.52 0.43 0.76 0.72 0.66
SD 0.44 0.44 0.43 0.4 0.5 0.32
As discussed in section 1.3 MDS solutions and Pathfinder networks were generated using distance estimate ratings as inputs.
For statistical analysis of measurement methods (distance estimates, MDS,
Pathfinder) non-parametric tests were used. Non-parametric statistics were used in order to avoid violating assumptions parametric tests such as levels of measurement. The ordinal relationships between distance judgments and representations of distance judgements could be preserved and taken into account by using non-parametric statistics.
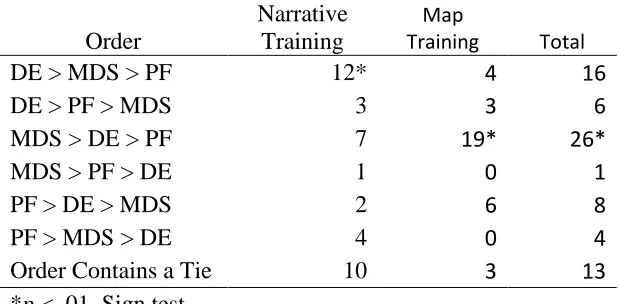
Table 3.
Frequency of Participants with Orders of Correlations as a Function of Training Condition.
Order
Narrative Training
Map
Training Total
DE > MDS > PF 12* 4 16
DE > PF > MDS 3 3 6
MDS > DE > PF 7 19* 26*
MDS > PF > DE 1 0 1
PF > DE > MDS 2 6 8
PF > MDS > DE 4 0 4
Order Contains a Tie 10 3 13
*p < .01, Sign test
participants showing that order, which was the only order that occurred significantly more often than expected by chance (given a chance probability of .167). In the Map training condition, the most frequent order (and the only order above chance was MDS highest correlation, Distance Estimates second highest, and Pathfinder third highest; 19 participants who acquired their spatial knowledge through reading a map had that order. That order (MDS > Distance estimates > Pathfinder) also occurred at a rate significantly above chance for the total across conditions.
One of the key questions that motivated this research was to determine whether MDS solutions or Pathfinder networks provided a better representation of spatial knowledge, as measured by the correlation of those two metrics with distances from the sketch maps.
Predicting Sketch Map Error
In order to assess performance on the map sketch task an error measure was
calculated. Error was calculated by taking the pairwise distances (in millimeters) for the map sketch landmarks and subtracting them from the actual map pairwise distances and taking the absolute value of the result for each participant. The error represents the degree to which the participant’s sketch map accurately reflects the actual map distances (i.e. accuracy). The mean error for all participants was 42.3 (SD = 15.3). A second measure of sketch map accuracy was the calculation of Pearson product-moment correlations between sketch map pairwise distances and actual map pairwise distances. Correlations for each participant were transformed using Fisher’s r to Z transformation calculation (Fisher, 1921) in order to achieve a more normal distribution. The mean correlation was .76 (SD = .57).
samples t-test). Thus the map training condition was found to produce sketch maps with less error relative to those produced from the narrative training condition.
Further analyses determined whether spatial abilities predict sketch map error across training conditions. The independent variables were the scores from the five spatial ability measures PTSOT, SBSODS, survey strategy preference, route strategy preference, and landmark strategy preference. The overall regression model showed that the set of spatial ability instruments in the narrative training condition did not relate to error, Model F(5,33) = 5.56, p = .08, R² =.25. However, results indicated that preference for a survey strategy did predict error (β = .43, p = .027) such that an increase in preference for survey strategy was associated with an increase in map sketch error for participants in the narrative training condition. Neither PTSOT (β = .1, p =.54) scores nor SBSOD scores (β = .02, p =.91) were significant predictors of map sketch error such that increases and decreases in spatial orientation score and sense of direction score did not relate to error. The overall regression model for the spatial ability predictors in the map training condition was not significant, F(5,31) = 1.07, p = .4, R² =.15. Results indicated that preference for a route-based strategy
Discussion Implications for Measuring Spatial Knowledge
The results of this study support the notion that MDS solutions better represent cognitive maps than do Pathfinder networks. The current study demonstrated these results across different training conditions including a narrative condition where pathfinder might have been expected to outperform MDS. Thus, the results of our previous research indicating this advantage of MDS over Pathfinder (Furlough & Gillan, 2015) were further replicated and strengthened. A possible explanation for the advantage of MDS over Pathfinder in this study could be one involving feature-sharing (Furlough & Gillan, 2015). Features of MDS include an emphasis on spatial relations and global fit. Contrast this with the features
of the narrative structure, emphasizing relationships among pairs of landmarks, aligning with the pairwise nature of distance estimates.
The results also indicate that measurements and representations of cognitive maps were more accurate for those who learned from a map as opposed to a narrative text. This answers one of the primary research questions posed by the current study, supporting the notion that different learning conditions can affect measurement and representation of cognitive maps. A possible explanation for these results lay in the noise created from different learning conditions. It may be the case that learning from a map leads to quicker development of an accurate cognitive map in comparison to a narrative text. Assuming this, it is reasonable to think that cognitive maps constructed from narrative texts contain more noise than those constructed from maps. This may have been made more exaggerated in that each learning condition was trained for the same allotted period of time and not to a set criterion. This noise could have led to more random inconsistency between distance estimate ratings and map sketches, making those sketches drawn from the narrative text more difficult to accurately measure and represent than those from the map condition.
Spatial Representation
Beyond implications for merely measurement efficacy are the inferences that can be drawn about underlying spatial representations. Given the advantage of MDS across both a global pictorial condition and a verbal written description condition some suggestions can be made about the nature of underlying spatial representations. The nature of basic
Pomerantz, 1977; Pylyshyn, 1973). The issue of fundamental representations of spatial knowledge is certainly not solved by the results of this study. This being said, the advantage of a global, spatial measurement tool across multiple types of learning conditions is more consistent with a view of basic spatial representations that is more imaginal than
propositional. A more powerful inference, though, is to suggest that despite whatever underlying basic presentation exists spatial knowledge is stored, at least at some level, as an imaginal representation. This representation could be considered to be at the functional level of representation, the representation that is utilized when performing certain spatial tasks. Under this definition the functional representation could simply be the basic representation itself or it could be a construction developed through the transformation of a more basic representation (e.g. the transformation of a series of propositional representations to an integrated imaginal, map-like representation). The nature of basic representations is not directly addressed by this study but these suggestions posited about the nature of functional representations of spatial knowledge are supported by the results of the present study.
Spatial Abilities and Map Error
spatial relations, does not. Thus a verbal source would seem to require additional transformation which is not required for a pictorial source.
Results also indicated a conditional advantage of different spatial strategies. Route-based strategies were associated with lower error for participants in the narrative training condition and survey-based strategies were associated with lower error for participants in the map training condition. This is consistent with previous research on spatial strategies which suggest survey-based strategies aid more in survey-based tasks, such as accessing a cognitive map during a spatial task, than non-survey-based strategies (Pazzaglia & De Beni, 2001; Meneghetti et al., 2011). Given that written descriptions which describe spatial relations in a pairwise manner would seem less likely to elicit a survey-based representation than a map-like picture with an explicit survey perspective, these results are not altogether surprising. Although a cause-effect relationship was not established in the current study between spatial strategy and cognitive map accuracy our results suggest that how an individual approaches a spatial acquisition source is a factor in the accuracy of the cognitive map developed.
Limitations & Future Research
Given the complex and variable means by which people can acquire spatial
REFERENCES
Anderson, J.R., (1978). Arguments concerning representations for mental imagery. Psychological Review, 85(5), 249-277.
Anderson, R.C., & Pichert, J. W., (1978). Recall of previously unrecallable information following a shift in perspective. Journal of Verbal Learning and Verbal Behavior, 17(1), l-12.
Black, J. B., Turner, T. J., & Bower, G. H. (1979). Point of view in narrative comprehension, memory, and production. Journal of Verbal Learning and Verbal Behavior, 18(2), 187-198
Blades, M. (1990). The reliability of data collected from sketch maps. Journal of Environmental Psychology, 10(4), 327-339.
Billinghurst, M., & Weghorst, S. (1995). The use of sketch maps to measure cognitive maps of virtual environments. Proceedings of the Virtual Reality Annual International Symposium, 40-47.
Coluccia, E., Bosco, A., & Brandimonte, M. A. (2007). The role of visuo-spatial working memory in map learning: New findings from a map drawing paradigm. Psychological research, 71(3), 359-372.
Coluccia, E., Iosue, G., & Brandimonte, M. A. (2007). The relationship between map drawing and spatial orientation abilities: A study of gender differences. Journal of Environmental Psychology, 27(2), 135-144.
Cooke, N. (1992). Predicting judgment time from measures of psychological proximity. Journal of Experimental Psychology: Learning, Memory, and Cognition, 18(3), 640-653.
Cooke, N., Durso, F., & Schvanevedlt, R. (1986). Recall and measures of memory organization. Journal of Experimental Psychology: Learning, Memory, and Cognition, 12(4), 538-549.
Downs, R. M., & Stea, D. (1973). Image and environment: Cognitive mapping and spatial behavior. Chicago: Aldine Pub.
Foos, P.W. (1980). Constructing cognitive maps from sentences. Journal of Experimental Psychology: Human Learning and Memory. 6(1), 25-38.
Franklin, N., Tversky B., & Coon V. (1992). Switching points of view in spatial mental models. Memory & Cognition. 20(5), 507-518.
Furlough, C.S., Gillan, D., (2015). Measuring maps with maps: Evaluating the veracity of pathfinder and multidimensional scaling in measuring cognitive maps. Manuscript in preparation.
Gillan, D. J., Breedin, S., & Cooke, N. (1994). Network and multidimensional
representations of the declarative knowledge of human-computer interface design experts. International Journal of Man-Machine Studies, 36(4), 587-615.
Gillan, D. J. (1994), Cognitive psychophysics and mental models. Proceedings of the Human Factors and Ergonomics Society 38th Annual Meeting, 38(4) 256-260.
Goldsmith, T., Johnson, P., & Acton, W. (1994) Assessing structural knowledge. Journal of Educational Psychology, 83(1), 88-96.
Hegarty, M., & Waller, D. (2004). A dissociation between mental rotation and perspective-taking spatial abilities. Intelligence, 32(2), 175-191.
Henderson, Leslie (1972) Spatial and verbal codes and the capacity of STM. Quarterly Journal of Experimental Psychology, 24(4), 485-495.
Howard, R. B., Chase, S. D., & Rothman, M. (1973). An analysis of four measures of cognitive maps. Environmental design research, 1, 254-264.
Kosslyn, S., & Pomerantz, J. R. (1977) Imagery, propositions, and the form of internal representations. Cognitive Psychology, 9(1), 52-76.
Kosslyn, S. M., Ball, T. M., & Reiser, B. J. (1978). Visual images preserve metric spatial information: evidence from studies of image scanning. Journal of experimental psychology: Human Perception and Performance, 4(1), 47.
Kozhevnikov, M., & Hegarty, M. (2001). A dissociation between object manipulation spatial ability and spatial orientation ability. Memory & Cognition, 29(5), 745-756.
Kruskal, J. B., & Wish, M. (1978). Multidimensional scaling. Beverly Hills, Calif.: Sage Publications.
Lohmann, K. (2011). The use of sketch maps as a basis for measures of spatial knowledge. Proceedings of the Workshop “An Interdisciplinary Approach to Understanding Processing Sketch Maps” at the 2011 Conference on Spatial Information Theory.
Louwerse, M.M. & Benesh, N. (2012). Representing spatial structure through maps and language: Lord of the Rings encodes the spatial structure of middle earth. Cognitive Science. 36(8), 1556-1569.
McGee, M. G. (1979). Human spatial abilities: psychometric studies and environmental, genetic, hormonal, and neurological influences. Psychological bulletin, 86(5), 889. Meneghetti, C., Pazzaglia, F., & De Beni, R. (2011). Spatial mental representations derived
from survey and route descriptions: When individuals prefer extrinsic frame of reference. Learning and Individual Differences, 21(2), 150-157.
Montello, D. (1991). The measurement of cognitive distance: Methods and construct validity. Journal of Environmental Psychology, 11(2), 101-122.
Paivio, A. (1986). Mental Representations: A Dual Coding Approach. NY: Oxford University Press.
Paulsen, J., Romero, R., Chan, A., Davis, A., Heaton, R., Jeste, D., (1996). Impairment of the semantic network in schizophrenia. Psychiatry Research. 63(2), 109-121.
Pazzaglia, F., Cornoldi, C., & De Beni, R. (2000). Differenze individuali nella
rappresentazione dello spazio: presentazione di un questionario autovalutativo [Individual differences in representation of space: presentation of a
questionnaire]. Giornale italiano di psicologia, 27(3), 627-650.
Pazzaglia, F., & De Beni, R. (2001). Strategies of processing spatial information in survey and landmark-centred individuals. European Journal of Cognitive Psychology, 13(4), 493-508.
Pazzaglia, F., Taylor, H., Varotto, D., (2006). Spatial mental models derived from the integration of information from different perspectives. Cognitive Processes. 7(1), 79-80.
Salthouse, T., (1974). Using selective interference to investigate spatial memory representations. Memory & Cognition. 2(4), 749-757.
Salthouse, T., (1975). Simultaneous processing of verbal and spatial information. Memory & Cognition. 3(2), 221-225.
Schvaneveldt, R. W., Durso, F. T., & Dearholt, D. W. (1989). Network structures in proximity data. Psychology of learning and motivation, 24, 249-284.
Shepard, R and Metzler. J., (1971). Mental rotation of three dimensional objects. Science, 171(972), 701-703.
Siegel, A. W., & White, S. H. (1975). The development of spatial representations of large-scale environments. Advances in child development and behavior, 10(9).
Smith, E. E., Jonides, J., & Koeppe, R. A. (1996). Dissociating verbal and spatial working memory using PET. Cerebral Cortex, 6(1), 11-20.
Steven-Adams, S.M., T.E. Goldsmith, K.M. Butler (2012). Validation of individuals’ semantic networks for common knowledge is associated with false memory. The Quarterly Journal of Experimental Psychology. 65(6), 1035-1043.
Taylor, H. A., & Tversky, B. (1992). Spatial mental models derived from survey and route descriptions. Journal of Memory and language, 31(2), 261-292.
Thorndyke, P. W., & Hayes-Roth, B. (1982). Differences in spatial knowledge acquired from maps and navigation. Cognitive Psychology. 14(4), 560-589.
Tolman, E. C. (1948). Cognitive maps in rats and men. Psychological review, 55(4), 189-208.
Torgerson, W.S., (1952). Multidimensional scaling: I. Theory and method. Psychometrika. 17(4), 401-419.
Troberg, E., Gillan, D.J., (2007). Measuring spatial knowledge, Proceedings of the Human Factors and Ergonomics Society 51st Annual Meeting. 368-371.
Trumpower, D. L., Sharara, H., & Goldsmith, T. E. (2010). Specificity of structural
Tulving, E., & Thompson, D., (1973). Encoding specificity and retrieval processes in episodic memory. Psychological Review. 80(5), 352-373.
Tversky, B. (1992). Distortions in cognitive maps. Geoforum, 23(2), 131-138. Van Asselen, M., Fritschy, E., & Postma, A. (2006). The influence of intentional and
incidental learning on acquiring spatial knowledge during navigation. Psychological Research, 70(2), 151-156.
Appendix A. Verification Questions 10 Non-locative questions – Park, Narrative
The park was built less than a decade ago. (True) (False) The picnic table is brown. (True) (False)
The shed is likely used for garden tools. (True) (False) The playground was empty. (True) (False)
The playground had monkey bars. (True) (False) The flag pole was blowing in the wind. (True) (False) The bench was made of stone. (True) (False)
The park is privately owned. (True) (False)
The park resides just outside of a large town. (True) (False) The garden included sunflowers. (True) (False)
10 Non-locative questions – Town, Narrative The town was described as being small. (True) (False)
The street entering the town was Williams Street. (True) (False) The restaurant served Italian food. (True) (False)
The hospital was three stories tall. (True) (False)
The grocery store was mostly made of brick. (True) (False) The movie theater was crowded. (True) (False)
The library had a set of concrete stairs leading to the front door. (True) (False) The woman at the post office was holding an envelope. (True) (False)
The fire station did not look busy. (True) (False)
The school was only for elementary age students. (True) (False) 10 Non-locative questions – Park, Map
The shape of the garden was a circle. - False The gazebo was bigger than the shed. - True There were two circles. - True
The flag pole was the tallest shape. - False The pond was the biggest shape. - True The oak tree was a rectangle. - True
The playground was bigger than the parking lot. - False There were four squares. - False
The smallest shape was the picnic table. - False
The shape of the police station was a circle. - True The post office was bigger than the fire station. - False The library was a square. - False
There were four circles. - False
The hospital was bigger than the restaurant. - True The grocery store was the only oval shape. - True
The school and the fire station were both rectangles. - True The largest shape was the hospital. - False
The smallest shape was the gas station. - True
Appendix E. Santa Barbara Sense-of-Direction Scale SANTA BARBARA SENSE-OF-DIRECTION SCALE
Sex: F M Today's Date:________________ Age:_______ V. 2
This questionnaire consists of several statements about your spatial and navigational abilities, preferences, and experiences. After each statement, you should circle a number to indicate your level of agreement with the statement. Circle "1" if you strongly agree that the statement applies to you, "7" if you strongly disagree, or some number in between if your agreement is intermediate. Circle "4" if you neither agree nor disagree.
1. I am very good at giving directions. strongly agree 1 2 3 4 5 6 7 strongly disagree 2. I have a poor memory for where I left things. strongly agree 1 2 3 4 5 6 7 strongly disagree 3. I am very good at judging distances. strongly agree 1 2 3 4 5 6 7 strongly disagree 4. My "sense of direction" is very good. strongly agree 1 2 3 4 5 6 7 strongly disagree
5. I tend to think of my environment in terms of cardinal directions (N, S, E, W). strongly agree 1 2 3 4 5 6 7 strongly disagree
6. I very easily get lost in a new city.
strongly agree 1 2 3 4 5 6 7 strongly disagree 7. I enjoy reading maps.
strongly agree 1 2 3 4 5 6 7 strongly disagree 8. I have trouble understanding directions. strongly agree 1 2 3 4 5 6 7 strongly disagree 9. I am very good at reading maps.
strongly agree 1 2 3 4 5 6 7 strongly disagree
10. I don't remember routes very well while riding as a passenger in a car. strongly agree 1 2 3 4 5 6 7 strongly disagree
11. I don't enjoy giving directions.
strongly agree 1 2 3 4 5 6 7 strongly disagree 12. It's not important to me to know where I am. strongly agree 1 2 3 4 5 6 7 strongly disagree
13. I usually let someone else do the navigational planning for long trips. strongly agree 1 2 3 4 5 6 7 strongly disagree
14. I can usually remember a new route after I have traveled it only once. strongly agree 1 2 3 4 5 6 7 strongly disagree
Appendix F. Spatial Representation Questionnaire Spatial Perspective Questions
3. Think about the way you orient yourself in different environments around you. Would you describe yourself as a person:
a. who orients him/herself by remembering routes connecting one place to another? 1 (not at all) 2 3 4 5 (very much)
b. who orients him/herself by looking for well-known landmarks? 1 (not at all) 2 3 4 5 (very much)
c. who tries to create a mental map of the environment? 1 (not at all) 2 3 4 5 (very much)
4. Think of an unfamiliar city. Write the name . . . Now try to classify your representation of the city:
a. survey representation, that is a map-like representation 1 (not at all) 2 3 4 5 (very much)
b. route representation, based on memorising routes 1 (not at all) 2 3 4 5 (very much)
c. landmark-centred representation, based on memorising single salient landmarks (such as monuments, buildings, crossroads, etc.)
Appendix G. Individual Correlations between Methods and Map Sketches Correlations between Methods and Map Sketch Pairwise Distances
Narrative Training Condition Map Training Condition Participa
nt Number
Distance
Estimates MDS
Pathfinde r Participa nt Number Distance
Estimates MDS
Pathf inder
P1 0.38 0.40 0.58 P2 0.60 0.32 0.36
P3 0.66 0.71 0.43 P4 0.79 0.62 0.79
P5 0.65 0.67 0.57 P6 0.80 0.82 0.70
P7 0.16 0.03 0.24 P8 0.76 0.79 0.51
P9 0.43 0.43 0.20 P12 0.71 0.11 0.43
P11 0.79 0.76 0.79 P14 0.41 0.23 0.37
P13 0.69 0.56 0.45 P16 0.62 0.62 0.46
P15 0.49 0.49 0.48 P18 0.46 0.43 0.49
P17 0.91 0.92 0.89 P20 0.78 0.78 0.69
P19 0.87 0.85 0.70 P22 0.34 0.26 0.51
P21 0.88 0.89 0.76 P24 0.91 0.93 0.85
P23 -0.03 0.15 -0.19 P26 0.97 0.98 0.79
P25 0.26 0.26 0.31 P28 0.72 0.76 0.63
P27 0.20 0.06 0.19 P30 0.92 0.94 0.67
P29 0.52 0.52 0.57 P32 0.83 0.75 0.81
P31 -0.23 -0.17 -0.13 P34 0.70 0.72 0.62
P35 -0.08 0.02 -0.08 P38 0.86 0.89 0.80
P37 0.80 0.80 0.85 P40 0.71 0.63 0.52
P39 0.62 0.62 0.50 P42 0.91 0.93 0.77
P41 0.26 0.09 0.26 P44 0.86 0.90 0.78
P43 0.89 0.84 0.82 P46 0.36 0.38 0.34
P45 0.77 0.72 0.62 P48 0.80 0.83 0.71
P47 0.78 0.72 0.59 P50 0.78 0.80 0.91
P49 0.50 0.52 0.57 P52 0.25 0.33 0.32
P51 0.35 0.33 0.14 P54 0.61 0.54 0.75
P53 0.47 0.48 0.43 P56 0.88 0.87 0.85
P55 0.52 0.50 0.33 P58 0.80 0.81 0.67
P57 0.29 0.28 0.34 P60 0.69 0.73 0.53
P59 0.89 0.91 0.80 P62 0.51 0.42 0.61
P61 -0.12 -0.16 -0.19 P64 0.57 0.53 0.51
P63 0.73 0.71 0.55 P66 0.87 0.88 0.86
P67 0.52 0.55 0.16 P70 0.93 0.94 0.83
P69 0.50 0.44 0.04 P72 0.76 0.77 0.45
P71 -0.09 -0.11 -0.26 P74 0.68 0.54 0.73
P73 0.17 0.09 0.13 P76 0.32 0.30 0.07
P75 0.06 0.04 0.07 P78 0.78 0.66 0.63
P77 0.79 0.74 0.41