Single-top and top-antitop cross sections
NikolaosKidonakis1,∗
1Department of Physics, Kennesaw State University, Kennesaw, GA 30144, USA
Abstract. I present high-order calculations, including soft-gluon corrections, for single-top and top-antitop production cross sections and differential distri-butions. For single-top production, results are presented for the three diff er-ent channels in the Standard Model, for associated production with a charged Higgs, and for processes involving anomalous couplings. For top-antitop pair production, total cross sections and top-quark transverse-momentum and rapid-ity distributions are presented for various LHC energies.
1 Introduction
Higher-order soft-gluon corrections have been calculated through N3LO for top-quark
pro-duction via various processes; see Ref. [1] for a review. Here I present the latest results
fort-channel ands-channel single-top production,tWandtH−production,tZproduction via
anomalous couplings, andtt¯production. For all these processes QCD corrections are very
significant and are dominated by soft-gluon corrections.
I calculate and resum these soft corrections at next-to-next-to-leading logarithm (NNLL)
accuracy for the double-differential cross section, which is then used to calculate top-quark
transverse-momentum and rapidity distributions and total cross sections. Finite-order
expan-sions at approximate NNLO (aNNLO) and approximate N3LO (aN3LO), matched to exact
results, provide the best predictions for these quantities.
We calculate soft-gluon corrections for partonic processes of the form f1(p1) + f2(p2)→t(pt) + X
and we defines=(p1+p2)2,t=(p1−pt)2,u=(p2−pt)2, ands4 =s+t+u−m2. At
partonic thresholds4 → 0. Thenth-order soft-gluon corrections appear as
lnk(s
4/m2t)/s4
+
wherek≤2n−1.
Moments of the partonic cross section, ˆσ(N)=(ds4/s)e−Ns4/sσˆ(s4), can be written in
factorized form
σf1f2→tX(N, )=Hf1f2→tX
IL (αs(µR))SLIf1f2→tX
m
t
NµF, αs(µR) Jin(N, µF, )
Jout(N, µF, )
in 4−dimensions, whereHf1f2→tX
IL is a hard function andSLIf1f2→tXis a soft-gluon function.
Sf1f2→tX
LI satisfies the renormalization group equation
µ ∂
∂µ+β(gs)
∂
∂gs
Sf1f2→tX
LI =−(Γ†S)
f1f2→tX
LK S
f1f2→tX
KI −S
f1f2→tX
LK (ΓS)
f1f2→tX KI
where the soft anomalous dimensionΓSf1f2→tXcontrols the evolution of the soft function,
giv-ing the exponentiation of logarithms ofN. To achieve NNLL accuracy we need to calculate
the relevant soft anomalous dimensions at two loops.
2 Single-top production
We now provide results for single-top production in thet-channel,s-channel, and viatW
pro-duction. Fixed-order results for these processes are known at NNLO for thet-channel [2–4]
ands-channel [5], and at NLO fortWproduction [6]. Here we provide results with soft-gluon
corrections at aNNLO fort- ands-channel production [7], and at aN3LO fortWproduction
[8]; these results are obtained from NNLL resummation [7–9]. We use MMHT2014 NNLO pdf [10].
6 7 8 9 10 11 12 13 14
S1/2 (TeV)
10 100
σ
(pb)
t-ch. total t-ch. top t-ch. antitop ATLAS CMS
Single-top t-channel aNNLO cross sections mt=172.5 GeV
1.94 1.96 1.98 2 2
2.5 3
CDF&D0
0 50 100 150 200 250
pT top (GeV)
0.000 0.002 0.004 0.006 0.008 0.010 0.012 0.014
1/
σ
d
σ
/dp
T
(GeV
-1)
aNNLO + CMS
t-channel normalized top pT distribution at LHC S1/2=8 TeV
Figure 1.(Left) Single-topt-channel aNNLO cross sections compared with CMS and ATLAS data at 7 TeV [12, 13], 8 TeV [14, 15], and 13 TeV [16, 17], and with CDF and D0 combined data at 1.96 TeV [18]. (Right) Top-quark aNNLO normalizedpT distributions int-channel production at 8 TeV compared to CMS [19] data.
6 7 8 9 10 11 12 13 14
S1/2 (TeV)
1 10
σ
(pb)
s-ch. total s-ch. top s-ch. antitop ATLAS CMS
Single-top s-channel aNNLO cross sections mt=172.5 GeV
1.94 1.96 1.98 2 1
1.5 CDF&D0
6 7 8 9 10 11 12 13 14
S1/2 (TeV)
10 100
σ
(pb)
aN3LO ATLAS CMS ATLAS&CMS
tW-+ tW+ aN3LO cross section m t=172.5 GeV
Figure 2.(Left) Single-tops-channel aNNLO cross sections compared to ATLAS and CMS data at 7 TeV [20, 21] and 8 TeV [21, 22], and to CDF and D0 combined data [23] at 1.96 TeV. (Right) aN3LO
cross sections fortWproduction compared to ATLAS and CMS data at 7 TeV [24, 25], 8 TeV [26], and 13 TeV [27, 28].
We begin witht-channel production at aNNLO. In the left plot of Fig. 1 we display total
Results are given for the single-top cross section, the single-antitop cross section, and their sum. We observe very good agreement of the aNNLO theory curves [7, 11] with all available data from the LHC and the Tevatron at various energies. The right plot of Fig. 1 shows
the aNNLO normalized top-quarkpTdistributions at 8 TeV LHC energy, which describe the
corresponding data from CMS [19] quite well.
We continue withs-channel production at aNNLO. In the left plot of Fig. 2 we show cross
sections for single-top and single-antitops-channel production, and their sum, as functions
of energy at the LHC and (inset) at the Tevatron. We again observe very good agreement of the aNNLO theory curves [7, 11] with available data at LHC and Tevatron energies.
We next discusstWproduction at aN3LO. In the right plot of Fig. 2 we show the total
tW−+tW¯ + cross section as a function of LHC energy. Very good agreement is observed
between the aN3LO results [8, 11] and the data at 7, 8, and 13 TeV energies.
3
tH
−production
We continue withtH−production in the MSSM or other two-Higgs-doublet models [29]. We
use MMHT2014 NNLO pdf [10] for our numerical results.
200 400 600 800 1000 1200 1400
mH- (GeV)
10-4
10-3
10-2
10-1
100
σ
(pb)
14 TeV 13 TeV 8 TeV 7 TeV
bg-> tH- at LHC aN3LO tanβ=30 µ=mH
-165 170 175 180
mt (GeV)
0 50 100 150 200 250 300
σ
(fb) 14 TeV13 TeV 8 TeV 7 TeV
g u -> t Z at LHC aNNLO ktuZ=0.01
165 170 175 180 1.05
1.1
1.15K-factors aNNLO/NLO
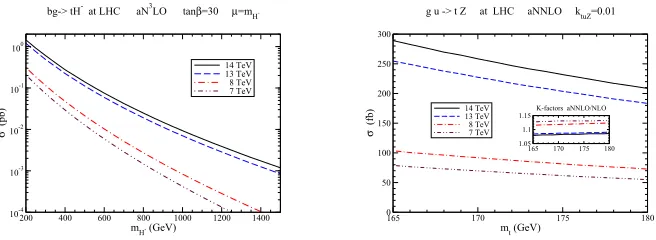
Figure 3. (Left) aN3LO cross sections fortH− production. (Right) aNNLO cross sections fortZ
production via anomalous couplings.
In the left plot of Fig. 3 we show the aN3LO total cross section fortH−production [11] as
a function of charged-Higgs mass at LHC energies of 7, 8, 13, and 14 TeV. We use tanβ=30.
The soft-gluon corrections are large for this process. Top-quarkpT and rapidity distributions
in this process have also been presented in [29].
4
tZ
production via anomalous couplings
Next, we discuss soft-gluon corrections intZ production in models with anomalous t-q-Z
couplings [30, 31]. The NLO corrections for this process were calculated in Ref. [32]. The complete NLO corrections are very well approximated by the soft-gluon corrections at that order.
We use CT14 pdf [33] for our numerical results in this process. In the right plot of Fig.
3 we plot the aNNLO total cross section fortZproduction as a function of top-quark mass at
LHC energies of 7, 8, 13, and 14 TeV.
The K-factors shown in the inset plot show that the aNNLO corrections are large and
in providing theoretical input to experimental limits on the couplings [34, 35]. Top-quark
differential distributions in this process have been presented in Ref. [31].
Similar results have more recently been presented fortγproduction via anomalous
cou-plings in Ref. [36].
5 Top-antitop pair production
Finally, we discuss top-antitop pair production [37, 38]. The soft anomalous dimensions are
2×2 matrices for theqq¯→tt¯channel, and 3×3 matrices for thegg→tt¯channel.
5 6 7 8 9 10 11 12 13 14
S1/2 (TeV)
100 1000
σ
(pb)
aN3LO CMS ATLAS
pp -> tt at LHC energies aN3LO mt=172.5 GeV
1.8 1.9 2
3 10
D0 CDF CDF&D0 pp -> tt Tevatron
Figure 4. Top-antitop aN3LO cross sections compared with CMS data at 5.02 TeV [41] and with
ATLAS and CMS data at 7 TeV [42, 43], 8 TeV [43, 44], and 13 TeV [45, 46] LHC energies. The inset shows the aN3LO cross section compared with CDF [47] and D0 [48] data at 1.8 TeV, and CDF&D0
combined data [49] at 1.96 TeV Tevatron energy.
At one loop forqq¯ → tt¯, the elements of theΓSqq¯→tt¯matrix in ans-channel singlet-octet
color basis are
Γq11q¯→tt¯(1) = Γ(1)cusp, Γq12q¯→tt¯(1)=CF
CA ln
t 1
u1
, Γq21q¯→t¯t(1) =2 ln
t 1
u1
,
Γq22q¯→tt¯(1) =
1−2CCA
F
Γ(1)cusp+4CFln
t1
u1
−C2A 1+ln
sm2tt21
u4 1
.
At two loops forqq¯→tt¯, the elements of theΓqSq¯→tt¯matrix are
Γq11q¯→tt¯(2) = Γcusp(2) , Γq12q¯→tt¯(2)= K
2 −
CA 2 N2l
Γq12q¯→tt¯(1),
Γq21q¯→tt¯(2) = K
2 +
CA
2 N2l
Γq21q¯→tt¯(1),
Γq22q¯→tt¯(2) = K
2Γ
qq¯→tt¯(1)
22 +
1−2CCA
F Γ
(2)
cusp−K2Γ(1)cusp
See also Ref. [1] for more details. HereΓcuspis the cusp anomalous dimension [39].
The soft-gluon corrections are large and they are excellent approximations to the complete
corrections at both NLO and NNLO. The additional corrections at aN3LO provide further
significant enhancements and must be included for precision physics. Another approach for
the aN3LO corrections has appeared recently in Ref. [40].
In our numerical results below we use the MMHT2014 NNLO pdf [10]. The total
top-antitop cross sections at aN3LO [38] are shown in Fig. 4 and compared with data at Tevatron
and LHC energies. We find remarkable agreement between theory and data at all energies.
0 50 100 150 200 250 300 350 400 450 500 550
pT (GeV)
0 0.002 0.004 0.006 1/ σ d σ /dpT (GeV -1)
aN3LOµ=m t
aN3LOµ=m T
+CMS dilepton
Normalized top pT distribution at the LHC S1/2=13 TeV
300 350 400 450 500 550 10-5
10-4
10-3
0 50 100 150 200 250 300 350 400
pT (GeV)
0 0.002 0.004 0.006 0.008 1/ σ d σ /dpT (GeV -1)
aN3LOµ=m t
aN3LOµ=m T
+ ATLAS l+jets
Normalized top pT distribution at the LHC S1/2=8 TeV
300 400 500 10-5
10-4
10-3
Figure 5. aN3LO top-quark normalizedp
T distributions (left) at 13 TeV energy compared with CMS [50] data and (right) at 8 TeV energy compared with ATLAS [51] data.
The aN3LO top-quark normalized pT distributions in tt¯production are shown in Fig.
5 at 13 TeV (left plot) and 8 TeV (right plot) and compared with CMS and ATLAS data respectively. We find excellent agreement of the theoretical predictions with the data.
-4 -2 0 2 4
Y 0 0.05 0.1 0.15 0.2 0.25 0.3 0.35 1/ σ d σ /dY
aN3LOµ=m t
µ=mt/2, 2mt
+ CMS dilepton
Normalized top rapidity distribution at LHC S1/2=13 TeV
-3 -2 -1 0 1 2 3
Y 0 0.1 0.2 0.3 0.4 1/ σ d σ /dY
aN3LOµ=m t
µ=mt/2, 2mt + CMS l+jets
Normalized top rapidity distribution at LHC S1/2=8 TeV
Figure 6. Top-quark aN3LO normalized rapidity distribution at (left) 13 TeV energy compared with
CMS data [50] and (right) 8 TeV energy compared with CMS data [52].
The aN3LO top-quark normalized rapidity distributions intt¯production are shown in Fig.
6 Summary
We have discussed cross sections and distributions for various top-quark production
pro-cesses. Soft-gluon corrections are important in all cases. We have shown results fort-channel
ands-channel single-top production at aNNLO,tWproduction at aN3LO,tH−production at
aN3LO,tZproduction via anomalous couplings at aNNLO, andtt¯production at aN3LO. We
find excellent agreement with available collider data. The higher-order corrections are very significant and need to be included for better theoretical predictions.
Acknowledgments
This material is based upon work supported by the National Science Foundation under Grant No. PHY 1519606.
References
[1] N. Kidonakis, Int. J. Mod. Phys. A33, 1830021 (2018) [arXiv:1806.03336 [hep-ph]].
[2] M. Brucherseifer, F. Caola, and K. Melnikov, Phys. Lett. B 736, 58 (2014)
[arXiv:1404.7116 [hep-ph]].
[3] E.L. Berger, J. Gao, C.-P. Yuan, and H.X. Zhu, Phys. Rev. D 94, 071501 (2016)
[arXiv:1606.08463 [hep-ph]].
[4] E.L. Berger, J. Gao, and H.X. Zhu, JHEP1711, 158 (2017) [arXiv:1708.09405 [hep-ph]].
[5] Z. Liu and J. Gao, arXiv:1807.03835 [hep-ph].
[6] S.H. Zhu, Phys. Lett. B 524, 283 (2002) [Erratum: ibid. 537, 351 (2002)]
[hep-ph/0109269].
[7] N. Kidonakis, Phys. Rev. D 81, 054028 (2010) [arXiv:1001.5034 [hep-ph]]; 83,
091503(R) (2011) [arXiv:1103.2792 [hep-ph]];88, 031504(R) (2013) [arXiv:1306.3592
[hep-ph]];93, 054022 (2016) [arXiv:1510.06361 [hep-ph]].
[8] N. Kidonakis, Phys. Rev. D96, 034014 (2017) [arXiv:1612.06426 [hep-ph]]; in
Proceed-ings of DPF 2017, eConf C170731 [arXiv:1709.06975 [hep-ph]].
[9] N. Kidonakis, Phys. Rev. D82, 054018 (2010) [arXiv:1005.4451 [hep-ph]].
[10] L.A. Harland-Lang, A.D. Martin, P. Molytinski, and R.S. Thorne, Eur. Phys. J. C75,
204 (2015) [arXiv:1412.3989 [hep-ph]].
[11] N. Kidonakis, inProceedings of CIPANP2018[arXiv:1808.02934 [hep-ph]].
[12] CMS Collab., JHEP1212, 035 (2012) [arXiv:1209.4533 [hep-ex]].
[13] ATLAS Collab., Phys. Rev. D90, 112006 (2014) [arXiv:1406.7844 [hep-ex]].
[14] CMS Collab., JHEP1406, 090 (2014) [arXiv:1403.7366 [hep-ex]].
[15] ATLAS Collab., Eur. Phys. J. C77, 531 (2017) [arXiv:1702.02859 [hep-ex]].
[16] ATLAS Collab., JHEP1704, 086 (2017) [arXiv:1609.03920 [hep-ex]].
[17] CMS Collab., Phys. Lett. B772, 752 (2017) [arXiv:1610.00678 [hep-ex]].
[18] CDF and D0 Collab., Phys. Rev. Lett.115, 152003 (2015) [arXiv:1503.05027 [hep-ex]].
[19] CMS Collab., CMS-PAS-TOP-14-004. [20] ATLAS Collab., ATLAS-CONF-2011-118.
[21] CMS Collab., JHEP1609, 027 (2016) [arXiv:1603.02555 [hep-ex]].
[22] ATLAS Collab., Phys. Lett. B756, 228 (2016) [arXiv:1511.05980 [hep-ex]].
[23] CDF and D0 Collab., Phys. Rev. Lett.112, 231803 (2014) [arXiv:1402.5126 [hep-ex]].
[24] ATLAS Collab., Phys. Lett. B716, 142 (2012) [arXiv:1205.5764 [hep-ex]].
[26] ATLAS and CMS Collab., ATLAS-CONF-2016-023, CMS-PAS-TOP-15-019.
[27] ATLAS Collab., JHEP1801, 063 (2018) [arXiv:1612.07231 [hep-ex]].
[28] CMS Collab., arXiv:1805.07399 [hep-ex].
[29] N. Kidonakis, JHEP 0505, 011 (2005) [hep-ph/0412422]; Phys. Rev. D94, 014010
(2016) [arXiv:1605.00622 [hep-ph]].
[30] A. Belyaev and N. Kidonakis, Phys. Rev. D65, 037501 (2002) [hep-ph/0102072]; N.
Kidonakis and A. Belyaev, JHEP0312, 004 (2003) [hep-ph/0310299].
[31] N. Kidonakis, Phys. Rev. D97, 034028 (2018) [arXiv:1712.01144 [hep-ph]].
[32] B.H. Li, Y. Zhang, C.S. Li, J. Gao, and H.X. Zhu, Phys. Rev. D83, 114049 (2011)
[arXiv:1103.5122 [hep-ph]].
[33] S. Dulat, T.-J. Hou, J. Gao, M. Guzzi, J. Huston, P. Nadolsky, J. Pumplin, C. Schmidt,
D. Stump, and C.-P. Yuan, Phys. Rev. D93, 033006 (2016) [arXiv:1506.07443 [hep-ph]].
[34] CMS Collaboration, JHEP1707, 003 (2017) [arXiv:1702.01404 [hep-ex]].
[35] ATLAS Collaboration, ATLAS-CONF-2017-070.
[36] M. Forslund and N. Kidonakis, arXiv:1808.09014 [hep-ph].
[37] N. Kidonakis, Phys. Rev. D82, 114030 (2010) [arXiv:1009.4935 [hep-ph]]; inPhysics
of Heavy Quarks and Hadrons, HQ2013[arXiv:1311.0283 [hep-ph]].
[38] N. Kidonakis, Phys. Rev. D 90, 014006 (2014) [arXiv:1405.7046 [hep-ph]]; 91,
031501(R) (2015) [arXiv:1411.2633 [hep-ph]];91, 071502(R) (2015) [arXiv:1501.01581
[hep-ph]].
[39] N. Kidonakis, Phys. Rev. Lett.102, 232003 (2009) [arXiv:0903.2561 [hep-ph]]; Int. J.
Mod. Phys. A31, 1650076 (2016) [arXiv:1601.01666 [hep-ph]].
[40] J. Piclum and C. Schwinn, JHEP1803, 164 (2018) [arXiv:1801.05788 [hep-ph]].
[41] CMS Collab., JHEP1803, 115 (2018) [arXiv:1711.03143 [hep-ex]].
[42] ATLAS Collab., Eur. Phys. J. C74, 3109 (2014) [Addendum: ibid. 76, 642 (2016)]
[arXiv:1406.5375 [hep-ex]].
[43] CMS Collab., JHEP1608, 029 (2016) [arXiv:1603.02303 [hep-ex]].
[44] ATLAS Collab., Eur. Phys. J. C78, 487 (2018) [arXiv:1712.06857 [hep-ex]].
[45] ATLAS Collab., Phys. Lett. B 761, 136 (2016) [Erratum: ibid. 772, 879 (2017)]
[arXiv:1606.02699 [hep-ex]].
[46] CMS Collab., JHEP1709, 051 (2017) [arXiv:1701.06228 [hep-ex]].
[47] CDF Collab., Phys. Rev. D64, 032002 (2001) [Erratum:ibid.67, 119901 (2003)]
[hep-ex/0101036].
[48] D0 Collab., Phys. Rev. D67, 012004 (2003) [hep-ex/0205019].
[49] CDF and D0 Collab., Phys. Rev. D89, 072001 (2014) [arXiv:1309.7570 [hep-ex]].
[50] CMS Collab., JHEP1804, 060 (2018) [arXiv:1708.07638 [hep-ex]].
[51] ATLAS Collab., Eur. Phys. J. C76, 538 (2016) [arXiv:1511.04716 [hep-ex]].
![Figure 1. (Left) Single-top t-channel aNNLO cross sections compared with CMS and ATLAS data at7 TeV [12, 13], 8 TeV [14, 15], and 13 TeV [16, 17], and with CDF and D0 combined data at 1.96TeV [18]](https://thumb-us.123doks.com/thumbv2/123dok_us/8029101.1335939/2.482.75.400.442.566/figure-single-channel-annlo-sections-compared-atlas-combined.webp)
![Figure 4. Top-antitop aN3LO cross sections compared with CMS data at 5.02 TeV [41] and withATLAS and CMS data at 7 TeV [42, 43], 8 TeV [43, 44], and 13 TeV [45, 46] LHC energies](https://thumb-us.123doks.com/thumbv2/123dok_us/8029101.1335939/4.482.104.353.196.398/figure-antitop-cross-sections-compared-cms-withatlas-energies.webp)
![Figure 5. aN3LO top-quark normalized pT distributions (left) at 13 TeV energy compared with CMS[50] data and (right) at 8 TeV energy compared with ATLAS [51] data.](https://thumb-us.123doks.com/thumbv2/123dok_us/8029101.1335939/5.482.73.406.447.564/figure-normalized-distributions-energy-compared-energy-compared-atlas.webp)
