300
MITCHELL
COPENHAVER, J. S., AND R. C. CARTER. 1966. Early weaning and multiple weaning. Progr. Rep. Va. Agr. Exp. Sta. 1965-6: 54-57
DARLING, F. F. 1934. Animal breeding in the British Em- pire. Imperial Bureau of Animal Genetics, Edinburgh. 47 p.
EPSTEIN, H. 1965. Regionalisation and stratification in livestock breeding. Anim. Breed. Abstr. 33: 169-181. EYAL, E., AND H. GOOT. 1968. Vital statistics and milk and
lamb production of F1 ewes (Awassi x East Friesian) under farm conditions. Volcani Inst. Agr. Res. Pam. 120:1-24. FORTI, M. 1970. Grazing trials on perennial fodder bushes.
Preliminary report: Negev Institute for Arid Zone Re- search, Beer Sheva. May 1970.
FORTI, M. 1971. The introduction and evaluation of fod- der shrubs in semi-arid areas of the Northern Negev. Submitted for publication.
GOOT, H. 1965. Studies on the native Awassi sheep and its crosses with exotic East Friesian milk sheep. Ph.D. thesis. Hebrew University, Jerusalem. (Hebrew).
GOOT, H. 1967. Some data on out of season lambing in mutton Merino ewes. Israel J. Agr. Res. 17:219-224. HAMMOND, J. 1936. Environmental conditions and live-
stock breeding. Probl. Zivotn 1936: 101-112.
HAMMOND, J. 1947. Animal breeding in relation to nu- trition and environmental conditions. Biol. Rev. (Camb.) 22: 195-223.
HUNTER, G. L. (1968a). Increasing the frequency of preg- nancy in sheep. I. Some factors affecting rebreeding during the post @-turn period. Anim. Breed. Abstr. 36: 347-378.
HUNTER, G. L. (1968b). Increasing the frequency of preg- nancy in sheep. II. Artificial control of breeding and prob-
lems of conception and maintenance of pregnancy during the post parturn period. Anim. Breed. Abstr. 36:533-553. MEIGS, P. 1953. World distribution of arid and semi-arid
homoclimates. In ‘Reviews on research on arid zone hy- drology’. Arid Zone Programme I. Unesco, Paris. p. 203- 210 + 2 maps.
MORAG, M., AND E. EYAL. 1971. Post partum conception in lactating Awassi and East Friesian x Awassi dairy ewes. J. Agr. Sci. 77:109-116.
NICHOLS, J. E. 1957. Livestock improvement in relation to heredity and environment. 4th ed. Oliver and Boyd, Edinburgh. 240 p.
OWEN, J. B. 1969. The intensification of sheep produc- tion. Outlook Agr. 6:36-40.
OWEN, J. B., AND D. A. R. DAVIES. 1970. Milk replacers in the artificial rearing of lambs. J. Sci. Food Agr. 21: 340-34 1.
PEARSE, C. K. 1971. Grazing in the Middle East: past, present and future. J. Range Manage. 24:13-16.
ROKACH, A. 1964. Land and water. In ‘Agricultural plan- ning and village community in Israel.’ Arid Zone Re- search XXIII. Ed. J. Ben David. Unesco, Paris. p. 13-20. TADMOR, N. H., E. EYAL, R. BENJAMIN, L. SHANAN, N.
SELIGMAN, AND B. YOGEV. 1963-1970. Dryland range in the Northern Negev of Israel. 1. 1962/63 2. 1963/64 3. 1964/65 4. 1965/66 5. 1966/67 6. 1967/69. Progr. Rep. Volcani Inst. Agr. Res.
TADMOR, N. H., E. EYAL, AND R. BEN JAMIN. 1971. Pri- mary and secondary production of arid grassland. Paper submitted to IBP Seminar ‘Ecophysiological basis of Arid Zone ecosystem productivity’ to be held in Leningrad,
1972.
THORNWAITE, C. W. 1948. An approach towards a ra- tional classification of climate. Geogr. Rev. 38:55-94.
An Analysis of the
Beta-Attenuation Technique for
Estimating Standing Crop of
Prairie Range1
J. E. MITCHELL
Department of Range Science and Natural Resource Ecology Laboratory, Colorado State University,
Fort Collins.
Highlight
The standing crop of aboveground shortgrass prairie vegetation may be quickly and accurately estimated by the beta-attenuation technique. This technique is based upon the principle that herbage absorbs or attenuates beta par- ticles emitted by certain radioactive nuclides as a predict- able function of the herbage biomass intersecting the attenuation field between emitter and detector. Two
l This paper reports on work supported in part by National Science Foundation Grant GB-13096 for Analysis of Struc- ture and Function of Grassland Ecosystems. Received August 23, 197 1.
methods of measurement are correlated with standing vege- tation. These tests indicate that the method can account for approximately 90% of the variation measured in the field, with the exception of quadrats dominated by plains prickly pear. In addition to being accurate, precise, and relatively inexpensive, the beta-attenuation technique is nondestructive in nature, allowing repetitive sampling of the same location.
Range ecologists and others involved in studies
of the structure and function of rangeland ecosys-
tems, or their inventory for management
purposes,
have continually
attempted to improve upon exist-
ing procedures for estimating herbage biomass ac-
curately, precisely, quickly, and inexpensively.
The
methods most commonly utilized in range research
involve clipping to at least some degree. However,
there are one or two characteristics
of clipping
which tend to limit its usefulness.
First, clipping
tends to be slow, arduous, and costly to utilize.
Secondly, clipping is a destructive
sampling pro-
cedure, precluding
a quadrat from being sampled
repetitively.
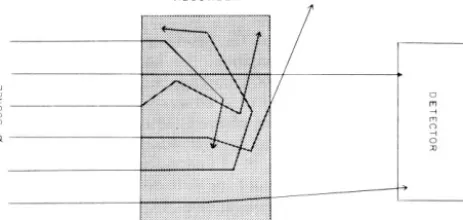
BETA-ATTENUATION
FIG. 1. Schematic diagram of beta-particle attenuation. Standing crop of quadrat vegetation is portrayed by the absorber box.
estimation
procedure
(Pechanec
and Pickford,
1937).
For purposes of general range inventory
the ocular estimation
method is satisfactory.
On
the orher hand, for some kinds of research and nave
specialized range resource inventory, more accurate
techniques
are required.
The first piece of equipment
for directly IIICI-
suring herbage biomass was constructed by Fletcher
and Robinson
(1956).
Their
capacitance
meter
was based on the principle
that air has a low di-
electric
constant
while herbage
has a high di-
electric constant.
Unfortunately,
water with a di-
electric constant of about 80 has much more influ-
ence than dry forage with a constant of about 5
(\\ieast, 1969), causing variations in both plant and
soil moisture to bias capacitance
readings signifi-
cantly on occasion.
There
has been significant
progress in improving
upon the original
capaci-
tance meter, however, and many of such studies
are still ongoing (Van Dyne et al., 1968).
The
first use of radioisotopes to determine her- baceous biomass was reportedby Tare
et al. (1966).
According
to the authors this technique,
termed
beta-attenuation,
relies on the “thickness gayging”
principle
where the absorption
or attenuation
of
beams of radioactive
emissions (beta-particles)
is a
predictable
function
of the density of absorbing
material
(herbage)
in mg cr+.
Herbage density
data may be transformed directly to biomass infor-
mation if it is integrated over plant height, thereby
allowing standing crop to be the dependent variable
in a regression
against
radioactivity.
Working
with such agronomic crops as wheat and soybeans,
Tare
and his colleagues reported that their “beta-
foliagometer”
allowed
them to produce
linear
regression
equations
accounting
for 98% of the
variation
in wet weight standing crop.
Equipment
The equipment necessary for an analysis of herbaceous biomass by beta-attenuation must include bath a radio. active source and some kind of detector/recorder. A sche- matic diagram of the system is shown in Fig. 1.
There are several feasible radioactive sources which may he utilized far studies of this type. Table 1 lists scvoral of those which are available for use by qualified users. The
Table 1. List of radioisotopes which may be utilized for “thickness gauging” by beta-attenuation.
Isotope E”CTgy Half-life
Carbon’4 .I6 Mev 5.7 x 10³ years
Chlorine”” .71 3.0 x 10⁶
Krypton85 .67 10.4
Strantiumgo 2.27 28.0
ThalliumZo4 .77 3.9
choice of source will depend upon the density of vegetation to be sampled. For example, str”ntiumg0, chlorines”, and carbon’4 may be utilized for 600, 200, and 25 mg cm-2 max- imum density respectively (Tare et al., 1966). In addition to the energy requirements, a source should also have a long half-life and he economically available to the user.
A Geiger-Mueller (GYM) tube is commonly used to detect beta emissions. Far the softer betas, a thin-windowed G-M tube is necessary, requiring cautious use in the field to keep it from being punctured. The term “soft beta” may be used to qualitatively define those heta-emitters with a maximum energy below about 0.5 MEV. There are two types of re- cording apparatus which may be connected to a G-M tube: (I) a ratemeter such as incorporated into a survey meter, or (2) a portable scaler which gives a more precise digital readout in counts per minute.
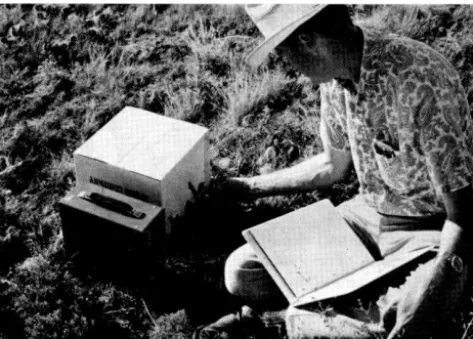
For the implementation of this experiment, 10 micro- curies (&i) of strontium80 were acquirrd on loan from the Radiology and Kadiation Biology Departme”t at Colorado State lJniversity, Fort Collins. The isotope, in liquid form, was applied uniformly “ver the entire area of an 8 x IO-inch sheet of paper marked off into square centimeters. When the radioactive solution had dried, the sheet of paper was sealed inside an acetate document protector (Fig. 2).
MITCHELL
Experimental
Area and Methods
‘rhe data
collection was carried out during lattrr June and early July 1970 at the International Biological Program (IHP) Grasslands I&me Pawnee Site, which is located on the Central Plains Experimental Kange about 30 miles northeast of Fort Collins, Colorado. This area is a short- grass plains dominated by blue grama (Bouteloun gmcilir (H.B.K.) Lag.) and buffalo grass (l7uchl0e dac1yloidies (Nutt.) Engelm.). Mean precipitation is about 12 inches per year, mmt of which ucc~~rs in the spring, bummer, and early fall. .I more complete aitc description has been given by Klipple and Custello (196”).The pasture from which the samples were taken had been excluded from cattle grxing since the previous year. There was, however, evidence of light grazing by small mammals and phytophagus insects. This utilization tended to be non- uniform, apparently due to the presence of plains prickly pear (Opuntia polyacantha Haw.) which precluded the har- vest of forage Cram areas up to 2 m in diameter.
Forty-five random samples were collected during the last week in June and the first two weeks in July of 1970. The procedure followed during any given sampling period was as follows: The 8 x IO-inch acetate sheet containing the strontium”~ source was taped to an interior side of an open- topped cardboard box dimensioned 10.1 inches long x 10.1 inches wide x 9 inches high. Along the top edge of the box opposite to the side to which the source was taped, three equidistantly-spaced, circular notches were cut out (Fig. 2). These notches served as portholes for the end-windowed G-M tube during the sampling process. The data were collected by turning the box upside down and placing it over the quadrar to be sampled. The cardboard box thereby served four functions: (I) it held the source sheet perpendicular to the ground and out of the wind; (2) since it was inverted for use, the box’s bottom helped to
compresr
the taller forbs and grasses such as slimflower scurfpea (Ps’somlpa tenuiflora Pursh) and red threeawn (Aristida longireta Stead.) down into the attenuation field: (3) it defined the plot size. Although the box covered slightly more than 1/16th square meter, all biomass data were aubscqucntly corrected to a squarr~meter basis in the analyses. (4) Finally, the notched box was used to nssure that tbc G-11 tube was kept in the same relati\c positiou to rbr source for rach sample. therebyAfter taping the source to the inside of the box and having drtermincd a sampling location, the box would be placed inverted OVCI the plot and four 1%pnny nails pushed into the soil at each corner. Three 60.second counts were then taken with the end window of the G-M tube even with each of rhe pre-rut notches and approximately one fourth inch above the soil surface (Fig. 3). Finally, the box was removed, hravy twine run around the four nails to redefine the qua& rat. and the plot clipped of all live and dead aboveground rcgetation. ‘l’hr clipped material was later oven-dried at .5X Both wet weights (i.e., field weight immediately after clipping) and oven-dry weights were rccordcd. In addition to the biomass data. the dominant species occurring on the quadrat were also noted.
When the beta source was not being used in the field, safety regulations required that it bc secured in a locked cabinet marked with the standard U.S..A.E.C. warning sym- bol for radioactivity. About three to four hours were re- quired to take ten samples, including selection of the quads rat location, counting, clipping, determining the wet herb- age weight, returning to the on-site laboratory (1 mile), placing the samples in an oven, and weighing the oven-dried samples. An insignificantly small amount of this time was taken up in the counting phase, which is all that would nor- mally be required if the technique were an established method and already ralibratrd for the particular site.
R.ZSUltS
Eight regression models, with herbage biomass
comprising the dependent variable and beta activity
in counts per minute
the independent
variable,
wxe postulated for analysis with the data collected.
According to Tare
et al. (1966) the activity or at-
tenuated count rate is exponentially
related to ab-
sorber thickness; therefore, one-half of the models
tested the null hypothesis after activity rates had
been transformed by taking their natural logarithm.
The effect of taking three counts vs. taking one
count (middle notch considered
only) per sample
was also tested, with the reasoning that the mean of
three readings would ,pive a more integrated mea-
sure of the true densay of obviously nonuniform
quadrats.
Each of the above count-rate information
xts were correlated to both wet and oven-dry forage
n-eights, thereby giving eight regression models in
all.
Preliminary
analyses consistently
were insignifi-
cant with coefficients
of determination
below 0.6.
Much of the error was due to data from plots domi-
nated by plains prickly pear.
Consequently,
all
quadrats dominated
by plains prickly pear were
omitted from the analyses, leaving a sample size of
35. With the reduced sample, coefficients
of deter-
mination ranged from 0.90 to 0.94.
BETA-ATTENUATION
303
Table 2. Results of four regression equations predicting herbage standing crop (Y) on a wet-weight basis from attenuated beta radioactivity rates (X) on a shortgrass prairie. X, is defined as the activity rate at the middle notch.
A. Y = 296.7 - .040X, r2 = .916
S.S. df M.S. F
Kegression 60055.5 1 60055.5 360.4
Error 5499.6 33 166.6
Total 65555.1 34
B. Y = 300.9 - .044(X, + X2 + X,).333 r2 = .932
S.S. df M.S.
Regression 61082.5 1 61082.5 45Fo.7
Error 4472.6 33 135.5
Total 65555.1 34
C. Y = 1769.6- 197.18(1n X2) r2 = .916
S.S. df M.S. F
Regression 60061.6 1 60061.6 360.8
Error 5493.5 33 166.5
Total 65555.1 34
D. Y = 1811.3 - 203.66(ln(X, + X2 + X,).333) r2 = .940
S.S. df M.S. F
Kegression 61619.6 1 61619.6 516.7
Error 3935.5 33 119.3
Total 65555.1 34
and the logarithmic
transformation
added slightly
to the significance
of the regression.
In all cases
the attenuated
beta activity was a slightly better
predictor of herbage wet weight than dry weight.
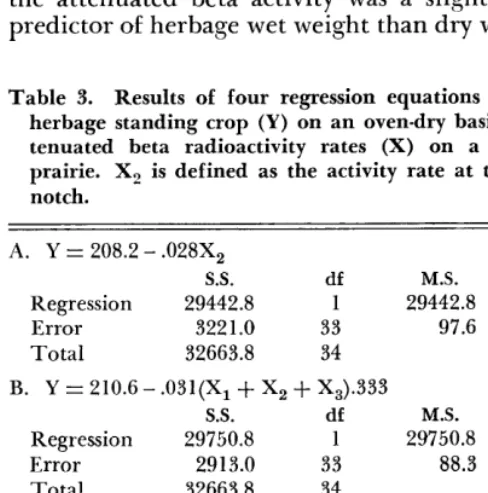
Table 3. Results of four regression equations predicting herbage standing crop (Y) on an oven-dry basis from at- tenuated beta radioactivity rates (X) on a shortgrass prairie. X, is defined as the activity rate at the middle notch.
A. Y = 208.2 - .028X, r2 = .901
S.S. df M.S. F
Regression 29442.8 1 29442.8 301.6
Error 3221.0 33 97.6
Total 32663.8 34
B. Y = 210.6 - .031(X, + X2 + X,).333 r2= .911
S.S. df M.S. F
Regression 29750.8 1 29750.8 337.0
Error 2913.0 33 88.3
Total 32663.8 34
C. Y = 1242.6- 138.43(1n X2) r2 = .906
S.S. df M.S.
Regression 29603.6 1 29603.6 3lt.2
Error 3060.2 33 92.7
Total 32663.8 34
D. Y = 1267.6 - 142.47(ln(X, + X2 + X,).333) x-2 = .923
S.S. df M.S. F
Regression 30153.0 1 30153.0 396.3
Error 2510.8 33 76.1
Total 32663.8 34
1
I I I I I I0 I 2 3 4 5 6 7
Activity (counts per minute x 103)
FIG. 4. Relationship between beta activity and herbage biomass (wet weight) using only one count per sample.
The real significance
of the statistics,
in the
author’s opinion, lies not in the comparisons among
different models, but rather in the high predicta-
bility of each of these regressions in determining
herbage biomass with such a low cost and relatively
unsophisticated
first-pass experiment.
Discussion and Conclusions
When the data variables
were plotted against
each other it was apparent that the greatest vari-
ation was at the high end of the X-axis, i.e., high
count rate and low biomass. Thus, it is doubtful
that the beta-attenuation
technique
would have
been useful on a moderate to heavy grazed short-
grass prairie.
However, such a situation is a worst-
possible case.
The roughness of the soil surface also contributed
to the magnitude of the error term. It is not diffi-
cult to imagine the effect of microtopography,
such
as a small hill protruding into the attenuation
field
or herbage growing in the protection of a slight de-
pression, on the goodness of fit. Such an effect is
compounded
on a shortgrass
prairie
where the
microtopographical
variation
can be as great or
greater than the vegetation.
A potential second source of error must be con-
sidered
whenever
radioactivity
rates are being
measured.
All radioactive
emissions are random,
nonuniformly
occurring
events, and any instanta-
neous or momentary
measurement
of them may
only be described in terms of statistical parameters.
The usual manner for circumventing
this source of
error is to record cumulative activity over a reason-
able length of time, which is why 60-second counts
were used as described above.
304
TINGEY
ET AL.
isotope with a minimum of labeling requirements,
waste disposal restrictions,
etc. There
should be
no reason to require more than this amount in set-
ting up the beta attenuation
technique for the mea-
surement of primary production on any rangeland
ecosystem.
It must be emphasized,
however, that
scientists
and range managers
interested
in this
technique who are not experienced
in the handling
of radioisotopes should consult with an appropriate
organization or agency before making any plans on
their own, no matter how minute the quantity of
isotope which is to be used.
The beta-attenuation
procedure is one which has
been largely overlooked
as a research or manage-
ment tool in range resource analysis.
It may es-
pecially be useful in double sampling as the exten-
sive or inexpensive
component
of the method.
Although the requirement
for frequency of calibra-
,
itseems likely that calibration
_ _
._
_
tion was not tested,
may be much less
capacitance
meter.
of: a problem
than with the
physics. 50th -ed.- The Chemical Rubber Co., Cleveland, Ohio.Literature Cited
CHOPPIN, G. R. 1964. Nuclei and radioactivity. W. A. Benjamin, Inc., New York. 150 p.
FLETCHER, J. E., AND M. E. ROBINSON. 1956. A capacitance meter for estimating forage weight. J. Range Manage. 9: 96-97.
KLIPPLE, G. E., AND D. F. COSTELLO. 1960. Vegetation and cattle responses to different intensities of grazing on short- grass ranges of the central Great Plains. U.S. Dep. Agr. Tech. Bull. 1216. 82 p.
PECHANEC, J. F., AND G. D. PICKFORD. 1937. A weight es- timation method for the determination of range or pasture production. Amer. Sot. Agron. J. 29:894-904.
TEAARE, I. D., G. 0. MOTT, AND J. R. EATON. 1966. Beta- attenuation-a technique for estimating forage yield in situ. Radiat. Bot. 6:7-11.
VAN DYNE, G. M., F. M. GLASS, AND P. A. OPSTRUP. 1968. Development and use of capacitance meters to measure standing crop of herbaceous vegetation. ORNL-TM 2247. Oak Ridge Nat. Lab., Oak Ridge, Tenn. 47 p.
WEAST, R. C. [ed.]. 1969. Handbook of chemistry and
Thrips of the Sagebrush-Grass Range
Community in West-Central Utah’
WARD M. TINGEY2, CLIVE D. JORGENSEN, AND NEIL C. FRISCHKNECHT
Research Associate, University of Arizona, Tucson; Associate Professor of Zoology, Brigham Young University, Provo, Utah; and Principal Plant Ecologist, Intermountain Forest and Range Experiment Station, Provo, Utah.
Highlight
Twenty species of thrips (Thysanoptera) were collected from big sagebrush, rubber rabbitbrush, antelope bitterbrush, and crested wheatgrass on west-central Utah sagebrush-grass rangelands. Twelve species of thrips were collected from crested wheatgrass, 10 from rubber rabbitbrush, 10 from big sagebrush, and three from antelope bitterbrush. Three species (Anaphothrips tricolor, Chirothrips
aculeatus and Chirotkrips simplex) were new distribution records for Utah.
Thrips damage was not apparent to any of the host species examined during this study, but Anaphothrips zeae, Aptinothrips rufus, and Frankliniella occi-
dentalis are potential pests of range species and merit further study.
Most attempts to increase the carrying capacity of sagebrush-grass
l This work was supported, in part, by a grant (12-11-204-31) to Brigham Young University from the Inter- mountain Forest and Range Exper- iment Station, Forest Service, U.S. Department of Agriculture. Received July 29, 1971.
2 Specimens were identified by Tokuwo Kono, California Department of Agri- culture. Kellie O’Neill, U.S. Depart- ment of Agriculture, Entomology Re- search Division: and J. G. Watts, New Mexico State University.
ranges have included seeding de- sirable plant species (Stoddard, 1946; Plummer et al., 1955). Little has been done to develop a sound understanding of the interacting systems responsible for maintaining these ranges, although this ap- proach has been recognized by some as being necessary (Humphrey, 1962; Manis, 1967). Since the in- teractions among species need to be studied, it is clear that the niches occupied by insects should be examined.
Insects, aided by their high rate of reproduction, rapid dispersal, and sometimes rapacious appetites are vital members of almost all ter- restrial communities, and may ul- timately determine the fate of some plants in their respective commu- nities. The importance of insects on western North America ranges has been reported by Knowlton (1966), Manis (1967), and Jorgensen and Tingey (1968).