Computational Linguistics and Chinese Language Processing
Vol. 14, No. 4, December 2009, pp. 363-382 363 © The Association for Computational Linguistics and Chinese Language Processing
A Discrete-cepstrum Based Spectrum-envelope
Estimation Scheme and Its Example Application of
Voice Transformation
Hung-Yan Gu
∗and Sung-Feng Tsai
∗Abstract
Approximating a spectral envelope via regularized discrete cepstrum coefficients has been proposed by previous researchers. In this paper, we study two problems encountered in practice when adopting this approach to estimate the spectral envelope. The first is which spectral peaks should be selected, and the second is which frequency axis scaling function should be adopted. After some efforts of trying and experiments, we propose two feasible solution methods for these two problems. Then, we combine these solution methods with the methods for regularizing and computing discrete cepstrum coefficients to form a spectral-envelope estimation scheme. This scheme has been verified, by measuring spectral-envelope approximation error, as being much better than the original scheme. Furthermore, we have applied this scheme to building a system for voice timbre transformation. The performance of this system demonstrates the effectiveness of the proposed spectral-envelope estimation scheme.
Keywords: Spectral Envelope, Discrete Cepstrum, Harmonic-plus-noise Model, Voice Timbre Transformation.
1.
Introduction
Here, a spectral envelope means a magnitude-spectrum envelope. Various methods have been proposed to estimate the spectral envelope of a speech frame. For example, in LPC (linear prediction coding) based methods (O’Shaughnessy, 2000; Schwarz & Rodet, 1999), the frequency response of an all-pole model is used to approximate the spectral envelope of a speech frame. Nevertheless, the frequency response curve of an LPC all-pole model will usually go below the true envelope around speech formants, and go above the regions where
∗ Department of Computer Science and Information Engineering, National Taiwan University of
364 Hung-Yan Gu and Sung-Feng Tsai
spectrum magnitudes fall suddenly. This is illustrated in Figure 1 using a frame sliced from an utterance of /i/. Therefore, the mismatches between the LPC envelope curve and the true curve cannot be ignored.
cepstrum-smoothed envelope LPC envelope
Hz dB
deep mismatch
Figure 1. LPC and cepstrum smoothed spectral curves for a frame from /i/.
A Discrete-cepstrum Based Spectrum-envelope Estimation Scheme and Its 369 Example Application of Voice Transformation
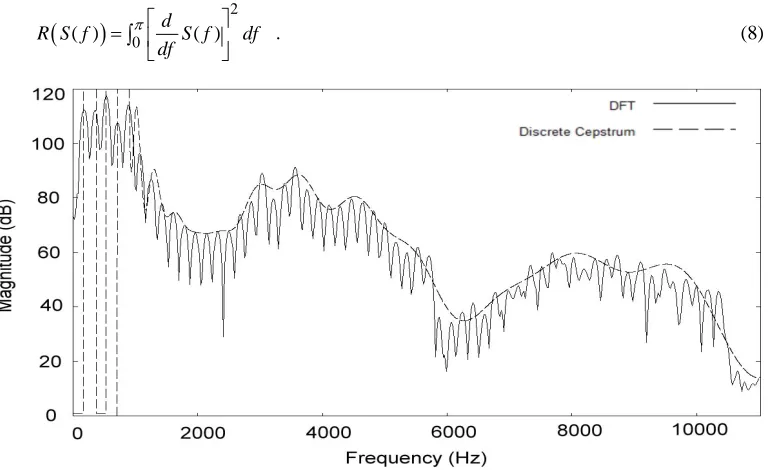
According to empirical experience, the parameter λ is better set to a value around 0.0001. Thereafter, the ill-conditioning problem can be solved, and a regularized spectral envelope curve will be obtained. An example of a regularized spectral envelope is the dash-lined curve in Figure 4, where the solid-lined curve is the same as the one in Figure 3. Apparently, the phenomenon of radical vibration is not seen in this figure. Note that frequency axis scaling (to be discussed in Section 4.2) is already applied in addition to regularization to obtain the spectral envelope in Figure 4.
Figure 4. A spectral envelope computed with 40 regularized discrete cepstrum coefficients.
3.
Selection of Spectral Peaks
Note that the discrete cepstrum coefficients are obtained by minimizing the squared errors between the selected spectral peaks, ak, k=1, 2, …, L, and S(f). Therefore, selecting appropriate spectral peaks from a DFT spectrum is an important preprocessing step. The simplest selection method, i.e. locating and selecting all the spectral peaks on the spectrum as the final selected peaks, leads to the approximated spectral envelope being very bad and having a large approximation error. When such bad spectral envelopes are used to transform voice signals, the output obtained will suffer significant voice-quality degradation.
370 Hung-Yan Gu and Sung-Feng Tsai
unvoiced. If it is detected to be voiced, the frame is further searched for the MVF value, fv, through the searching method proposed by Stylianou (1996). According to fv, the DFT spectrum of the frame is split into the lower-frequency harmonic part and the higher-frequency noise part. Then, for the harmonic part, the first spectral peak of a frequency within the range (0.5×F0, 1.5×F0), where F0 is the detected fundamental frequency, is searched for. Let the
obtained frequency and amplitude be f1 and a1. Next, the second spectral peak of a frequency
within the range (f1+0.5×F0, f1+1.5×F0) is searched for, and the results will be the frequency f2
and amplitude a2. When going on in this manner, we can find the frequencies and amplitudes
of the other spectral peaks within the harmonic part. Sometimes, it may occur that no spectral peak is found within a designated frequency range. In this situation, we will right shift the frequency range, i.e. adding 0.5×F0, and try to find again.
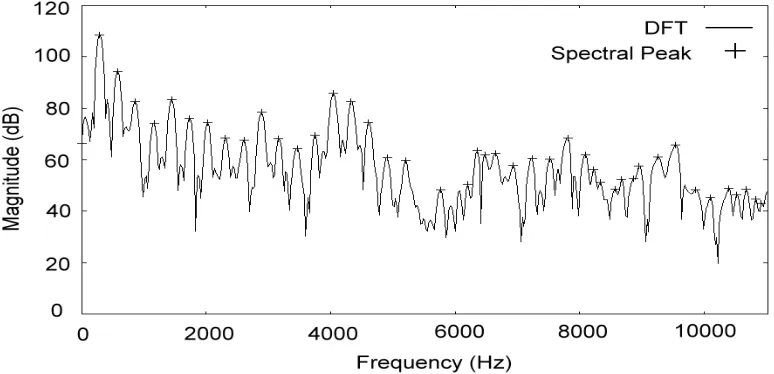
For the noise part of a voiced frame, we think the searching method explained above for the harmonic part cannot be adopted. Note that the harmonic structure becomes obscure in the noise part, and the frequency gaps between adjacent peaks become randomly varied. As an example, inspect the DFT spectrum curve beyond 5,800Hz in Figure 4. Therefore, we adopt another method to find the spectral peaks for the noise part. In this method, a smooth spectral curve is obtained first by truncating the real-cepstrum coefficients outside the leading 30 ones, and transforming (via DFT) the resulting real-cepstrum sequence back to the spectrum domain. Then, each spectral speak within the noise part is located and its amplitude is checked. It will be selected if its amplitude is higher than the height of the smooth spectral curve at the peak’s frequency. As for an unvoiced frame, the method just explained can still be applied. This is because such a frame’s MVF can be directly set to 0Hz and its spectrum can be viewed as all in the noise part. When applying the spectral peak selection method explained above, we may obtain a typical result shown in Figure 5. In this figure, each occurrence of plus-sign, +, represents a selected spectral peak.
372 Hung-Yan Gu and Sung-Feng Tsai
4.2
Frequency Axis Scaling
Through use of a larger order number, e.g. 40, the global approximation error of a frame’s spectral envelope can now be controlled. Nevertheless, local approximation errors that are large and cannot be ignored can still be found. For example, the spectral envelope in Figure 7(a) is obtained by approximating with 30 discrete cepstrum coefficients, and it has two significant local approximation errors as circled. If the value of the order number p is increased to 40, the spectral envelope will become the one shown in Figure 7(b). Although the local approximation errors are somewhat reduced, they are still significant and cannot be ignored.
(a) Cepstrum order set to 30 (b) Cepstrum order set to 40
Figure 7. Spectral envelopes approximated in the linear frequency scale.
Consider the local approximation error around 1,000Hz, as seen in Figures 7(a) and 7(b). From the DFT spectrum, it is known that the pitch is low (i.e. it is a male’s pitch) and the frequency gap between two adjacent spectral peaks is small. Under such a situation, the amplitudes of the third and fifth spectral peaks show rapid growth that is higher than the nearby peaks. Such rapid change of spectral envelope is very hard to approximate. To solve this situation, a conventional idea is to nonlinearly scale the frequency axis to enlarge the frequency gaps between low-frequency spectral peaks. Therefore, when a spectral peak of a frequency fk is detected, its frequency value will be scaled to ˆfk according to the formula,
( )
1
= ,
2 (0.5 )
k s k
s
scl f F
ˆf
scl F
× ⋅
× (12)
A Discrete-cepstrum Based Spectrum-envelope Estimation Scheme and Its 373 Example Application of Voice Transformation
withˆfk also implies that the computed discrete cepstrum coefficients must be used in the scaled frequency axis instead of the original axis. That is, for a linear and normalized frequency f, its envelope magnitude, S(f), should be computed by scaling f into ˆf first then taking ˆf into Equation (3).
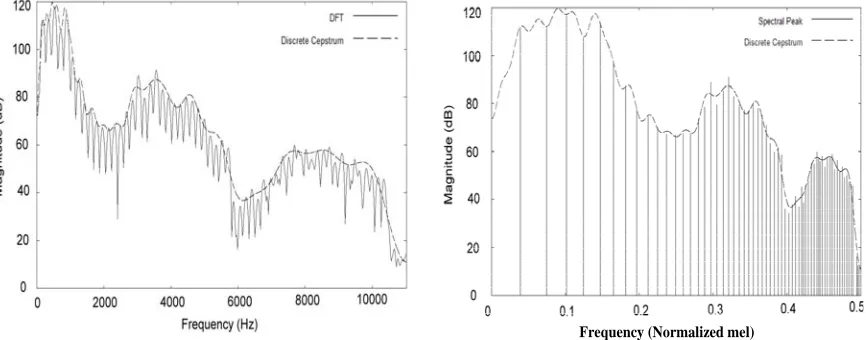
For nonlinear frequency-axis scaling, mel and Bark frequency scales are the most famous (O’Shaughnessy, 2000). If the frequency conversion function, scl(⋅), adopted is a mel-frequency conversion, the spectral envelope shown in Figure 7(b) will be changed to the one shown in Figure 8(a). The major difference is that the lower-frequency spectral peaks in Figure 8(a) are now all passed by the approximated spectral envelope curve. Nevertheless, the local approximation error around 3,000Hz is still noticeable. In addition, the spectral envelope curve in Figure 8(a) shows much stronger vibration near the lower-frequency end than the curve in Figure 7(b). This stronger vibration can be seen in more detail when we redraw the approximated spectral envelope curve with a mel-frequency horizontal axis as shown in Figure 8(b). This phenomenon of over-vibration is thought to be due to the mel-frequency conversion that widens the frequency-scale at the low frequency end. According to the observed stronger vibration for mel-frequency conversion, we think much stronger vibration will occur if we adopt the Bark-frequency conversion for scl(⋅). This is because Bark-frequency conversion will have the frequency-scale at the low frequency end being widened more than that widened by the mel-frequency conversion.
Frequency (Normalized mel)
(a) linear-frequency horizontal axis (b) mel-frequency horizontal axis
Figure 8. Spectral envelopes approximated in mel-frequency scale.
374 Hung-Yan Gu and Sung-Feng Tsai
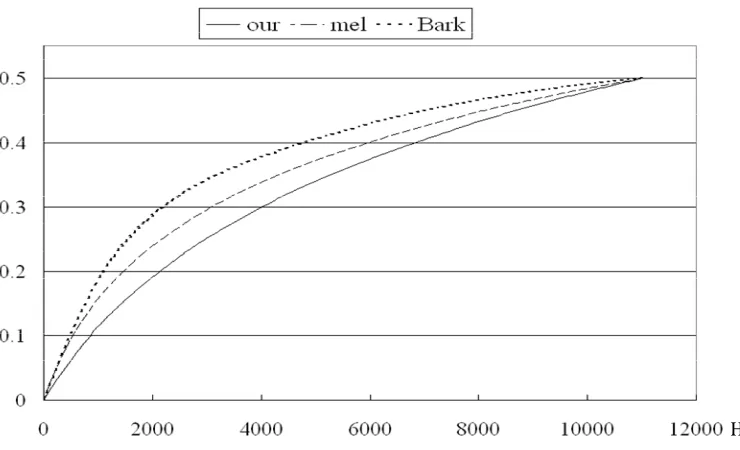
and inspecting the approximated spectral envelope curves, we finally found a better frequency conversion function:
( ) log(1 ) 1,750
f
scl f = + (13)
where f is in the unit Hz. This conversion function will have the scaled frequency value, ˆfk , growing more slowly with fk at the low frequency end when it is used as the scl(⋅) function for Equation (12). The three curves shown in Figure 9 are obtained by taking Bark, mel, and our frequency conversions, respectively, as the scl(⋅) function for Equation (12). From Figure 9, it can be seen that our frequency conversion, as given in Equation (13), can indeed grow the scaled frequency ˆf more slowly with the linear frequency f. Via the frequency conversion function of Equation (13), the approximated spectral envelope in Figure 8(a) will become the one drawn in Figure 4. According to the spectral envelope obtained in Figure 4, it can be said that the frequency conversion function proposed can indeed eliminate the over-vibration phenomenon at the low frequency end, and reduce the local approximation error around 3,000Hz. The reducing of the local approximation error we think is due to the increased vibrating capability around 3,000Hz by using the proposed frequency conversion instead of the mel-frequency conversion.
Hz
A Discrete-cepstrum Based Spectrum-envelope Estimation Scheme and Its 375 Example Application of Voice Transformation
4.3
Approximation Error Comparison
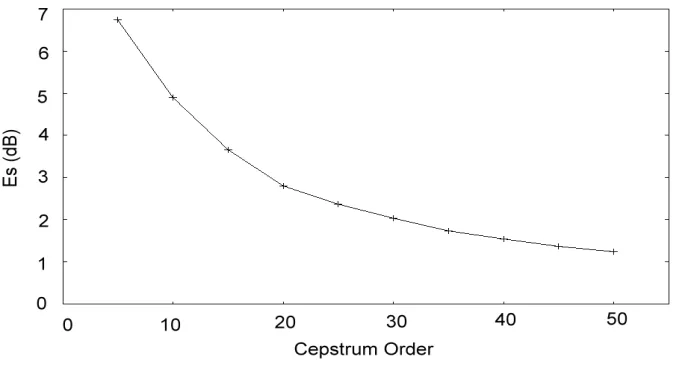
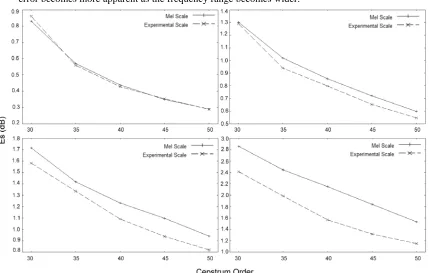
One may ask if our frequency conversion function is only better than mel-frequency conversion for certain signal frames. Therefore, we decided to compare the approximation errors of the two frequency conversions in the four frequency ranges, i.e. 0 ~ 2,000Hz, 0 ~ 4,000Hz, 0 ~ 6,000Hz, and 0 ~ 11,025Hz. Here, the approximation error is still measured by the formula in Equation (11). Nevertheless, the number of spectral peaks, L, is dynamically checked for each frame to ensure that only the spectral peaks of frequencies within the currently concerned frequency range are counted. Here, 375 Mandarin sentences, consisting of 2,925 syllables, as mentioned in Section 4.1 were used as the testing data. After all of the frames of the data are processed, the approximation errors measured in different frequency ranges and different discrete cepstrum orders are illustrated in Figure 10.
Inspecting the error curve in Figure 10, it can be seen that across the cepstrum order-numbers from 30 to 50, our frequency conversion and the mel-frequency conversion have almost same approximation errors in the frequency range, 0 ~ 2,000Hz. Nevertheless, in the other three frequency ranges, our conversion function will apparently obtain smaller approximation errors for different cepstrum-order numbers. This decreasing of approximation error becomes more apparent as the frequency range becomes wider.
A Discrete-cepstrum Based Spectrum-envelope Estimation Scheme and Its 377 Example Application of Voice Transformation
Vo(f). If this spectral envelope is shrunk and the shrinking rate is 0.7, the resulting envelope will be the one drawn in Figure 12(b). Apparently, the formant frequencies, F1, F2, and F3, are all lowered. Let the spectral envelope in Figure 12(b) be denoted by Vs(f). Then, it is simple to derive that Vs(f) = Vo(10
7 f). On the other hand, if the spectral envelope in Figure 12(a) is extended and the extending rate is 10/7, the resulting envelope will be the one drawn in Figure 12(c). Apparently, the formant frequencies, F1, F2, and F3, are all raised. Let the spectral envelope in Figure 12(c) be denoted with Ve(f). Then, it can be derived that Ve(f) = Vo( 7
10f).
(a) original envelope (b) shrunk envelope (c) extended envelope
Figure 12. The scaling of an example spectral envelope.
5.2
Pitch Shifting
After a frame’s spectral envelope is shrunk (or extended), we can use Vs(f) (or Ve(f)) to determine a new set of harmonic partials and noise sinusoids. Suppose that the original pitch frequency of the i-th frame is 180Hz and that we intend to tune its pitch to 250Hz. Although the original pitch must be used in the block “spectral envelope estimating” of Figure 11, it is not used for pitch shifting and signal re-synthesizing. This is because we just need Vs(f) (or Ve(f)) to determine the amplitudes of the new harmonic partials and noise sinusoids. For example, the new harmonic structure of a voiced frame may look like the one shown in Figure 13. According to a given MVF, we can place new harmonic partials into the frequency range below MVF, and place new noise sinusoids into the frequency range above MVF.
In detail, the frequencies of the new harmonic partials are set as f1i=250,
2i
f =500,
3
i
f =750, etc. As to their amplitudes, the spectral envelope, Vs(f) (or Ve(f)), is evaluated at the
targeted frequencies. That is, their amplitudes are set to a1i = Vs(250),
2
i
a = Vs(500), a3i =
380 Hung-Yan Gu and Sung-Feng Tsai
Table 1. Perception test results for timbre recognizability.
Timbre
Source voice Original voice Transformed voice
Female Avg. score 4.95 4.85
Std. deviation 0.15 0.23
Male Avg. score 4.73 4.36
Std. deviation 0.45 0.48
The second type of perception test is for evaluating the voice qualities of the source and transformed voices. The same participants were asked what level the quality of a played voice was at. Each participant was requested to give a score between 1 and 5 to indicate the quality level of the played voice. After this type of perception test was conducted, we averaged the scores collected and computed their standard deviation. The results are shown in Table 2. According to the score differences, 0.67 (4.38 – 3.71) and 0.82 (4.00 – 3.18), it can be said that our system will inevitably induce a perceivable degradation of voice quality for the transformed voices no matter whether the source voice is uttered by a female or male. One of the possible reasons is that the pitch frequencies of some frames are wrongly detected, which causes their spectral envelopes to be approximated with noticeable errors.
Table 2. Perception test results for voice quality.
Timbre
Source voice Original voice Transformed voice
Female
Avg. score 4.38 3.71
Std. deviation 0.39 0.53
Male Avg. score 4.00 3.18
Std. deviation 0.74 0.72
6.
Concluding Remarks
A Discrete-cepstrum Based Spectrum-envelope Estimation Scheme and Its 381 Example Application of Voice Transformation
harmonic part and the higher frequency noise part. Then, we find the spectral peaks in the harmonic part according to the detected pitch frequency and screen the spectral peaks in the noise part according to a cepstrum smoothed spectral curve. As to the problem of frequency axis scaling, we found that the spectral envelope approximated via the mel or Bark-frequency conversion still has noticeable local approximation errors. Therefore, after some attempts at scaling-function design, we propose a better frequency conversion function that can reduce the local approximation errors significantly. Then, applying the solutions to the three problems, we construct a spectral envelope estimation scheme.
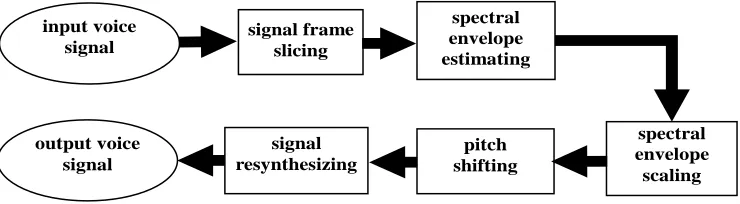
In addition, we built a voice transformation system on the proposed spectral envelope estimation scheme as an example application. This system follows the steps, spectral envelope estimating, spectral envelope scaling, pitch shifting, and signal re-synthesizing, to transform an input voice into an output voice that is of a very different timbre, i.e. the perceived gender and age of the voice can both be changed. To evaluate the performance of this system, we conducted perception tests. The averaged scores from 13 participants show that our system can indeed achieve the function of timbre transformation. In the future, we will apply the proposed spectral envelope estimation scheme to study another kind of voice transformation problem. That is, we will convert the voice of a specific person into the voice of another specific person.
Acknowledgments
This study is supported by National Science Council under the contract number, NSC 98-2221-E-011-116.
References
Cappé, O., & Moulines, E. (1996). Regularization techniques for discrete cepstrum estimation. IEEE Signal Processing Letters, 3(4), 100-102.
Dolson, M. (1986). The phase vocoder: A tutorial. Computer Music Journal, 10(4), 14-27. Galas, T., & Rodet, X. (1990). An improved cepstral method for deconvolution of source filter
systems with discrete spectra: Application to musical sound signals. Proceedings of International Computer Music Conference, Glasgow, Scotland.
Gu, H. Y., Chang, H. F., & Wu, J. H. (2004). A pitch-contour normalization method following Zhao’s pitch scale and its application. Proceedings of ROCLING XVI, Taipei, Taiwan. 325-334. (in Chinese)
Imai, S., & Abe, Y. (1979). Spectral envelope extraction by improved cepstral method. Electron. and Commun. in Japan, 62-A(4), 10-17. (in Japanese)
382 Hung-Yan Gu and Sung-Feng Tsai
instantaneous-frequency-based F0 extraction: possible role of a repetitive structure in sounds. Speech Communication, 27, 187-207.
Kim, H. Y., et al. (1998). Pitch detection with average magnitude difference function using adaptive threshold algorithm for estimating shimmer and jitter. Proceedings of the 20th Annual International Conference of the IEEE Engineering in Medicine and Biology Society, Hong Kong, China.
Moore, F. R. (1990). Elements of computer music. Prentice-Hall, Englewood Cliffs, NJ, U.S.A.
O’Shaughnessy, D. (2000). Speech communications: human and machine, IEEE Press, Piscataway, NJ, U.S.A.
Robel, A., & Rodet, X. (2005). Efficient spectral envelope estimation and its application to pitch shifting and envelope preservation. Proceedings of International Conference on Digital Audio Effects, Madrid, Spain.
Schwarz, D., & Rodet, X. (1999). Spectral envelope estimation and representation for sound analysis-synthesis. Proceedings of International Computer Music Conference, Beijing, China.
Shiga, Y., & King, S. (2004). Estimating detailed spectral envelopes using articulatory clustering. Proceedings of International Conference on Spoken Language Processing (ICSLP2004), Jeju, Korea.
Stylianou, Y. (1996). Harmonic plus noise models for speech, combined with statistical methods, for speech and speaker modification, Ph.D. thesis, Ecole Nationale Supèrieure des Télécommunications, Paris, France.
Stylianou, Y. (2005). Modeling speech based on harmonic plus noise models. in Nonlinear Speech Modeling and Applications, eds. Chollet, G., et al., Springer-Verlag, Berlin, Germany.