3156
Ubiquitous Parameter Anthology For Energy In
Wireless Sensor Network: A Statistical Analysis
Nazir Ahmad, Zaki Ahmad khan, Hatim M. Elhassan Ibrahim Dafallaa, Mohammed Burhanur Rehman, Iqrar Ahmad
Abstract: In this paper, statistical and machine learning tools are used to reduce the variety of parameters by analyzing the dependency between these parameters and the average energy consumption of a specific application, permitting very appropriate kinds to be chosen. The few techniques are used for correlation analysis, namely Pearson correlation, Spearman correlation; Lasso regularization as well as P-value are used for statistical analysis and suggested a model. Afterward, the random forest regression is applied to evaluate the exactness of prediction for each original and even decreased parameter in estimating the average energy consumption of the wireless sensor network.
Keywords: Energy Consumption; Wireless Sensor Network; Correlation; Regration; P-Value
————————————————————
I.
INTRODUCTION
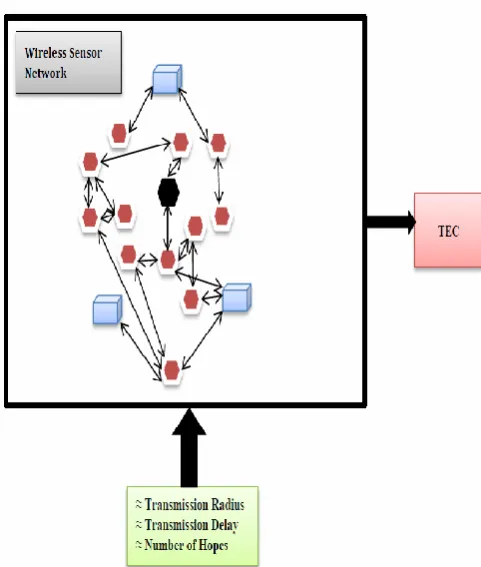
In the last decade, wireless sensor networks (WSN) have captivated a lot of attention in many aspects. Additionally, they have a groovy likely to transform countless areas of our existence. The networking of sensors draws on the truth that sensors are greatest if they are integrated into enormous amounts, distinctively for gathering environmental map of a geographical area like a complete building, an agricultural field, or a rainforest [1], [2] [3]. When the sensors are employed in applications they could no more be available for additional physical manipulation, for instance, mounting defective elements or perhaps altering batteries [4],[5] [6]. Consequently, it gets to be vital that you handle their energy consumption to improve their life span and the overall performance of the sensor-based application [7], [8]. Obviously, to reduce the energy consumption of wireless sensor networks, a lot of interrelated aspects have to be regarded; the method of sensors interconnection, networking protocols, transmission mechanisms, topology, sensing mechanisms and routing play the crucial part in the total energy consumption of a WSN system. All these components tend to be internally relevant in an elaborate network resulting in high intricacy for network optimization [9], [10] [11]. The idea of WSN is presented as a parametric system with numerous configuration parameters Fig. 1. However, allotting suitable values through these design parameters can increase the performance of the network and reduce total energy consumption. To exemplary of our discussion, it is impossible to obtain any specific rehearse on research that effect of such configuration parameters on total energy consumption of WSN. The method proposed within this paper is our endeavor to analysis the dependency between total energy consumption and wireless network system configuration parameters and even extorted valuable parameters on energy consumption consider in our
demonstration application [12], [13]. Succinctly, our efforts within this paper are twofold: the statistical analysis, impact of configuration parameters on the total energy consumption in wireless network systems as well as extorted best configuration parameters on total energy consumption. The rest of the paper is organized as follows: we present our previous energy driven architecture in section II. Section III describes our statistical analysis to extract parameters in Energy Consumption (EC) of WSNs. In section IV model generations with random forest regression is presented. The statistical analysis results are discussed in section V. Finally, section VI concludes the paper.
2.
ENERGY
DRIVEN
ARCHITECTURE
IN
WIRELESS SENSOR NETWORK
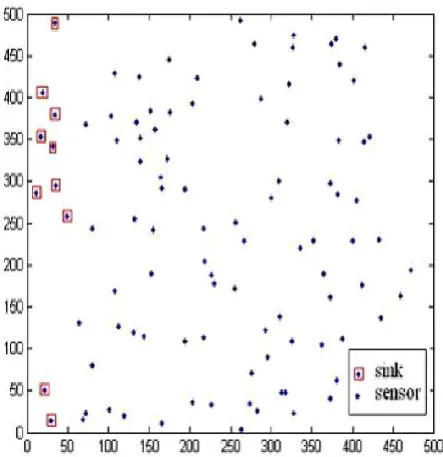
The vast majority of the existing research that targets a single facet of wireless sensor networks but in our previous work, we suggested energy driven architecture is to combat the trouble from a unique perspective by concentrating on energy constituents of a whole sensor network application. An energy constituent shows a significant energy-consuming thing that could be related to several possible tasks. Ultimately, these types of tasks need to be mapped to energy ingested behavior which has to be exercised by sensors besides other components for example sensors antennas, transceivers, and central processing units [14]. This view of total energy consumption in wireless sensor networks can be applied to optimizing and balancing energy consumption and increasing the network lifetime. The simulation outcomes for lifetime and residual energy of a sample network with various sensor radiuses, transmission radius and random and selective techniques exhibited in Fig. 1 and Fig. 2.
Figure 1. Avg. No. of neighbours for diverse transmission radius & network size
____________________________
Nazir Ahmad* Dept. of information system Community College, King Khalid University Muhayel, Kingdom of Saudi Arabia
Zaki Ahmad khan Dept. of Computer science Nanjing agricultural University Nanjing, China [email protected]
Hatim M. Elhassan Ibrahim Dafallaa Dept. of information system Community College, King Khalid University Muhayel, Kingdom of Saudi Arabia [email protected]
Mohammed Burhanur Rehman Dept. of information system Community College, King Khalid University Muhayel, Kingdom of Saudi Arabia [email protected]
Iqrar Ahmad Dept. of information system Community College, King Khalid University Muhayel, Kingdom of Saudi Arabia
Figure 2. Randomly deployed sensors and sinks in Application
Instead of our earlier energy driven architecture, we introduce a single overall model and also suggest a tolerable composition convey the total energy consumption of a wireless sensor network application with regards to the energy constituents. The composition provides a tangible illustration for analyzing the overall performance of a wireless sensor network application, optimizing the constituents operations as well as designing extra energy-efficient applications. The supreme purpose is to generate energy guide architecture of a wireless sensor network application that makes up vital and definable energy constituents along with the relationships between these types of constituents to ensure that one can possibly check out approaches for reducing the total energy consumption of the application. Our architecture targets energy constituents instead of network layers or perhaps physical components. Significantly, it permits the classification and mapping of energy-consuming entities in a wireless sensor network application to energy constituents of the architecture.
3.
STATISTICAL
ANALYSIS
PARAMETER
FOR
TOTAL
ENERGY
CONSUMPTION
IN
WNS
The wireless sensor network is an intricate system because of the spatial-temporal characters in each condition of the sensors as well as their communication in the network. It is vitally improbable that a clear dependency between WSN parameters and average energy consumption could be positioned through scatter graph. Essentially, scatter graphs are extremely boisterous and also filled with outliers, creating an identification of dependency tougher. Consequently, a variety of statistical tools is needed to instantly acquire a lot of the relationships; these kinds of tools ought to be flexible for boisterous and outliers along with handle diverse forms of relationship, for instance, linear, convex, exponential, logarithmic, and so on. The P-value and correlation evaluation are the commonest techniques in statistics for analysis of dependency between a couple of arbitrary variables and in machine learning for characteristic choice. Since the pattern of relationship on a scatter graphrelationship between parameter as well as energy consumption is an ascending /sinking function and The Lasso regression: used as one more regular method to examine dependency between the parameter and energy consumption, particularly when the relationship between the parameter and energy cannot be symbolized by above the stated functions. Later this investigation, the potency of every parameter is confirmed by P-value analysis and its actual correlation values. When both of them examine reveal a higher dependency between average energy consumption along with the parameter then it is chosen as ubiquitous parameter for more study; elsewhere, it will be eradicated. It ought to be mentioned that eliminating a parameter depending on the above relationship tests does not suggest any relationship at all; in reality, there can be a few other kinds of relationship that are concealed in the scatter graph and may be identified with intricate functions. The total energy consumption and other configuration parameters are depicted in Fig. 3.
A. Pearson Correlation Analysis
By definition, linear correlation (Pearson correlation) [15] is a measure of dependency between two variable sequences on a scale from −1 to 1. In WSNs, if 𝑷𝟏= 𝑝11,𝑝12,…,𝑝1𝑀 and 𝑬= 𝐸1,𝐸2,…,𝐸𝑀 are values of the first parameter (e.g., transmission radius) and corresponding average energy consumption, respectively, the normalized linear correlation function between these two series can be expressed as follows:
Where Mp1 and ME are indicated of P1 and E range and the correlation value of 0 implies an arbitrary or unbiased relationship between the parameter and average energy consumption, along with the correlation values of 1 and −1 indicate positive and also negative ideal linear connections between them, respectively.
B. Spearman Correlation Analysis
The Spearman correlation evaluates the monotonic relationship between couples of stable or perhaps ordinal variables. In WSN, the monotonic relationship calculates the level of association between a parameter as well as average energy consumption having no supposition concerning the syndication of data. It evaluates just how nicely the relationship between a couple of cans be explained employing a monotonic function that is referred to as an ascending or even descending function. To estimate this correlation, the trials in P1and E ought to individually be positioned from tiniest to biggest. Then, the Spearman correlation is defined in [16].
3158 Wherein pjk is the chosen value for the j
th
parameter in the kth investigate and 𝜆 is a regularization parameter. It really is well worth noting that Lasso regression between normalized parameters as well as average energy consumption means that parameters resembling greater value coefficients get extra influence on energy.
D. P-Value
In statistics, a P-value is a numerical measure of the probability that the null hypothesis is true thereby implies the statistical relevance of a relationship. In our research, the null hypothesis is the fact that a parameter does not have any impact on average energy consumption in relation to one of the metrics for example that there are no Pearson correlation between a particular parameter (PL) as well as the average energy consumption (E) along with the P-value is a measure of precisely how probably it is that we might be able to possess become our sample data when the null hypothesis is true. By convention, P-value is less than and equal to 0:05 suggest that the null hypothesis can be declined such as PL and E are highly correlated; consequently, the relationship between PL and E is statistically significant.
4.
MODEL
GENERATIONS
WITH
RANDOM
FOREST REGRESSION
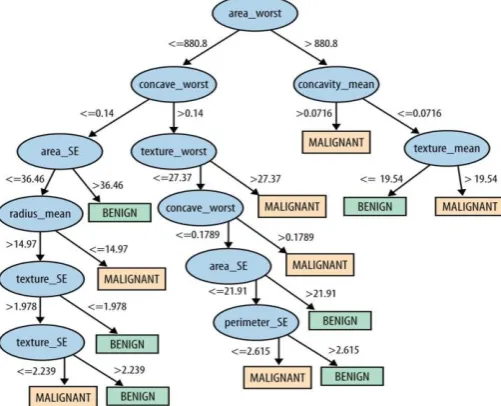
This segment explains exactly how the association between parameters as well as average energy consumption in wireless sensor network was modeled. The random forests are a sort of ensemble learning technique wherein numerous determination trees are designed at training time; generates of those trees are then joined on a test data set as an illustration method of classes for category as well as mean prophecy for regression. Because every tree uses a tiny part of the parameters, random forest regression is strong to over-fitting. The initial step would be to know how a decision tree is compatible with regression [17]. In a regression tree, the purpose is usually to forecast truly valued figures at the leaf nodes, as demonstrated in Fig. 4 for a tree of five features/parameters. Because the goal variable such as average energy consumption is an actually valued number, a regression model was equipped from every parameter for example transmission radius to the assailant variable for every parameter, the data was split at many separate points as an example tree nodes accompanied by estimation of sum of squared error at every node between the expected values of the assailant variable and also its real values. For a node, the variable with minimal Sum of Squared Error was chosen. This technique was recursively continued until the entire training data was covered.
Figure 3. The Total Energy Consumption (TEC) & Wireless Configuration Parameters
5. RESULT AND DISCUSSION
In global constituent, the correlation analysis between average energy consumption and parameters is summarized in Table I. The largest value of correlation in every row is highlighted by bold numbers between the average energy consumption and parameter. The outcomes indicate that the links between energy consumption and parameters are tough to clarify by just one kind of correlation as an illustration, besides network size, that has its largest value in Pearson correlation, the relaxation of the relationships could be described by Spearman correlation. From Table I, it is well worth mentioning the following:
The receive cost referred to as the energy a sensors receiver uses to get a packet, which is instantly associated with the sensors radio. Undoubtedly, a greater receive cost signifies larger energy consumption.
Network size signifies the assortment of sensors inside the investigate. When sensors are provided a set preliminary energy, the total energy of the network increases with the size of the network. The absolute value of drank energy will even boost the size of the network because much more sensors indicate a lot more involvement thereby more energy consumption.
TABLE I. P-VALUE, PEARSON AND SPEARMAN CORRELATION ANALYSIS BETWEEN WSN PARAMETERS AND OVERALL ENERGY
CONSUMPTION. THE BOLD ITEMS SHOW THE MOST EFFECTIVE PARAMETERS BASED ON P-VALUE ANALYSIS Parameter P.C S. C P-value L. R
Number of Sinks
-0.159
-0.018 0.029 1
Network Size 0.401 0.46 5.98e-10
1
Receive Cost 0.555 0.531 1.5e-11 1 Transmission
Cost
0.769 -0.0655
0.655 0.89
Transmission Radius
0.49 0.52 1.096e-10
0.545
Transmission Delay
0.014 0.176 0.021 1
The appropriate lower bound for P-value and correlation coefficient to recognize a link as statistically considerable relies on the application. Generally, a correlation value greater than 0:5 with P-Value? 0:05 is known as a formidable dependency. In our application, we reduced the pawn tag for correlation to 0:35 although maintaining the identical lower bound for pValue; consequently for a particular parameter, in case no less than one of its correlation coefficients with average energy consumption exceeds 0:45 with pValue? 0:05, we have been assured to term it as a widespread parameter. Consequently, almost all parameters except transmission cost, transmission delay as well as variety of sinks, demonstrated with gray rows in Table I and also cut out from notably modeling. A nearer check out the scatter graphs of the omitted parameters shows that the deviation in average energy consumption has no structural relationship with variations in values of those parameters. A knowledgeable presume to clarify this outcome usually, the important relationships are extremely intricate to be spelled out with our group of correlations, or perhaps that the level of noise is excessive for identification of the utilized correlations. In terms of the previous works a tiny group of relationship tests is inspected in our work such as linear and Spearman correlations but many other variations of relationships stay for example polynomial, greater degree, exponential, logarithmic etc. This applies especially to the relationship between the number of sinks and average energy consumption. The subconscious points to a recognized trouble in modeling of intricate systems that has been well-studied in the machine learning domain. This concern can never be resolved by utilizing intricate relations and also signifies the requirement for a pre-processing phase to tidy data and reduce noise. Checking out the related graphs insures the large noisiness of each transmission cost as well as transmission delay plots, top us to render a knowledgeable presume that noise is behind the low correlation coefficients between both of these parameters and average energy consumption.
Figure 4. Decision tree based on the Wisconsin Breast Cancer dataset [17]
In order to figure out simply how much precision is shed when you remove non-relevant parameters, random forest regression was used to model energy consumption as soon as with all of the parameters which having only common parameters. The variety of trees in each model was twenty and each model’s employed Mean Square Error to gauge the excellence of a split. Almost all parameters were regarded to find the ideal split. The regression employed bootstrap to sample data for training of every tree, for instance, random sampling with replacement. The Fig. 5 demonstrates the assessment between predicted energy consumption as a result of those models and real energy consumption.
Figure 4. The prediction of random forest regression models compared with actual energy consumption with all
parameters
The data signifies generally that eliminating transmission delay and variety of sinks in the modeling possesses a minimal effect on prediction accuracy, thereby facilitates ignoring both of these parameters. The better perception of execution of those statistical tools and random forest regression.
3160 employed tools were: P-value, Pearson, Spearman and
Lasso regularisation. After parameter reduction, random forest regression was employed on examine the precision of prediction for each unique and decreased parameters in estimating global energy consumption of the network. The critiques on 1000 simulated tests revealed that the variety of sinks and also transmission delay possess a small effect on global energy consumption when compared with the additional six parameters. Moreover, it mentioned that our random forest regression model can predict exact data with excellent precision thereby can be utilized as an approximation of a network in further study such as optimize energy pertaining to values of the parameters.
REFERENCES
[1] V. Raghunathan, C. Schurgers, S. Park, and M. B. Srivastava, "Energy Aware Wireless Microsensor Networks," IEEE Signal Processing Magazine, vol. 19, pp. 40-50, 2002.
[2] J. N. Al-Karaki, and A. E. Kamal, "Routing techniques in wireless sensor networks: a survey," IEEE Transaction on wireless communications, vol. 11, pp. 6-28, 2004. [3] N. B. Rizvandi, J. Taheri, and A. Y. Zomaya, "Some
observations on optimal frequency selection in DVFS-based energy consumption minimization," Journal of Parallel and Distributed Computing, vol. 71, pp. 1154-1164, 2011.
[4] N. B. Rizvandi, J. Taheri, R. Moraveji, and A. Y. Zomaya, "On Modelling and Prediction of Total CPU Usage for Applications in MapReduce Environments," presented at the 12th International Conference on Algorithms and Architectures for Parallel Processing (ICA3PP), Fukuoka, Japan, 2012.
[5] N. B. Rizvandi, J. Taheri, and A. Y.Zomaya, "On using pattern matching algorithms in MapReduce applications," presented at the 9th IEEE International Symposium on Parallel and Distributed Processing with Applications (ISPA), Busan, South Korea, 2011. [6] S. A. Billings and Q. M. Zhu, "Nonlinear model
validation using correlation tests," International Journal of Control, vol. 60, pp. 1107-1120, 1994.
[7] K. Z. Mao and S. A. Billings, "Multi-directional model validity tests for non-linear system identification,"
International Journal of Control, vol. 73, pp. 132-143, 2000.
[8] M. E. Houle, "Can shared-neighbour distances defeat the curse of dimensionality?," International Conference on Scientific and Statistical Database Management. Springer Berlin Heidelberg, 2010.
[9] A. Atla, R. Tada, V. Sheng, and N. Singireddy, ―Sensitivity of different machine learning algorithms to noise,‖ Journal of Computing Sciences in Colleges, vol. 26, no. 5, pp. 96-103, 2011.
[10] J. M. Dilbert and F. Balouchi, ―Comparison of Energy Harvesting Systems for Wireless Sensor Networks,‖ International Journal of Automation and Computing, vol.5, no. 4, pp. 334-347, 2008.
[11] M. Sinaie, A. Zappone, E. A. Jorswieck, and P. Azmi, ― A novel Power Consumption Model for Effective Energy Efficiency in Wireless Networks,‖ IEEE Wireless Communications Letters, Vol. 5, no.2, pp. 152-155, 2016.
[12] S. Chen, F. Qin, B. Hu, H. Li, and Z. Chen, ―User Centric Ultra-Dense Network for 5G: Challenges, Methodologies, and Directions,‖ IEEE Wireless Communications Letters, pp. 78-85, 2016.
[13] Z. A. Eu, H. P. Tan, and W. K. G. Seah, ―Design and performance analysis of MAC schemes for wireless sensor networks powered by ambient energy harvesting,‖ International Journal of Ad Hoc Network, vol. 9, no. 3, pp.300–323, 2011.
[14] D. N. K. Jayakody, Z. A. Khan, Rodrigo, C. d. Lamare, J.Thompson, ―A Novel Energy-Driven Architecture for Wireless Sensor Networks", Journal of Physic, Conf. Series, (International Conference on Information Technologies in Business and Industry), vol. 803, Tomsk, Russia, Sept 21st-23rd, 2016.
[15] T. F. R. HASTIE, and J. FRIEDMAN, ―The Elements of Statistical Learning: Data Mining, Inference, and Prediction,‖ Springer.
[16] D. A. K. ZWILLINGER, ―CRC Standard Probability and Statistics Tables and Formulae,‖ New York, Chapman & Hall.
[17] T. F. F. PROVOST, ―Data Science for Business: What you need to know about data mining and data-analytic