IJEDR1402063
International Journal of Engineering Development and Research (www.ijedr.org)1657
Optimal Placement & Control Modeling of Unified
Power Flow Controller Using Voltage Stability Index
and α-β Transformation Theory for Multi-Machine
Power System
1
Rishabh Shah,
2Sarafraz Gandhi
1 P.G.Student, 2 Asst. Professor 1 Dept. of Electrical Engineering,1 Parul Institute of Engineering and Technology, Vadodara, India
1 [email protected], 2 [email protected]
________________________________________________________________________________________________________
Abstract—The Unified Power Flow Controller (UPFC) is the most versatile and complex power electronic FACTS device that has emerged for the control and optimization of power flow in electrical power transmission system. In this study, Unified Power Flow Controller (UPFC) is designed and simulated by α-β transformation theory. Here the transformation of a three phase system (abc) to the 2-axis system (α-β) is done through which power profile can be controlled individually, while also regulating the local bus voltage. In this paper 3 machine 9 bus standard (WSCC) system is considered for implementation and analysis of unified power flow controller for different loading conditions. This paper also presents an optimal placement analysis of UPFC to determine the location and operating parameters for improving voltage profile in a power system. The location of UPFC is placed based on Voltage Stability Index (VSI) or L-index method for different loading conditions. All Simulations are done using Matlab/ Simulink12a and results obtained shows the effectiveness of the controller in improving the power profile and voltage profile of the system.
Index Terms—UPFC, power flow control, α-β Theory, Voltage Stability Index, Optimal placement, L-index method ________________________________________________________________________________________________________
I.INTRODUCTION
In Modern complex power system, better power quality is necessary to fulfil the increased demand. Due to the advanced technologies being used for improving power system security, reliability and profitability the power quality is need to be improved. For this it is essential to improve the stability and power profile of the transmission network. Because of new transmission line networks and power stations, variety of loads and transformers the problem of system operation as well as the voltage collapse occurs in power system when system is faulted, heavily loaded and there is a sudden increase in the demand of reactive power. When voltage fluctuations are there the system is unable to meet the reactive power demand and the loading of long transmission lines increased which causes voltage instability & reactive power imbalance in power system.
With the invention of semiconductor device like thyristor switch the door for the development of power electronics devices known as Flexible AC Transmission Systems (FACTS) controllers opened. FACTS device are power electronic based semiconductor device which can inject or absorb reactive power in a system as per requirement and one of the most important reactive power sources. Unified Power Flow Controller (UPFC) is a 3rd generation FACTS device.
This paper investigates the α-β control theory for the UPFC in order to improve the power & voltage profile of the power system in different loading conditions.
This paper also presents the method of the optimal location of UPFC for enhancing the voltage stability of the power system using Voltage Stability Index (VSI) or L-index method. The UPFC has been tested on the 9-Bus test System and the solution for optimal location of this device will obtain and discuss in this paper.
II.UNIFIED POWER FLOW CONTROLLER
IJEDR1402063
International Journal of Engineering Development and Research (www.ijedr.org)1658
Fig. 1 Basic structure of UPFCIt can control power system parameters such as terminal voltage, line impedance and phase angle. Therefore, it can be used not only for power flow control, but also for power system stabilizing control. Unified power flow controllers are capable of directing real and reactive power flows through a designed route and regulating the system voltage through reactive power compensation.
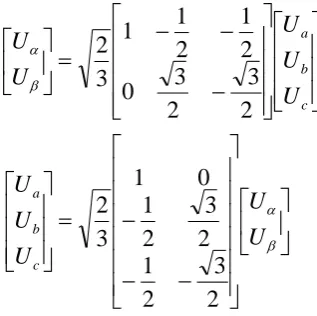
III.INSTANTANEOUS REACTIVE POWER THEORY
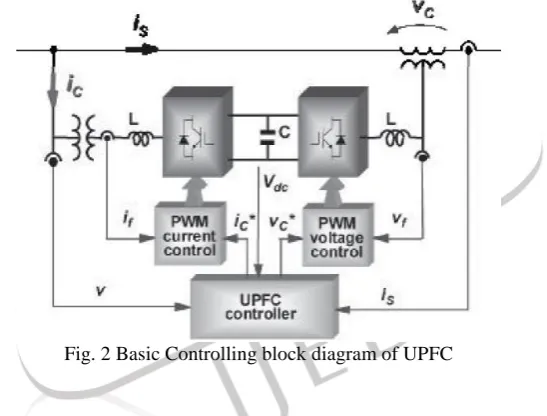
The instantaneous reactive power theory is also known as α-β or Clark transformation theory. The Basic Controlling block diagram of UPFC using α-β theory is shown in fig. 2. This α-β axis control system enables the UPFC to follow the changes in reference values like AC voltage, DC link voltage, real and reactive powers through the line, load current . By implementing α-β axis controller it is possible to produce a relatively fast response and to reduce the interaction between real and reactive power flow.
Fig. 2 Basic Controlling block diagram of UPFC
Modeling of shunt VSC
The Basic Controlling block diagram of shunt VSC using α-β axis controller is shown in fig. 3.
Fig. 3 Basic Controlling block diagram of shunt VSC
IJEDR1402063
International Journal of Engineering Development and Research (www.ijedr.org)1659
…. Eq. 1…. Eq. 2
Here instantaneous aggregate voltage calculation is given by Eq. 3 and current reference calculation is given by Eq.4.
…. Eq. 3
…. Eq. 4
Here DC voltage reference and source voltage reference is given for generating error value which is controlled by PI controller as shown in fig. 3.
Modeling of series VSC
The Basic Controlling block diagram of series VSC using α-β axis controller is shown in fig. 4.Here power calculation is given by Eq. 5 & voltage reference calculation is given by Eq. 6.
Fig. 4 Basic Controlling block diagram of series VSC
…. Eq. 5
…. Eq. 6
Here power profile reference is given for generating error value from controlled bus which is controlled by PI controller as shown in fig. 4.
c b aU
U
U
U
U
2
3
2
3
0
2
1
2
1
1
3
2
U
U
U
U
U
c b a2
3
2
1
2
3
2
1
0
1
3
2
2 2 V
V
V
IJEDR1402063
International Journal of Engineering Development and Research (www.ijedr.org)1660
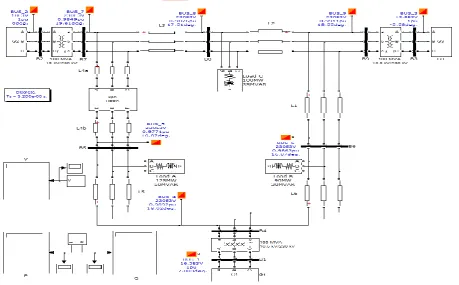
IV.SIMULATION OF 3-MACHINE 9-BUS STANDARD (WSCC)SYSTEMThe Basic Controlling block diagram of this system is shown in fig. 5. & the system parameters are specified in [2].
Fig. 5 Basic Controlling Block Diagram of 3-Machine 9-Bus Standard (WSCC) System
The MATLAB simulation circuit of 3-Machine 9-Bus Standard (WSCC) System is shown in Fig. 6. The simulation results are shown in results and comparisons.
Fig. 6 MATLAB simulation of 3-Machine 9-Bus Standard (WSCC) System
V.SIMULATION OF UNIFIED POWER FLOW CONTROLLER
IJEDR1402063
International Journal of Engineering Development and Research (www.ijedr.org)1661
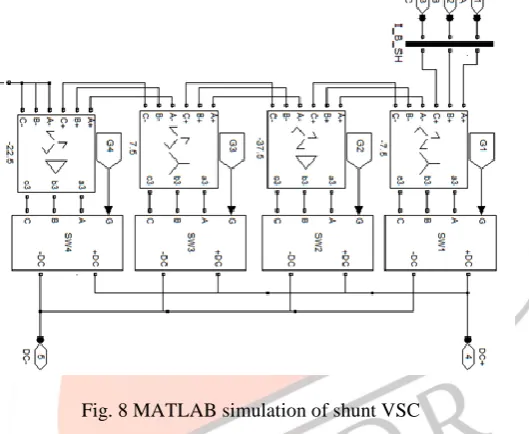
Fig. 7 MATLAB simulation of UPFCHere both shunt and series VSCs are simulated by 24-puls converter, comprising 4 set of 6-pulse converter with 4 set of Zig-Zeg transformer for achieving phase difference of 15° in each set.
Fig. 8 MATLAB simulation of shunt VSC
This will generate ±7.5° phase sifted wave forms, combining which compensating voltage and current can be generated. Fig. 8 shows simulation of shunt VSC and Fig. 9 shows simulation of series VSC. The details of modeling circuits are specified in [1].
IJEDR1402063
International Journal of Engineering Development and Research (www.ijedr.org)1662
FACTS devices, which are power electronic based devices can change parameters like impedance, voltage and phase angle. They also helps to reduce flows in heavily loaded lines, resulting in an increased loadability, low system loss, improved stability of the network, reduced cost of production and fulfilled contractual requirement by controlling the power flows in the network. For this it should be properly installed in the system with appropriate parameter setting.Voltage stability is becoming an increasing source of concern in secure operating of present-day power systems. The problem of voltage instability is mainly considered as the inability of the network to meet the load demand imposed in terms of inadequate reactive power support or active power transmission capability or both. It is mainly concerned with the analysis and the enhancement of steady state voltage stability based on L-index. This L-Index [3] determines how any system is close to its instability limit.
The equation for the stability index can be written as, [3]
…. Eq. 7 Where L = stability index
For stable system, L<1
It can be seen that when a load bus approaches a steady state voltage collapse situation, the L-index approaches the numerical value 1.0. Hence for an overall system voltage stability condition, the index evaluated at any of the buses must be less than unity. Thus the index value L gives an indication of how far the system is from voltage collapse [3].
Following table shows the L-index calculation for the 3-Machine 9-Bus Standard (WSCC) System.
Table No. 1 L-index calculation
Line P (PU) Q (PU) V (PU) L-Index
1 0.52 0.0701 0.991 0.021796
2 0.3249 0.1402 0.991 0.01713
3 0.6421 0.0238 0.985 0.024826
4 0.8361 0.122 0.985 0.035772
5 0.3595 0.2034 0.989 0.021193
6 0.3564 0.0384 0.989 0.014777
By considering the Voltage stability index (L-Index) value, it is observed that line 7-5 is more sensitive towards system security. Therefore it is more suitable location for UPFC at bus 5 to improve power system security/stability. After placement of UPFC voltage stability is improved, the analyses of voltage magnitudes for WSCC 9 bus test system without and with UPFC is shown in result and analysis.
Fig. 10 shows the simulation of implementation of unified power flow controller on WSCC9 bus system.
Fig. 10 Implementation of unified power flow controller on WSCC9 bus system
2 2.) .
(
4
s s
u p
V
XQ
RP
V
IJEDR1402063
International Journal of Engineering Development and Research (www.ijedr.org)1663
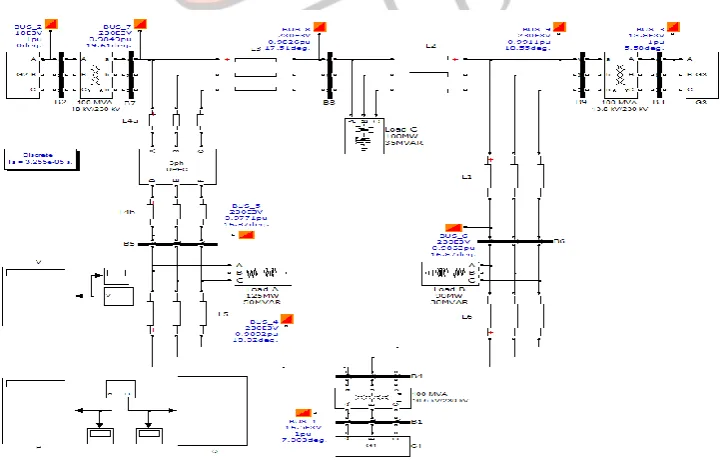
VII.RESULTS&ANALYSISHere all analysis is done for different loading condition on 92%, 100%, 108% and 116% with L-index analysis in every case. For 92% of loading condition with L-index of 0.031424 for L4, power profile in Fig. 11 and voltage profile in Fig. 12 with and without UPFC are shown below.
Fig. 11 Power Profile on 92% loading
Fig. 12 Voltage profile on 92% loading
For 100% of loading condition with L-index of 0.035772 for L4, power profile in Fig. 13 and voltage profile in Fig. 14 with and without UPFC are shown below.
Fig. 13 Power Profile on 100% loading -50
0 50 100 150 200
4 5 6 7 8 9
p
o
we
r
p
ro
fi
le
BUS
P (MW) WITHOUT P (MW) WITH
Q(MVAR) WITHOUT Q(MVAR) WITH
0.92 0.94 0.96 0.98 1 1.02 1.04 1.06 1.08 1.1
4 5 6 7 8 9
V (
PU
)
BUS
V(PU) WITHOUT V(PU) WITH
-50 0 50 100 150 200
4 5 6 7 8 9
Pow
e
r Pr
o
fi
le
BUS
P (MW) WITHOUT P (MW) WITH
IJEDR1402063
International Journal of Engineering Development and Research (www.ijedr.org)1664
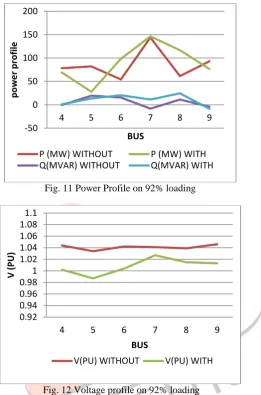
Fig. 14 Voltage Profile on 100% loadingFor 108% of loading condition with L-index of 0.039998 for L4, power profile in Fig. 15 and voltage profile in Fig. 16 with and without UPFC are shown below.
Fig. 15 Power Profile on 108% loading
Fig. 16 Voltage Profile on 108% loading
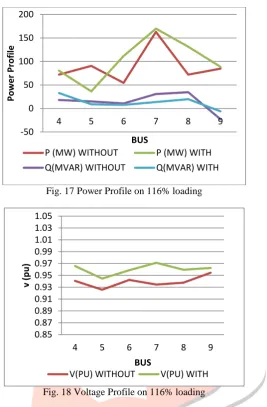
For 116% of loading condition with L-index of 0.0438623 for L4, power profile in Fig. 17 and voltage profile in Fig. 18 with and without UPFC are shown below.
0.95 0.96 0.97 0.98 0.99 1 1.01 1.02 1.03 1.04 1.05
4 5 6 7 8 9
V (PU
)
BUS
V(PU) WITHOUT V(PU) WITH
-50 0 50 100 150 200
4 5 6 7 8 9
Pow
e
r Pr
o
fi
le
BUS
P (MW) WITHOUT P (MW) WITH
Q(MVAR) WITHOUT Q(MVAR) WITH
0.89 0.91 0.93 0.95 0.97 0.99 1.01 1.03 1.05
4 5 6 7 8 9
V (
PU
)
BUS
IJEDR1402063
International Journal of Engineering Development and Research (www.ijedr.org)1665
Fig. 17 Power Profile on 116% loadingFig. 18 Voltage Profile on 116% loading
Here Fig. [11- 18] shows the effect of UPFC on WSCC 9 bus system with different loading conditions.
Results shows that in 92% of loading the voltage profile rise above 1 PU and after implementation of UPFC it is averaged near 1 PU. In the same case the power profile is also corrected which shows the regulation of power flow done by UPFC.
The same results are found in case of 100% loading conditions where considerable improvement in both active and reactive power is found.
In both 108% and 116% of loading conditions the voltage profile are considerably below 1 PU. After implementation of UPFC it is shown that it is improved in both cases with UPFC in comparison of without UPFC. The power profile is improved in both case at buses and it is showing the overall regulation of both voltage and power flow.
VIII.CONCLUSIONS
A UPFC is able to quickly control the flow of real and reactive power in a transmission line. In this paper, the instantaneous reactive power theory or α-β axis theory is presented and performance of the UPFC connected to a transmission line under different loading conditions is studied through simulation. By implementing a α-β axis theory to the both converters of UPFC, it is possible to produce relatively fast response and to reduce the interaction between real and reactive power flow. The α-β control system can contribute not only to achieve fast power flow control but also improvement of stabilizing the transmission systems. In this paper, a method for optimal placement and parameters settings of UPFC has been analyzed for improving voltage profile in a power system. Simulations performed on the test system shows that the optimally placed UPFC maintains the voltage profile, improve the stability and effectively increases the efficiency of power system.
IX.REFERENCES
[1] Akagi, Edson Hirokazu Watanabe, Mauricio Aredes, “Instantaneous power theory and application to power conditioning" IEEE press, john wiley & sons publication, ISBN 978047010614, 2007.
[2] Swaroop Nallagalva, Mukesh Kumar Kirar, Dr.Ganga Agnihotri, “Transient Stability Analysis of the IEEE 9-Bus Electric Power System”, International Journal of Scientific Engineering and Technology, Volume No.1, Issue No.3, ISSN : 2277-1581.
[3] S. B. Bhaladhare, P.P. Bedekar, “Enhancement of Voltage Stability through Optimal Location of SVC”, International Journal of Electronics and Computer Science Engineering, ISSN- 2277-1956
-50 0 50 100 150 200
4 5 6 7 8 9
Pow
e
r Pr
o
fi
le
BUS
P (MW) WITHOUT P (MW) WITH
Q(MVAR) WITHOUT Q(MVAR) WITH
0.85 0.87 0.89 0.91 0.93 0.95 0.97 0.99 1.01 1.03 1.05
4 5 6 7 8 9
v (
p
u
)
BUS