Available Online at www.ijcsmc.com
International Journal of Computer Science and Mobile Computing
A Monthly Journal of Computer Science and Information Technology
ISSN 2320–088X
IMPACT FACTOR: 6.017IJCSMC, Vol. 7, Issue. 11, November 2018, pg.216 – 230
An Efficient Compressive Sensing Data
Gathering Using Modified Ant Colony
and Diffusion Wavelets in WSN
M. Deepika1, A.Finny Belwin2, A.Linda Sherin3, Dr. Antony Selvadoss Thanamani4
¹Research Scholar Department of Computer Science & Bharathiar University, India ²Research Scholar Department of Computer Science & Bharathiar University, India 3
Research Scholar Department of Computer Science & Bharathiar University, India 4
Professor and Head Department of Computer Science, NGM College, Pollachi, India 1
[email protected]; 2 [email protected]; 3 [email protected]; 4 [email protected]
Abstract— Compressive sensing (CS) depend on data gathering is a promising method to reduce energy consumption in wireless sensor networks (WSNs). The existing CS-based data-gathering approaches require a large number of sensor nodes to participate in each CS measurement task, resulting in high energy consumption, and do not guarantee load balance. The propose a sparser analysis that depends on modified diffusion wavelets, which exploit sensor readings’ spatial correlation in WSNs. In particular, a novel data-gathering scheme with combine routing and CS is present. A modified ant colony algorithm-based diffusion wavelets (ACBDW), where next hop node selection takes a node’s residual energy and path length into consideration simultaneously. Moreover, in order to quickness up the coverage rate and avoid the local optimal of the algorithm, an improved pheromone impact factor is put forward. The diffusion wavelets based on sensor nodes’ degree and different nodes’ distance considering the above factors are proposed. To further reduce the transport costs in WSNs, a sparse measurement matrix is utilized and modified ant colony routing are jointly applied to mitigate energy consumption and balance the network load, especially lowering the transmission costs for those nodes nearest the sink node. The experimental result show data-gathering approaches, this proposed algorithm not only minimizes the energy consumption of the network, but prolongs the network lifetime.
Keywords— Compressive Sensing, Data Gathering, Modified Diffusion Wavelets, Ant Colony Algorithm Spatial Property
I. INTRODUCTION
II. RELATED WORK
For the problems of random selection and unbalanced position of projection nodes, this paper proposes a compressed data gathering method based on even projection. For the WSN with uniformly distributed nodes, a location-based even clustering method is proposed. The clustering is implemented with the same size of the grids, which ensures the positional balance of the projected nodes. For the WSN with uneven distributed nodes, a node density-based even clustering method is proposed. The DEC method, taking into account the factors of location and density, reduces the energy consumption at isolated points, equalizes the energy, and extends the network lifetime. Moreover, the analysis and simulation of the relevant parameters affecting the network energy consumption were analyzed. Compared with the random projection node method and the random walk method, the proposed method performs well and the network lifetime is significantly extended. In the next step, we will consider the application of artificial intelligence to further optimize the routing topology of the network and make more in-depth research on signal reconstruction to obtain better compressed data collection results. The data gathering method by combining the Compressive Data Gathering (CDG) presented with sparse random projection presented to reduce further the overall number of transmissions and most importantly to distribute the energy consumption load more evenly throughout the network to increase the lifetime of wireless sensor network. Our method (the Minimum Spanning Tree Projection (MSTP)), same as selects different nodes at random to do projection. Where in each projection node after collecting the native data from set of nodes sends the projected data to the sink. But MSTP unlike uses CDG for each projection node to collect and gathers one weighted sum by constructing independent forwarding tree which ensures fewer transmissions. The data gathering is able to reduce global scale communication cost without introducing intensive computation or complicated transmission control. The load balancing essential is capable of extending the lifetime of the entire sensor network as well as individual sensors.
Understanding of recovering a given sparse signal with sparse random matrices in the presence of channel fading. More specifically, we provide lower bounds on the number of measurements that should be collected by the fusion center in order to achieve non uniform recovery guarantees with l1 norm minimization-based recovery with independent (not necessarily identical) fading channels. With sparse random projections, the nodes transmit their observations with a certain probability[3]. We further discuss how to design probabilities of transmissions by each node (equivalently the sparsity parameter of the random projection matrix) based on the channel fading statistics so that the number of measurements required for signal recovery at the fusion center is minimized. consider a similar problem of WCS. A distributed compressive sensing arrangement for WSNs in order
to reduce computational complexity and the communication cost. It considers an sparse
analyze the total power consumption of the network versus number of clusters. Both common positions of the BS are considered: the BS at the center and outside the sensing area. Based on that, we can obtain the optimal number of clusters that provides the minimum power consumption for our networks. The energy-efficient data collection in wireless sensor networks (WSNs) that is based on an integration of the clustering and compressive sensing (CS). It is well known that natural signals have spatial correlation and therefore the sensor readings in a WSN are sparse in a proper basis such as DCT or wavelet. Cluster-based routing strategy has several advantages such as conserving communication bandwidth, stabilizing the network topology and reducing the rate of energy consumption. The major factors influencing the energy consumption of the clustering scheme are the number of clusters and the distribution of cluster heads.[5] Optimizing the number of clusters in WSN has been addressed by many researchers. But these methods are based on conventional in-network compression and/or non-compression data gathering. Weighted Compressive Data gathering (WCDA)”, which benefits from the advantage of the sparse random measurement matrix to reduce the energy consumption. The novelty of the WCDA algorithm lies in the power control capacity in sensor nodes to form energy efficient routing trees with focus on the load-balancing issue. In the second part, we present another new data aggregation method namely “Cluster-based Weighted Compressive Data Aggregation (CWCDA)” to make a significant reduction in the energy consumption in our WSN model. The main idea after this algorithm is to apply the WCDA algorithm to each cluster in order to reduce significantly the number of involved sensor nodes during each CS measurement. Hierarchical Data Aggregation method using Compressive Sensing (HDACS) is presented, which combines a hierarchical network configuration with CS[6]. Our key idea is to set multiple compression thresholds modified based on cluster sizes at different levels of the data aggregation tree to optimize the amount of data transmitted.
III.PROPOSEDMETHODOLOGY
Wireless Sensor Networks (WSNs) generally consist of a large number of sensor nodes and a sink node deployed in the detected environment to monitor various physical characteristics of the real world, such as temperature, voltage, wind direction, and so on. Furthermore, WSNs should have a long enough lifetime to successfully fulfill the monitoring task. However, sensor nodes are limited in terms of computational ability, communication bandwidth, and energy availability.[7] The intuition behind CDG is that higher efficiency can be achieved if correlated sensor readings are transmitted jointly rather than separately. Showing how sensor readings are incorporate while being relayed along a chain-type topology to the sink. In practice, sensors usually increase in a two-dimensional area, and the ensemble of routing paths presents a tree structure. Routing protocol in which the sink has four children. Each of them leads a sub tree defined by the dotted lines. Data gathering and reconstruction of CDG are performed on the sub tree basis.
The main contributions of this propose system are:
The spatial correlation property of a sensor node leads to inherent data sparsity in
some areas, such as wavelet domain and DCT domain.
In order to solve the sparsity of such signals, compressive sensing (CS) is exploited as
a novel signal-processing paradigm that provides an efficient compressive method and recovers sparse or compressible signals.
Spatial property of sensor node readings is exploited to strengthen the performance of
The spatial correlations of sensor node readings to further promote the efficiency of the data-gathering algorithm.
A. Network Model
WSNs where N sensor nodes are randomly deployed in a square area. The system model is
represented by a connected graph , where the vertex set V denotes the nodes in the
networks, and the edge set E denotes the wireless links between the different nodes[8]. Node i can communicate with node j if they are involved in the communication range. It assumes that the single hop distance di j between node i and node j can be represented as a Euclidean distance. At a sampling instant, each sensor node i takes a measurement xi; the goal of the data gathering in WSNs is to collect sufficient information to reconstruct the N-dimensional
signal . When the distance between transmission node i and receive node, j is
greater than d0, the multi-path fading model is utilized. When the distance is less than d0, the free-space model is adopted.
where and describe the energy consumption of transporting and receiving the L
bit data packet. denotes the power expended to run the transmitter or receiver circuitry of
the sensor node[9]. and represent energy consumption for a multi-path fading
amplifier and free-space amplifier, respectively.
B. Modified Diffusion Wavelet
To make full use of the spatial correlation property, it takes diffusion wavelets as the sparse basis considering the spatial correlation of sensor node readings in WSNs. One is the nodes degree, and the other is the distance between the different sensor nodes. In addition, an improved QR decomposition of Givens transform is introduced to set up the sparse basis[10]. To construct the modified diffusion wavelets in detail. However, diffusion wavelets are affected significantly by the diffusion operator, which is equivalent to the wavelet function of a discrete wavelet transform. Diffusion is utilized as a smoothing and scaling technique to enable multi-scale and coarse-grained application.
Step 1: Suppose that denotes a graph with N sensor nodes deployed in the monitoring
Step 2: Calculate the weight adjacency matrix of , which is denoted as is
the weight of the edge in the graph[11]. Here consider two different cases of weight. The sensor node degree is chosen as the weight in the first scheme, while the is taken into consideration to exploit the spatial correlation features, aiming to mitigate the load of WSNs in another scheme. In the former case, a graph and corresponding weight adjacency matrix.
where r is the maximum distance among the sensor nodes that can directly communicate by a
single hop. is the Euclidean separation between node i and node j. is a negative number,
while is a small positive number.
Step 3: Generate a normalized Laplacian matrix of . In that is the degree of
correlations among different function values provided at the vertices of the graph . In
the first schedule, denote using Equation (8), while the other schedule considering spatial
correlation implements Equation (9). Generally speaking, an eigen value or eigenvector shows the special correlations at some scale. It needs to split the space of if it decomposes
the signal sampled of the in a multi-scale.
Step 4: However, the diffusion operator O stems from , where O shares the same
eigenvalues as (less than 1). The diffusion operator is O = ; in this propose, it
choose the first expression.
the initial space of O be , which is represented by scale space and wavelet space
. Wavelet space is different between and . Then, it derives Equation (10):
accomplish the modified QR decomposition, where indicates the column space of matrix
O denoted by basis at scale b, and row space is denoted by basis at scale a, represents
basis denoted on the basis .
Step 6: In the end, the diffusion wavelet basis is the concatenation of the scale functions
and wavelet functions.
C. Modified Ant Colony Routing
In order to decrease the whole network transmission load and prolong the network lifetime, we provide a modified ant colony routing algorithm, where to speed up the convergence rate and avoid local optimal of the algorithm, pheromone impact factor is improved[12]. Here, we select the energy consumption model. The traditional ant colony optimization algorithm selects the next hop depending on Equation (11)
where denotes the pheromone information on edge (i, j), while is the heuristic
information on edge (i, j). and are impact factors demonstrating the importance degree of
the pheromone information and heuristic information. In order to speed up the convergence rate and avoid local optimal, impact factor V is modified as in Equation (12):
where m is a small positive constant ; and refer to current iterations and
iterations increases. In other words, the proportion of pheromones will diminish when the number of iterations rises.
Furthermore, to yield optimal routing by the ant colony algorithm, in this subsection, a sensor node’s residual energy and path length are taken into consideration simultaneously. So, the fitness value of each routing is presented as follows:
where indicates the average residual energy, while represents the node minimal
energy of ants passing through the path. denotes the reciprocal of path length for
given th ant and it siterations. and are constants, and . Consequently, the
path with the largest fitness function value is chosen as the optimal routing, thus balancing the network load and prolonging the network lifetime.
D. Compressive Data Gathering
WSNs are utilized for gathering physical signal from the real world in practical applications. Without using CS theory, which is the simplest method, a data-gathering scheme with the help of the tree topology. In order to dramatically decrease communication costs and prolong the network lifetime, the authors of consider that the sink node receives only M packets instead of N packets of original data from the whole network. In the end, at the sink, CS theory is used to reconstruct the original data. For the CDG algorithm, each node in the WSN multiplies its readings using the corresponding j column vector of basis matrix
. Next, the sensor node adds them to its own readings after receiving all same-size vectors
from descendent nodes and transmitting the final results to its parent node with M
packets[13]. Let us illustrate the product of CDG, where F is matrix, and each column
corresponds to one weight sum. In the plain CS, all nodes in WSNs transmit M packets and each has equal transmission costs; therefore, each CS measurement cost remains relatively high. An example of the plain CS mechanism. It is obvious that for these approaches (non-CS and plain CS), the former transmits fewer packets compared with plain CS from the point of view of child nodes. Provides the hybrid CS method, where non-CS is chosen when the number of packets is less than or equal to M; alternatively, plain CS is used.
Firstly, randomly choose M projection nodes in the network with probability , which
follows. In the CS theory, the sink node needs M measurements to reconstruct the original data. Therefore, these M projection nodes will be selected as the gathering node, defined as , to collect one random measurement , and transmit to the sink node. Then,
distribute non-zero elements in each row of measurement matrix as uniformly as possible
to guarantee the sparse features of the measurement matrix; the number of non-zero elements
in each row should equal to , which is related to Algorithm 3’s step 1. Additionally, each
column of measurement matrix represents a sensor node, so if a column of the matrix has full zero elements, the data from its special sensor node should be thrown away. , the column
vector of measurement matrix is required to store each sensor node memory in advance.
Based on the MST algorithm, access all candidate sensor nodes of a given projection node. In the first stage, the projection node is considered one root node tree[14]. In the step 4
initialization stage in Algorithm 3, is assigned by i, and the temporary variable temp also
yields i. Then steps 5–12 use the MST algorithm to construct the tree, adding the candidate nodes step by step. If temp is not empty, step 6 deletes the top node of the temp queue and
puts its neighbor node in the Tree and temp. The next step is to delete them from if they
belong to . Note that these candidate nodes must be directly connected to the parent node
by a single hop[15]. If there are still some candidate nodes not involved in the tree, the Dijkstra algorithm is proposed, aiming to find the shortest path from the residual nodes to the tree (steps 14–19), and we add the residual candidate nodes.
Finally, this loop of 13–26 lines will repeat until is empty. The modified ant colony
routing technique is utilized to transmit packets of projection nodes to the sink node, namely step 27 of Algorithm 3. Consequently, Algorithm 3 terminates by generating the optimal routing between the projection nodes and the sink node, and an M routing tree from the projection nodes to their own candidate nodes[16]. Our novel algorithm (Algorithm 3) is shown in more detail. The modified ant colony algorithm jointly considers the sensor node’s residual energy and the path length, which will not only balance the whole network load, avoiding nodes near the sink node dying earlier, but will prolong the network lifetime. In this way, the transmission costs should be greatly decreased compared to hybrid CS.
E. Algorithm Implementation
Algorithm 1: Modified diffusion wavelets.
Input: the number of sensor nodes N, communication radius r, decomposition level ,
Output: sparse basis .
1 generate a graph
2 compute weight adjacency matrix according to the vertex degree/Equation (7)
3 calculate normalized Laplacian matrix L relying on Equation (8)/Equation (9) 4 generate diffusion operator
5 recursively raising to power 2
5.1 for
5.2
5.3
5.4
5.5 end for
6 concatenation of the scale functions and wavelet functions is regarded as the sparse basis Y. MQR Function:
Input: sparse matrix,
Output: Q, R matrix, possibly sparse, such that
(1) Q is orthogonal
(2) R is upper triangular up to a permutation
(3) The columns of Q -span the space spanned by the columns of B
Algorithm 2: Modified ant colony algorithm.
Input: the number of sensor nodes N, the power expended to run the transmitter or receiver
circuitry of sensor node , energy consumption of multi-path fading amplifier , energy
consumption of free-space amplifier , distance threshold d0, impact factors of pheromone
information , impact factors of heuristic information is a small positive constant ,
pheromone information on edge , heuristic information on edge and are
constants[17].
Output: optimal routing .
2 calculate distance of different nodes,
3 while maximum iterations have not been reached 4 for
5 computes according to the node communication radius.
6 generate transition probability based on Equations (11) and (12)
7 choose the next hop node, relying on , modify routing and
8 the destination node or not? If not, go back to step 2, or proceed to step 9
9 update the node residual energy based on Equations (5) and (6), routing depending on Equation (13)
10 end for 11 end while
12 return the optimal routing .
Algorithm 3:Proposed algorithm. Input:
Output:
1 randomly select M sensor nodes in the network probability , generate F
2 for
3 query candidate nodes of projection nodes
4 initializations
5
6
7 if is i’s candidate node
8
9
10
11 end if 12 end while 13
15 find a shortest path to using the Dijkstra algorithm
16 if
17
18 end if 19 end for 20
21
22
23 while !empty(temp) do 24 go back to steps 7–11 25 end while
26 end while
27 Optimal routing from i to the sink node using Algorithm 2
28 return
29 end for
Algorithm 4: Sensor signal reconstruction.
1 Input: received data X, measurement matrix , the number of atom is
2 Output: reconstruct data
3 generate sparse basis using Algorithm 1
4 collect data in the network using Algorithm 3
5
6 initialization residual error
7 computes , select the largest la values from ; these values correspond to
column indexes j, constructing set
8
9
10 updates
12 reconstruct , which is the generation value of the last iteration .
IV.RESULT AND DISCUSSION
To evaluate the performance of our scheme by experiments. Ii evaluate our scheme mainly in terms of the sparse basis comparison; the reconstruction performance of the novel mechanism; the reconstruction error for different schemes; the energy consumption based on non-CS, plain CS, hybrid CS and our proposed algorithm (sparse basis is based on distance); and network lifetime performance between the different schemes and our algorithms[19]. In
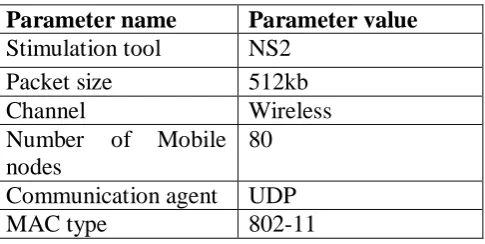
our simulations, all programs have been run in the NS2 platform. Moreover, ,
, , , initial energy .
Table 1. Type Styles
Table 1. Simulation Parameters
NS2: The Network Simulator (ns2) is a discrete event driven simulator developed at UC Berkeley. We are using Network Simulator NS2 for simulations of protocols[18]. It provides considerable support for simulation of TCP, routing and multicast protocols over wired and wireless networks. Ns-2 code is written either in C++ and OTCL and is kept in a separate file that is executed by OTCL interpreter, thus generating an output file for NAM (Network animator). It then plots the nodes in a position defined by the code script and exhibits the output of the nodes communicating with each other.
Fig1. Comparison of no of round vs total energy consumption Parameter name Parameter value
Stimulation tool NS2
Packet size 512kb
Channel Wireless
Number of Mobile nodes
80
Communication agent UDP
Fig2. Comparison of no of round vs remaining nodes
Fig3. Comparison of no of round vs network life time
V. CONCLUSIONS
Therefore, in this mechanism, diffusion wavelets based on sensor nodes’ degree and different nodes’ distance considering the above factors are proposed. Additionally, to further reduce the transport costs in WSNs, a sparse measurement matrix is utilized and MST and modified ant colony routing are jointly applied to mitigate energy consumption and balance the network load, especially lowering the transmission costs for those nodes nearest the sink node. Experimental results have shown that our sparse basis can sparsity the signal well. This method can also accurately reconstruct the original signal. Moreover, the reconstruction error of our scheme is less than DFT [20]. Compared with existing data-gathering approaches, our proposed algorithm not only minimizes the energy consumption of the network, but prolongs the network lifetime.
REFERENCES
[1] D. Ebrahimi and C. Assi, “Compressive data gathering using random projection for energy efficient wireless sensor networks,”
Ad Hoc Netw., vol. 16, pp. 105-119, May 2014.
[2] J. Luo, L. Xiang, and C. Rosenberg, “Does compressed sensing improve the throughput of wireless sensor networks?” in Proc.
IEEE Int. Conf. Commun., Cape Town, South Africa, May 2010, pp. 1-6.
[3] C. Luo, F. Wu, J. Sun, and C. W. Chen, “Compressive data gathering for large-scale wireless sensor networks,” in Proc. 15th
Annu. Int. Conf. (MobiCom), Beijing, China, Sep. 2009, pp. 145-156.
[4] C. Luo, F. Wu, J. Sun, and C. W. Chen, “Efficient measurement generation and pervasive sparsity for compressive data
gathering,” IEEE Trans. Wireless Commun., vol. 9, no. 12, pp. 3728-3738, Dec. 2010.
[5] T. Wimalajeewa and P. K. Varshney, “Wireless compressive sensing over fading channels with distributed sparse random
projections,” IEEE Trans. Signal Inf. Process. Over Netw., vol. 1, no. 1, pp. 33-44, Mar. 2015.
[6] R. Rong and H. Oh, “Adaptive sparse random projections for wireless sensor networks with energy harvesting constraints,” EURASIP J.Wireless Commun. Netw., vol. 2015, no. 1, pp. 113-122, Dec. 2015.
[7] M. T. Nguyen and N. Rahnavard, “Cluster-based energy-efficient data collection in wireless sensor networks utilizing
compressive sensing,” in Proc. IEEE Military Commun. Conf., Nov. 2013, pp. 1708-1713.
[8] M. T. Nguyen, K. A. Teague, and N. Rahnavard, “CCS: Energy-efficient data collection in clustered wireless sensor networks
utilizing block-wise compressive sensing,” Comput. Netw., vol. 106, pp. 171-185, Sep. 2016.
[9] X. G. Wu, Y. Xiong, W. C. Huang, H. Shen, and M. X. Li, “An efficient compressive data gathering routing scheme for
[10] S. Abbasi-Daresari and J. Abouei, “Toward cluster-based weighted compressive data aggregation in wireless sensor networks,” Ad Hoc Netw., vol. 36, no. 1, pp. 368-385, 2016.
[11] X. Xu, R. Ansari, A. Khokhar, and A. V. Vasilakos, “Hierarchical data aggregation using compressive sensing (HDACS) in WSNs,” ACM Trans. Sensor Netw., vol. 11, no. 3, 2015, Art. no. 45.
[12] D. Ebrahimi and C. Assi, “Optimal and efficient algorithms for projection based compressive data gathering,” IEEE Commun.
Lett., vol. 17, no. 8, pp. 1572-1575, Aug. 2013.
[13] Z. Chen, G. Yang, L. Chen, and J. Xu, “Constructing maximum-lifetime data-gathering tree in WSNs based on compressed
sensing,” Int. J. Distrib. Sensor Netw., vol. 12, no. 5, pp. 1-11, 2016.
[14] F. Xiao, G. Ge, L. Sun, and R. Wang, “An energy-efficient data gathering method based on compressive sensing for pervasive
sensor networks,” Pervasive Mobile Comput., vol. 41, pp. 343-353,
[15] W. Wei, W. Dan, and J. Yu, “Energy efficient distributed compressed data gathering for sensor networks,” Ad Hoc Netw., vol.
58, pp. 112-117, Apr. 2017.
[16] R. B. Fletcher, “Energy efficient compressed sensing in wireless sensor networks via random walk,” Ph.D. dissertation, Dept.
Comput. Sci. Eng., Univ. Tennessee Chattanooga, Chattanooga, TN, USA, 2011.
[17] M. T. Nguyen, “Minimizing energy consumption in random walk routing for wireless sensor networks utilizing compressed
sensing,” in Proc. Int. Conf. Syst. Syst. Eng., Jun. 2013, pp. 297-301.
[18] M. T. Nguyen and K. A. Teague, “Compressive sensing based random walk routing in wireless sensor networks,” Ad Hoc Netw., vol. 54, pp. 99-110, Jan. 2017.
[19] S. P. Tirani and A. Avokh, “On the performance of sink placement in WSNs considering energy-balanced compressive sensing-based data aggregation,” J. Netw. Comput. Appl., vol. 107, pp. 38-55, Apr. 2018.
[20] P. Zhang, S.Wang, K. Guo, and J.Wang, “A secure data collection scheme based on compressive sensing in wireless sensor networks,” Ad Hoc Netw., vol. 70, pp. 73-84, Mar. 2018.
[21] V.Chitraa, Dr.Antony Selvadoss Thanamani, “An Efficient Path Completion Technique for web log mining”, 2010 IEEE International Conference on Computational Intelligence and Computing Research
[22] Ms.R.Malarvizhi1 , Dr.Antony Selvadoss Thanamani, “K-Nearest Neighbor in Missing Data Imputation”, International Journal of Engineering Research and Development e-ISSN: 2278-067X, p-ISSN : 2278-800X, www.ijerd.com Volume 5, Issue 1 (November 2012), PP.05-07.
[23] Ms.R.Malarvizhi1 , Dr.Antony Selvadoss Thanamani, “K-NN Classifier Performs Better Than K-Means Clustering in Missing Value Imputation”, IOSR Journal of Computer Engineering (IOSRJCE) ISSN: 2278-0661, ISBN: 2278-8727 Volume 6, Issue 5 (Nov. - Dec. 2012), PP 12-15 www.iosrjournals.org
[24] M.Sakthi and Dr. Antony Selvadoss Thanamani, “An Effective Determination of Initial Centroids in K-Means Clustering Using Kernel PCA”, International Journal of Computer Science and Information Technologies, Vol. 2 (3) , 2011, 955-959.
[25] V.CHITRAA, Dr.ANTONY SELVADOSS THANAMANI, “An Enhanced Clustering Technique for Web Usage Mining”, International Journal of Engineering Research & Technology (IJERT) Vol. 1 Issue 4, June – 2012.
[26] R.NANDHAKUMAR1 AND ANTONY SELVADOSS THANAMANI, “A Survey on E-Health Care for Diabetes Using Cloud Framework”, International Journal of Advanced Research Trends in Engineering and Technology (IJARTET) Vol. 4, Issue 10, October 2017