Available online: http://edupediapublications.org/journals/index.php/IJR/ P a g e | 47
Effect of Educational Intervention on Life Style Modification
among Hypertensive Patients.
Ms Sucheta Pramod Yangad
& Dr Mrs Sripriya Gopalkrishnan
1
PhD Scholar MGMIHS Navi Mumbai, Associate Professor , Dr D Y Patil College of
Nursing Pimpri Pune
, Maharashtra 411018. [email protected]
2Prinicipal Sadhuvaswani College of Nursing Pune.
Sadhu Vaswani Mission’s Medical Complex, 10-10/1 Koregaon Road, Pune-411001
Abstract:
The present study was conducted with the
purpose to assess effect of educational intervention on life style modification. Randomized control trial was conducted on 300 samples by using randomized block sampling technique where 150 samples were included in each group (control and study group). Investigator has prepared life style checklist; the tool was divided in three sections, Section I includes demographic information, Section II includes baseline data, Section III consist of includes life style checklist. Content validity was done from experts to ensure content validity of the tool. Reliability was done by test retest and inter-rater method calculated value was 0.88, and 0.93. Pre test was conducted for both groups. Educational intervention was given to study group and post test one was conducted for both groups after one month of intervention and after three month post test two was conducted. Result shows that in pretest control group, 60% of them had medication for hypertension. In posttest1 control group, 76.4% of them had medication for hypertension. In posttest2 control group, 60.1% of them had medication for hypertension. In pretest study group, 73.3% of them had medication for hypertension. In posttest1 study group, 99.3% of them had medication for hypertension. In posttest2 study group, all of them had medication for hypertension.
In study group, 2.7% of them were smokers in pretest, in posttest1 0.7% of them were smokers and none of them were smokers in posttest2. In control group, 6% of them were smokers in pretest, in posttest1 5% of them were smokers and 5% in posttest2.
In study group, in pretest, 17.3% of them had habit of tobacco chewing. In posttest1, 5.4% of them were chewing tobacco. In posttest 2, 3.4% of them were chewing tobacco. In control group, in pretest, 22% of them had habit of tobacco chewing. In posttest1, 21% of them were
chewing tobacco. In posttest2, 21% of them were chewing tobacco.
In study group, in pretest, 5.3% of them had alcohol. In posttest1 and posttest2, 2% of them had alcohol. In control group, in pretest, 8% of them had alcohol. In posttest1 and posttest2, 8% of them had alcohol.
In study group, in pretest, 18% of them had exercise. In posttest1, 99.3% of them had exercise. In posttest2, all of them had exercise. In control group, in pretest, 29% of them had exercise. In posttest1, 32% of them had exercise. In posttest2, 28% had exercise.
In study group, in pretest, 64% of them had fruits and vegetables. In posttest1, all of them had fruits and vegetables. In posttest2, all of them had fruits and vegetables. In control group, in pretest, 79% of them had fruits and vegetables. In posttest1, 78% had fruits and vegetables. In posttest2, 78% had fruits and vegetables.
In study group, in pretest, 52.7% of them had non-veg. in study group, in posttest1, 53% of them had non-veg. in experimental group, in posttest2, and 52.7% of them had non-veg once a week. In control group, in pretest, 57% of them had non-veg, in posttest1, 57% of them had non-veg. in control group, in posttest2, 57% of them had non-veg.
In study group pretest, 56.7% of them had table salt. In posttest1 and posttest2, none of them had table salt. In control group pretest, 52% of them had table salt. In posttest1 and posttest2, 51%of them had table salt.
August 2016
Available online: http://edupediapublications.org/journals/index.php/IJR/ P a g e | 48 corresponding to factors tobacco, exercise, fruits
& vegetables and table salt are small (less than 0.05), the intervention was found to be significantly effective in improving the lifestyle of hypertensive patients on factors tobacco, exercise, fruits & vegetables and table salt. In present study educational intervention was effective to modify life style of hypertensive patients
Keywords
Effect, Educational Intervention, Life
style,
Modification,
Hypertension,
patients.
1.
Introduction
Health is multi dimensional, the W.H.O definition envisages three specific dimensions the physical, the mental and the social .The state of physical health implies the notion of perfect functioning of the body. It conceptualizes health biologically as a state in which every cell and every organ is functioning at optimum capacity and in perfect harmony with the rest of the body. Health is multi factorial. The factors which influence health lie both within the individual and externally in the society in which he or she lives. The life style is rather a diffuse concept often used to denote the way people live reflecting a whole range of social values, and attitude. It is composed of cultural and behavioral pattern and lifelong personal habits that are developed through processes of socialization. Health requires the promotion of healthy life style. A considerable body of evidence has accumulated which indicates that there is an associate between health and lifestyle of individuals. Many current day health problems especially in the developed countries are associated with life style changes.[3]
Hypertension is major risk for cerebral atherosclerosis, stroke and cardiovascular diseases. Even in mildly hypertensive people the risk of stroke is four times higher than in normotensive people. Adequate control of blood pressure diminishes the risk of stroke. Life style modification are indicated for all patients with prehypertension and hypertension.[5] Education is a process, the chief goal of which is to bring about desirable changes in
the behavior of the learner in the form of
acquision of knowledge, proficiency in skills and development of attitudes.[8]
2.
Methodology and technique
Evaluative approach and randomized
controlled trial (experimental) design was used to assess the effect of educational intervention on life style modification. Population was divided into two groups control group and study group by randomized block sampling technique. sample size of the study was consist of 300 hypertensive patients from selected setting in which 150 samples for study group and 150 samples for control group was selected those who have attended outpatient department of hospitals. Investigator has prepared life style checklist .Tool was divided into four sections Section I includes demographic information which consist of 10 items like age, gender, education, occupation, monthly income, religion, duration of disease , suffering from other disease, taking medication. Section II includes baseline data items are pulse, BP, height, weight (BMI), waist circumference, hip circumference (waist/hip ratio), BSL, and cholesterol.
Section III consist includes life style checklist consist of habits smoking, tobacco chewing, alcohol, exercise, fruits, vegetables, diet veg / non-veg, table salt. Content validity was done from experts to ensure content validity of the tool. Reliability was done by test retest and inter-rator method r value was 0.88, 0.93, and 0.93. Pretest was done on both groups, after pretest educational intervention was given to study group and posttest was conducted on both groups after one month and three month.
3.
Result and Discussion
Available online: http://edupediapublications.org/journals/index.php/IJR/ P a g e | 49
group, 50.7% of them were doing household work. In control group
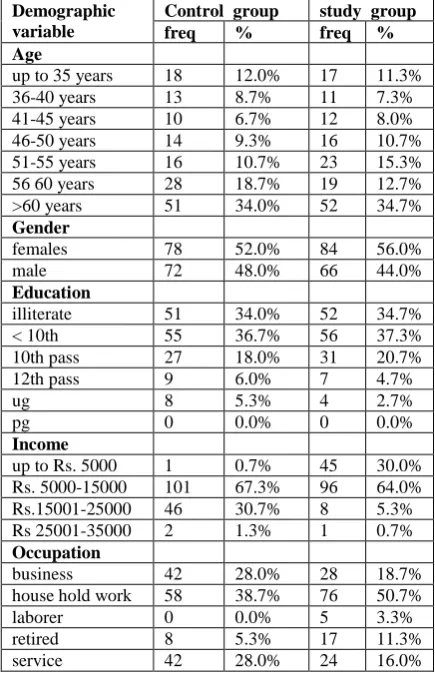
Table 1.1: Description of samples (hypertensive patients) based on their personal characteristics in
terms of frequency and percentages n=150, 150
(Table 1.2), 76.7% of them were married, in study group, 81.3% of them were married. In control group, 88% of them were Hindu, in study group, 85.3% of them were Hindu. In control group, 52% are suffering from study last 1yr, in study group, 57.3% of them are suffering from hypertension last 1 year. In study group, 50% of them did not have any disease, 43.3% of them had diabetes mellitus, 3.3% of them had heart disease, 3.3% of them had some other disease. In control group, 48.7% of them did not had any disease, 50% of them had diabetes mellitus and 1.3% of them had some other disease. In control group, 60% of them had medication for hypertension, in study group, 73.3% of them had medication for hypertension.
Table 1.2: Description of samples (hypertensive patients) based on their personal characteristics in
terms of frequency and percentages n=150, 150
When hypertensive patients have asked are they taking medication (Table 1.3) in pretest control group, 60% of them had medication for hypertension. In posttest1 control group, 76.4% of them had medication for hypertension. In posttest2 control group, 60.1% of them had medication for hypertension. In pretest study group, 73.3% of them had medication for hypertension. In posttest1 study group, 99.3% of them had medication for hypertension. In posttest2 study group, all of them had medication for hypertension.
Demographic variable
Control group study group
freq % freq %
Age
up to 35 years 18 12.0% 17 11.3%
36-40 years 13 8.7% 11 7.3%
41-45 years 10 6.7% 12 8.0%
46-50 years 14 9.3% 16 10.7%
51-55 years 16 10.7% 23 15.3%
56 60 years 28 18.7% 19 12.7%
>60 years 51 34.0% 52 34.7%
Gender
females 78 52.0% 84 56.0%
male 72 48.0% 66 44.0%
Education
illiterate 51 34.0% 52 34.7%
< 10th 55 36.7% 56 37.3%
10th pass 27 18.0% 31 20.7%
12th pass 9 6.0% 7 4.7%
ug 8 5.3% 4 2.7%
pg 0 0.0% 0 0.0%
Income
up to Rs. 5000 1 0.7% 45 30.0%
Rs. 5000-15000 101 67.3% 96 64.0%
Rs.15001-25000 46 30.7% 8 5.3%
Rs 25001-35000 2 1.3% 1 0.7%
Occupation
business 42 28.0% 28 18.7%
house hold work 58 38.7% 76 50.7%
laborer 0 0.0% 5 3.3%
retired 8 5.3% 17 11.3%
service 42 28.0% 24 16.0%
Demographic variable
Control group
study group
freq % freq %
Marital status
married 115 76.7% 122 81.3% separated 1 0.7% 0 0.0% unmarried 8 5.3% 3 2.0% widow/widower 26 17.3% 25 16.7%
Religion
christian 0 0.0% 4 2.7% hindu 132 88.0% 128 85.3% muslim 17 11.3% 17 11.3%
other 1 0.7% 1 0.7%
Duration
up to 1 year 78 52.0% 86 57.3% 1-3 years 24 16.0% 28 18.7% 3-7 years 20 13.3% 20 13.3% > 7 years 28 18.7% 16 10.7%
Disease
DM 65 43.3% 75 50.0% Heart disease 5 3.3% 0 0.0%
other 5 3.3% 2 1.3%
no 75 50.0% 73 48.7%
Medication
August 2016
Available online: http://edupediapublications.org/journals/index.php/IJR/ P a g e | 50 Table 1.3 Medication in pretest and posttest
N=150, 150
Life style analysis result stated that in study group, 2.7% of them were smokers in pretest, in posttest1 0.7% of them were smokers and none of them were smokers in posttest2. In control group, 6% of them were smokers in pretest, in posttest1 5% of them were smokers and 5% in posttest2. In study group, in pretest, 17.3% of them had habit of tobacco chewing. In posttest1, 5.4% of them were chewing tobacco. In posttest2, 3.4% of them were chewing tobacco. In control group, in pretest, 22% of them had habit of tobacco chewing. In posttest1, 21% of them were chewing tobacco. In posttest 2, 21% of them were chewing tobacco. In study group, in pretest, 5.3% of them had alcohol. In posttest1 and posttest2, 2% of them had alcohol. In control group, in pretest, 8% of them had alcohol. In posttest1 and posttest2, 8% of them had alcohol. In study group, in pretest, 18% of them had exercise. In posttest1, 99.3% of them had exercise. In posttest2, all of them had exercise. In control group, in pretest, 29% of them had exercise. In posttest1, 32% of them had exercise. In posttest2, 28% had exercise. In study group, in pretest, 64% of them had fruits and vegetables. In posttest1, all of them had fruits and vegetables. In posttest2, all of them had fruits and vegetables. in control group, in pretest, 79% of them had fruits and vegetables. In posttest1, 78% had fruits and vegetables. In posttest2, 78% had fruits and vegetables. In study group, in pretest, 52.7% of them had non-veg. in study group, in posttest1, 53% of them had non-veg. in study group, in posttest2, and 52.7% of them had non-veg once a week. In control group, in pretest, 57% of them had non-veg, in posttest1, 57% of them had non-veg. in study group, in posttest2, 57% of them had non-veg. In study group pretest, 56.7% of them had table salt. In posttest1 and posttest2, none of them had table salt. In control group pretest,
52% of them had table salt. In posttest1 and posttest2, 51%of them had table salt.
Researcher applied Fisher’s exact test (Table 2) for the effectiveness of intervention on life style of hypertensive patients. For the effectiveness at posttest1, the p-values corresponding to factors tobacco, exercise, fruits & vegetables and table salt are small (less than 0.05), the intervention was found to be significantly effective in improving the lifestyle of hypertensive patients on factors tobacco, exercise, fruits & vegetables and table salt. For the effectiveness at posttest2, the p-values corresponding to factors tobacco, exercise, fruits & vegetables and table salt are small (less than 0.05), the intervention was found to be significantly effective in improving the lifestyle of hypertensive patients on factors tobacco, exercise, fruits & vegetables and table salt.
Table 2: Effectiveness of intervention on life style of hypertensive patients
N=150 Fact or Lifesty le item Pre test Pos ttes t 1 Pos ttes t 2 P valu e (Pre test and Post test1 ) P valu e (Pre test1 and Post test2 ) Smo
king No 146 148 148 0.37
1
0.12 3
Yes 4 1 0
Toba
cco No 124 141 143 0.00
0
0.00 0
Yes 26 8 5
Alco
hol No 142 146 145 0.21
8
0.21 8
Yes 8 3 3
Exer
cise No 123 1 0 0.00
0
0.00 0
Yes 27 148 148
Fruit s and vege table s
No 54 0 0
0.00 0
0.00 0
Yes 96 149 148
Non-veg No 71 70 70 1.00
0
1.00 0
Yes 79 79 78
Tabl
e salt No 65 149 148 0.00
0
0.00 0
Yes 85 0 0
4.
Conclusion and
Recommendations’
Test Medication Control
group
Study group
freq % freq %
pretest No 60 40.0% 40 26.7%
Yes 90 60.0% 110 73.3%
Posttest 1
No 35 23.6% 1 0.7%
Yes 113 76.4% 148 99.3%
Posttest 2
No 59 39.85% 0 0.0%
Available online: http://edupediapublications.org/journals/index.php/IJR/ P a g e | 51
In pretest control group, pre test to post test difference is less but in study group pre test to post test improvement in taking medication is 100% all samples were having medication at the post test 2.
To assess the effectiveness of intervention on life style of hypertensive patients, at posttest1, the p-values corresponding to factors tobacco, exercise, fruits & vegetables and table salt are small (less than 0.05), the intervention was found to be significantly effective in improving the lifestyle of hypertensive patients on factors tobacco, exercise, fruits & vegetables and table salt. For the effectiveness at posttest2, the p-values corresponding to factors tobacco, exercise, fruits & vegetables and table salt are small (less than 0.05), the intervention was found to be significantly effective in improving the lifestyle of hypertensive patients on factors tobacco, exercise, fruits & vegetables and table salt. Educational intervention was effective for modification of life style. Educational interventions are recommended to increase awareness of life style modification.
5.
Acknowledgements
The authors would like to thank all the participants for participating in the study.
6.
References
[1]Becker K.J(2001).· Fruin M.S. · Gooding T.D. · Tirschwell D.L. · Love P.J. Mankowski T.M “Community-Based Education Improves Stroke
Knowledge” ,Cerebrovascular Diseases,
2001;11:34–43 .
[2]Chajaee F et al3 (2018). “Relationship between
health literacy and knowledge among patients with hypertension in Isfahan province, Iran.” Electron physician Mar 25;10(3):6470-6477. doi: 10.19082/6470. eCollection 2018 Mar.
[3]K. Park (2013). Parks Textbook of Preventive and Social Medicine, 22 ed,Banarasidas Bhanot
Jabalpur.pp13-18.
[4]K R Thankappan (2013) et al5 “Impact of a
community based intervention program on
awareness, treatment and control of hypertension in a rural Panchayat, Kerala, India” Indian Heart J. Sep 2013; 65(5): pp504–509.
[5]Lewis(2015) “Medical Surgical Nursing
Assessment and Management of Clinical
Problems”,2nd South Asia edition , Vol I,
Elsevier,2015 Gurgaon India ,pp742-763
[6]Nicholas Boon, Nicki Colledge, Brain Walkar, John hunter, “Davidsons principles and practice of medicine”, 20th edition, Churchil Livingstone
Elsevir, Edinburgh London New York , 2006, pp1200-1211.
[7]Rajeev Gupta, Shreya Gupta (2017). “Review Article Hypertension in India: Trends in Prevalence, Awareness, Treatment and Control” RUHS Journal of Health Sciences, Volume 2 Number 1, January -March 2017Mahatma Gandhi Medical College, Jaipur, India.
[8]R Sudha (2013) “Nursing Education principles and concept”, 1st edition, Jaypee Brothers Medical
Publishers Pvtltd. New Delhi. pp 48-49
[9]Wenyu Wang et al6 (2006). . “A longitudinal
study of hypertension, risk factors and their relation to cardiovascular disease”. Hyeprtension
2006:47:403-409