CSGRPPAP.7
Ref: 112
Classroom contexts: connections between class size and
within class grouping
Peter Blatchford*, Ed Baines*, Peter Kutnick** and Clare Martin*
*Institute of Education, University of London
**University of Brighton 2001
Published in British J of Educational Psychology, 71, 283--302
Classroom contexts: connections between class size and within class grouping
ABSTRACT
Background
There has been a vigorous debate for many years about the educational effects of class size differences but even if differences have an impact on pupils' academic progress, this still leaves unanswered important questions about what mediates the effect. Aims
This paper is informed by a classroom contextual perspective, and examines associations between class size and within class groupings (in terms of size and number of groups, adult presence in groups, and type of interaction between grouping members). Age differences in these relationships are also explored.
Samples
The quantitative study is based on analysis of 3157 groupings, from 672 Reception, Year 2 and Year 5 classes in 331 schools. The qualitative study was based on 12 classes in 8 case study schools, and questionnaire responses completed by over 100 class teachers.
Methods
Links between size of class and within class groupings were also examined on the basis of a 'grouping mapping survey', in which teachers at a given time in the school day provided information on group size and number, adult presence, and type of interaction between pupils, and complementary qualitative analyses of data from teacher-completed questionnaires, and interviews.
Results
Class size and within class grouping
Conclusions
Class size and within class grouping
INTRODUCTION
A main starting point of this paper is the long running and vigorous debate about the effects of class size differences on pupils’ educational attainment. A main worry in the UK has been that class sizes at the primary stage are too large and that teaching and learning, and children’s educational progress, can suffer (see Blatchford, Goldstein and Mortimore, 1998). It is probably true to say that the overwhelming professional judgement is that, other things being equal, smaller classes will enable teachers to provide a better quality of educational experience for pupils. However, research findings on the effects of class size differences are not clear-cut. Recent evaluations in the USA of class size reduction programmes provide evidence that small classes do benefit young children in schools (e.g. Finn & Achilles, 1999; Molnar et al, 1999), though there are questions about the validity and generalisability of results (Goldstein and Blatchford, 1998; Hanushek, 1999, Prais; 1996). Results from such research as has been done in the UK on the effects of class size differences on pupils' educational progress are not clear, largely because research designs have not been strong enough to enable firm conclusions (see Goldstein and Blatchford, 1998).
Even if it can be shown that class size differences have an impact on pupils' academic progress, this still leaves unanswered important questions about what mediates the effect. Unfortunately, we have little systematic information on what processes, that is, which mediating factors, might be involved (Blatchford and Martin, 1998). Research has concentrated almost exclusively on the effects of class size reductions on academic outcomes. The STAR project, like many others, was predominantly interested in the relationships between class size and academic attainment, and has little to say about classroom processes that might explain effects found. Finn and Achilles (1999), two of the STAR research team, acknowledge this when they argue: "Despite dozens of earlier studies, the classroom processes that distinguish small from large classes have proven elusive." (1999, p102). In a similar vein, Grissmer (1999) has concluded that there is a lack of coherent theories by which to guide and interpret empirical work on class size effects, and with which to make new predictions. The situation in the UK is much worse, in the sense that there is little research on classroom processes connected to class size differences. We need, therefore, accounts of classroom processes that might explain why smaller classes differ from large classes.
statistical modelling of influences on behaviour, for example, as seen in school effectiveness research (Goldstein, 1995).
In line with Bronfenbrenner's model, this paper is informed by a conceptionalisation of educational processes taking place in hierarchically organised contexts. But Bronfenbrenner's model needs to be developed because within the ‘microsystem’ of the school, there will be smaller contexts, such as the playground and especially the classroom, which are parallel to each other, and which have qualitatively different sets of relationships, rules and dynamics (Pellegrini and Blatchford, 2000). In addition, and of particular relevance to this paper, contexts are nested within classrooms. An early conception of the immediate environment as a factor in everyday behaviour was the ecological psychology of Barker and Wright and their colleagues (Barker, 1968; see Doyle, 1986). When applied to classrooms, the basic idea is that different within classroom contexts have forces or ‘signals’ different to other contexts, which pull events and participants along with them (Kounin and Gump, 1974).
Class size and within class groupings
All pupils in classes are grouped in some form or another, perhaps especially at
primary school level in Britain, and the grouping is a main context, within classrooms, for teaching and learning. A commonsense approach to groups in classrooms in terms of proximity, that is, in terms of children seated around one table, but in current research by the authors (Blatchford, Kutnick and Bains) the concept of ‘grouping’ has been conceptualised to bring together notions of proximity/seating and working on the same task activity. The ‘grouping’ can be considered as the context in which a
teacher co-ordinates the task activity that pupils work on. To clarify this notion, an example can be given. In a small class of 20 pupils a teacher may have children seated in five around four tables. If the teacher has given out the same work sheet to all children there will be four groupings. If later in the lesson she then goes over the work sheet with the children as a class, there will be only one grouping; even though children are seated at four tables their attention and activity is focused on her and the rest of the class as a whole. This example illustrates that a grouping at any moment in time may be an individual child, a dyad, triad, or anything from a small group of four children to a whole class grouping. Throughout the rest of this paper the terms ‘group’ and ‘grouping’ will be used synonymously.
The benefits or disadvantages of different grouping practices has aroused a good deal of comment and research in Britain and elsewhere. In Britain, 'progressive' primary education practices, including small group work, have been criticised as being ineffective (Alexander, Rose & Woodhead, 1992; OFSTED, 1995a), and it has been recommended that teachers adopt whole class teaching methods, albeit tempered with a recognition that pupils need to be interactive rather than passive. Government policy initiatives, such as the 'literacy hour', are prescriptive about time to be spent in
particular groupings. However, Lou et al, (1996), in a meta-analysis, showed the pedagogical advantages of small group instruction in terms of peer learning,
flexibility over learning objectives and meeting individual needs, and encouragement of higher-order learning skills. Experimental research on co-operative and
occur under everyday conditions in classrooms. Surprisingly little is known about within-class grouping in terms of a number of key dimensions, including the size and number of groups in a class, and the role of adults.
The class and the group can be thought of as examples of environmental contexts, with the group level usually nested within the level of the whole class. Logically the two levels, that is class size and within class groups, have to be connected (for example, as class size increases groups must either become bigger or more
numberous). If, in the above example, the teacher was faced with a class of 32, for example, then she could divide her class into four groupings of eight pupils, eight groupings of four pupils, or a ranged of different sized groupings or teach the class as a whole as one large grouping. But the conceptual, and educationally important, question concerns how, in practice, class size and within class groupings are
connected. As far as we know, this possibility, that is, the connection between size of class and within class grouping practices has not been looked at systematically before. This paper draws on data from two projects that, taken together, allowed us to explore linkages between class size and within class groupings, across the whole of the
primary stage. The first is the ESRC funded Primary Classroom Grouping Project (PCGP) which took the form of a survey of within class grouping practices in Year 2 (6 to 7 year olds) and Year 5 (9 to 10 year olds) classrooms, using a novel teacher mapping technique, and the second is a survey of Reception year classrooms (4-5 year olds), which was part of the Institute of Education longitudinal class size study (see Blatchford and Martin, 1998, Blatchford et al, 1998).
In the Primary Classroom Grouping Project, within class groupings were conceptualised and measured in terms of five ‘core themes’: size and number of groups, composition of groups, task and curriculum areas, role of adults, and type of interaction (see Blatchford et al, 1999; Kutnick, Blatchford & Baines, 2001). The same methodology, and conceptualisation of within class groupings, was used in the much larger scale Class Size project. On a priori grounds, and after initial
examination of associations, this paper is concerned with connections between class size and three of these themes: size and number of groups in the class, the role of adults in the class, and the type of interaction between children in the groups. In separate papers we address inter-relationships between the five core themes
(Blatchford et al, 1999; Kutnick et al, 2001) and developments with age in grouping practices (Baines, Blatchford & Kutnick, 1999; Baines, Blatchford & Kutnick, 2001). i. Size and number of groups
Research on grouping has been mostly concerned with the composition of groups, usually in terms of ability (Lou et al, 1996; Webb, Baxter & Thompson, 1997). However, another basic component, that is likely to be a significant factor in pupils’ educational experiences, is the size of the group they work in, as well as the number of groups in a class. While research has been conducted on, and there has been discussion about, the educational implications of groups of different sizes (Fuchs, et al., 2000; Kutnick, 1994), it has not to date looked in a systematic way at the range of group sizes as they naturally occur in classrooms, and at the connections with
interactions between children. Observational research has shown that a sizeable amount of children’s time in class will be spent on individual work, even when seated in groups (Galton, Simon & Croll, 1980; Tizard, Blatchford, Burke, Farquhar, & Plewis, 1988), but even here the size of the group within which children work may still be a factor when considering children’s concentration, and teachers’ management of the class (eg decisions about distributing her time between groups).
Given that primary classrooms tend to be organised in terms of groups for many purposes, a large class is likely to present teachers with some difficult choices. One strategy might be to use more whole class teaching, that is, treat the whole class as one group, but this might not be acceptable to many teachers, for example, because this would not be appropriate with children of diverse aptitudes, or with very young children. They may then be forced to organise the class into, and teach more to, larger groups than they would like. In a small class, by contrast, there may be more
opportunity for individualised or very small group work, and more individual attention. As Lou et al (1996) show, whole class and small group contexts are likely to have very different pedagogical consequences, with whole class teaching having more emphasis on teacher explanations and encouragement and uniformity of instruction, and small group instruction likely to involve more peer interaction and diverse learning activities. A main aim of this paper is therefore to investigate the links between class size and number and size of groups, as well as teachers' experience of, and views on, the connections.
(ii) Adult presence in groups and their role
The role of adults with regard to groups is crucial, practically in terms of effective management of classrooms, and also in terms of connections with other aspects of group functioning (Blatchford et al., 1999). There is limited information available on how adults distribute their time between groups within the class, and whether this varies between groups of different size. It might be expected that the number of children in the class will necessarily have implications for the amount and quality of contact teachers can offer separate groups.
(iii) Type of interaction within groups
Another key feature, and the third core theme, is the nature of the working interaction between pupils. One criticism of the use of groupings in schools is that although children often sit and work in groups it is rare that they work as groups (Galton et al., 1980, Tizard et al., 1988). In this paper a categorisation of interaction within
groupings, originally suggested by Bennett & Dunne (1992), and which aimed to examine the working relationships between pupils, was extended to incorporate pupil-adult/ teacher interactions. The aim was to find out whether children tend to work more collaboratively in smaller groups and classes as might be expected.
Age group differences
expected that in the case of the youngest children there will be more small group teaching and less whole class teaching, as well as more adult support.
Summary of aims of the paper
This paper is therefore informed by a classroom contextual perspective, and addresses linkages between class and within class contexts, and their educational consequences. In this paper, we do not seek to test alternative causal pathways leading to
achievement as an outcome. At a later point it will be possible to do this, and model statistically connections with achievement. Here, we examine the associations between class size on the one hand and, on the other hand, within class groupings (in terms of size and number of groups, adult presence in groups, and type of interaction). Age differences in these relationships are also explored.
Method
Links between size of class and within class groupings, in terms of the three core themes, were analysed on the basis of two main forms of analysis: first, numerical analyses of associations between measures of class size and the three core themes, and, second, complementary qualitative analyses, designed to further study the links between size of class and within class groupings. The qualitative analyses are drawn from teacher completed questionnaires in the class size study and interviews in case studies from the Primary Grouping Practices Project. The aim of the qualitative component was to test, and give individual detail to, main findings from the
quantitative study, and to seek a complementary analysis of teachers' experiences of, and views on, the connections between class size and within class groupings. The disjuncture between professional and research evidence has been a feature of research on class size (e.g. Shapson et al. 1980) and one aim of these analyses was to seek to bring both perspectives together in one study.
Phase 1 - Quantitative Study
As described above, data were drawn from two separate studies: Primary Classroom Groupings Project (PCGP) (Year 2 and Year 5).
Grouping Mapping Survey:
The aim of the survey grouping questionnaire was to utilise the benefits of a large scale survey method, and an observational approach, while avoiding the difficulties associated with these two approaches, e.g. lack of detail and expense respectively. Teachers, at a given time in the school day when pupils were working (as opposed to break time or assembly), drew a map of their classroom. On this map they identified the location of individual male and female pupils, the grouping that they were part of, and adults working in the classroom. For each grouping, information was obtained on size, adult presence and type of interaction. Data on each grouping were then entered into SPSS and were the basic unit of statistical analysis. Information was also
Sample: Five Local Education Authorities (LEAs) were involved, four from the south and one from the north west of England. Three were mostly urban and two inner city. Participating schools were sent the questionnaires to be completed during a week when extraneous events, which have made groupings untypical, were not timetabled. A total of 425 schools were contacted and just less than half agreed to assist with the project. Over half of these schools returned questionnaires. A total of 1063 groupings in total were described in the questionnaires of the 187 year 2 and 5 classes. Teachers were asked to complete questionnaires at one of five specified times on a specified day (Tuesday, Wednesday or Thursday). This was to avoid sampling bias, which may have occurred if one time or day had been selected. Returned questionnaires were fairly evenly distributed over the 5 completion times, and there were no significant differences between them in return rates. More details on the methods used can be found in Blatchford et al., (1999).
Reception Class grouping practices - The Class Size Study: In a parallel project, examining the effects of class size on pupil learning experiences, data were also collected on grouping practices in Reception classes (children aged 4-5 years). Mapping data used in this paper come from Reception classes in Cohort 1 which comprised 220 schools, randomly sampled from eight LEAs, providing data on 485 classes and 2094 groupings. This study made use of a similar, although simplified, grouping mapping survey method to that used in the PCGP study, except that information on interaction in groups was not examined. More details and background on methods used in this project can be found in Blatchford and Martin (1998) and Blatchford et al., (1998). The two studies together (that is, the PGPP and Class Size studies), provided data from 672 classes in 331 schools, amounting to 3157 groupings in all.
Phase 2 - Qualitative Study
As described above, there were two sources of data for phase 2:
Results
Class size in relation to year group
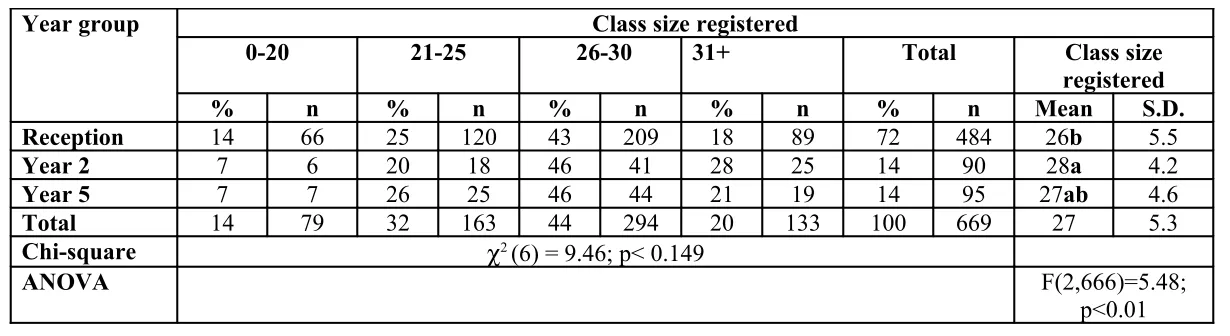
As can be seen in Table 1, class sizes did not vary greatly between year groups, though the youngest children tended to be in smaller classes. Table 1 breaks down class size into four bands: 20 and under, 21-25, 26-30 and over 30. The first band, 20 or under, can be considered 'small', and the fourth, 31 or over, can be considered 'large' (see Mortimore & Blatchford, 1993). The table shows fewer large, and more small, classes at Reception, though the overall chi-square is not significant.
Table 1 about here
Class size in relation to number of within class groupings
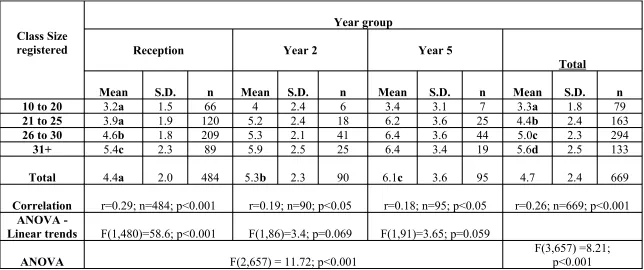
Table 2 shows that there were on average just under five groups in these classes at the time of the classroom map. The number of groups in classes increased significantly with age of child, though post hoc tests showed that significant differences between Reception, year 2 and year 5.
Table 2 about here
Table 2 also shows that the number of groups in a class increased with the size of the class, whether class size is treated as a continuous or categorical variable (that is, in terms of statistical analyses involving both correlation and ANOVA). Post hoc tests indicated that there were clear differences between class size bands in the number of groups. The effect was evident at all three ages. Over all three year groups, small classes (that is, 20 children or under) had on average just over three groups, while in large classes there were approaching six groups.
Class size in relation to size of within class groupings
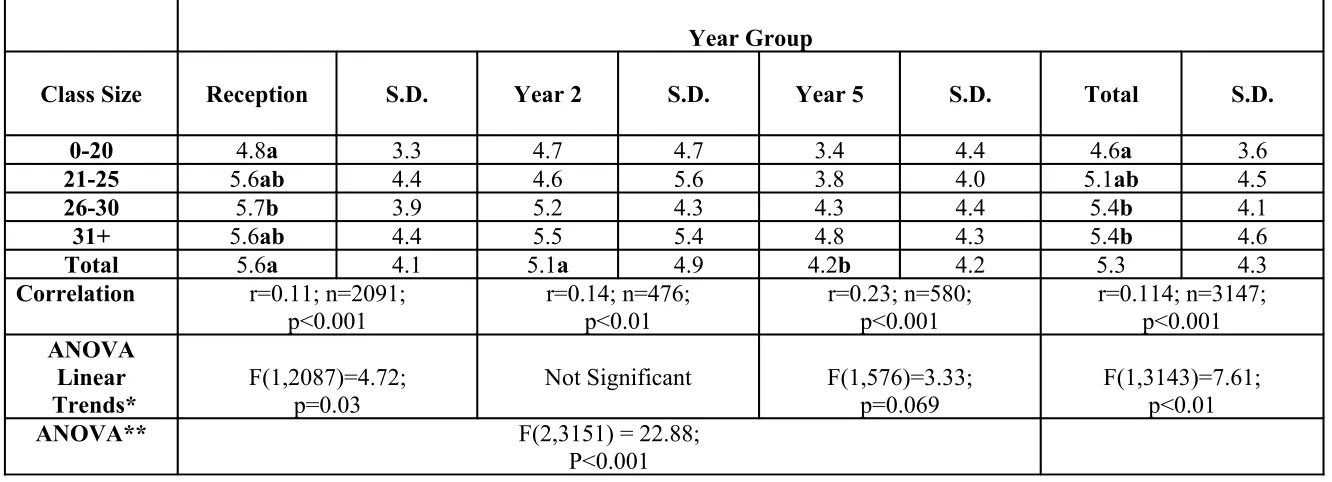
In Table 3, the average size of grouping across all three age levels is seen to be just over five children. Group sizes varied by age of child; groups in classes with older children (Year 5) were significantly smaller than those in Year 2 and Reception classes. This means that the youngest children in school were in the smallest classes with the largest groups but the least number of groups.
Table 3 about here
Associations between size of class and the size of within class groups are shown overall and for the three year groups separately (see Table 3). Overall, the size of groups in the class decreased with size of class. The association between class size and size of groups is found at Reception and to an extent at Year 5 (the trend at Year 5 just misses statistical significance at the .05 level). At Year 2, mean size of groups increases with size of class bands in the expected fashion, but the differences were not statistically significant.
The connection between class size and group sizei can be examined in more detail by
There are different ways of viewing and using data on group size. One method is based on the number of children in each of the groups; that is, the prevalence of a group is weighted in terms of the number of children it contains. This is probably the best measure of the likelihood that a child will experience a group of a given size and is used in this paper.
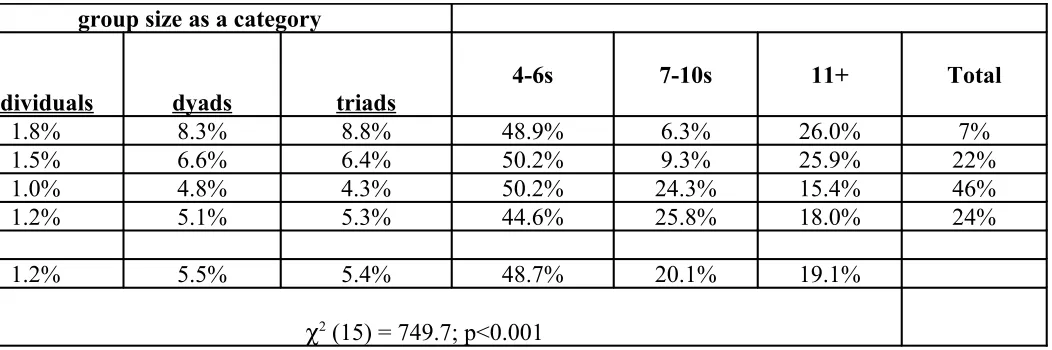
It can be seen in Table 4 that a pupil is most likely to experience a group size of 4-6 children, followed by larger groups of 7-10 and 11+ (mostly whole classes). Table 4 shows that there is little difference in the number of individuals, dyads, triads or 4-6s in classes of different sizes. Interestingly, however, there is evidence that in class sizes over 25 there is more likelihood of a pupil being in a large group of 7-10, while in classes under 25 there is more likelihood of being in a very large group of 11 and over, which will include whole class groupings. There is relatively little likelihood of children in classes under 25 being in groups of 7-10.The relationship between class size and size of groups (examined in this more detailed but categorical way) was conducted at each age level separately (results not shown). The effect just described was clearest at Reception level.
Table 4 about here
Number and size of groups and adult presence
In general, adults were most likely to be present in Reception classes (48% of groupings), followed by Year 2 classes (26% of groupings). Groupings in Year 5 classes were the least likely to have an adult present (16%).
The number of adults in classes increased with the number of groups at Reception and Year 2, and to some extent at Year 5 (r=0.37, n=476, p<0.001; r=0.26, n=92, p<0.01; r=0.16, n=95, p<0.06 respectively). There was also a significant relationship between adult presence and group size at all three ages (χ2 (5) 230.7, p<.00, n=2091; χ2 (5) 77,
p<.00, n=477; χ2 (5) 114.1,p<.00, n=580, for Reception, Year2 and Year 5
respectively). As might be expected, adults were most likely to be with the largest groups – 7-10s and especially 11+ groups. At Reception and Year 2, but not Year 5, adults were also more likely to be working with individuals (57%, 40% and 14% of groupings at Reception, Year 2 and Year 5 respectively) than with dyads, triads, and 4-6 children. At all ages, dyads and triads were least likely to have adults present.
Type of interaction within groups
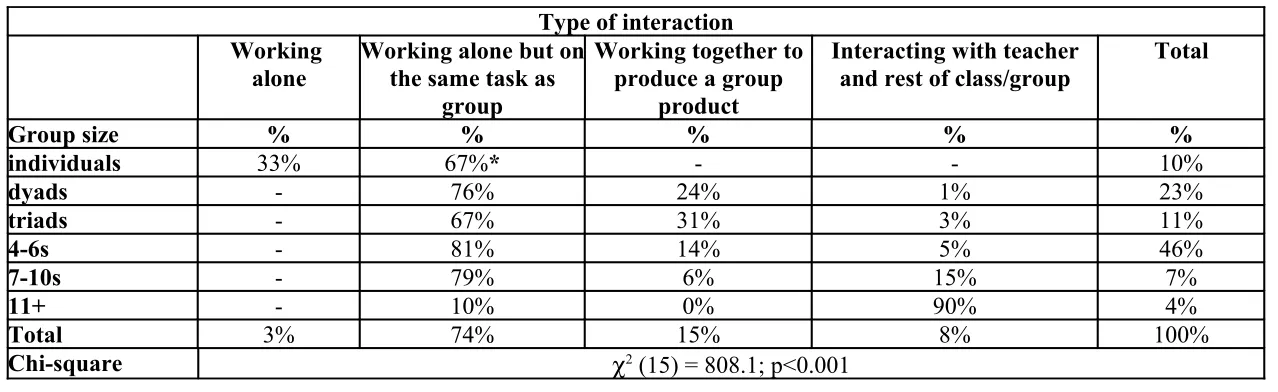
The most common type of interaction between group members was individuated work that did not require interaction among group members (see Table 5). Co-operative and collaborative work on joint tasks was rare in comparison and approximately one-fifth of groupings involved pupils listening to and interacting with the teacher and the rest of the class or group. There were no clear differences between Year 2 and 5 classes (data on Reception classes were not available for type of interaction). Table 5 also shows that working together was more likely in smaller groups (dyads, triads and to an extent groups of 4-6 children), and much less likely in large groups of 7-10 children.
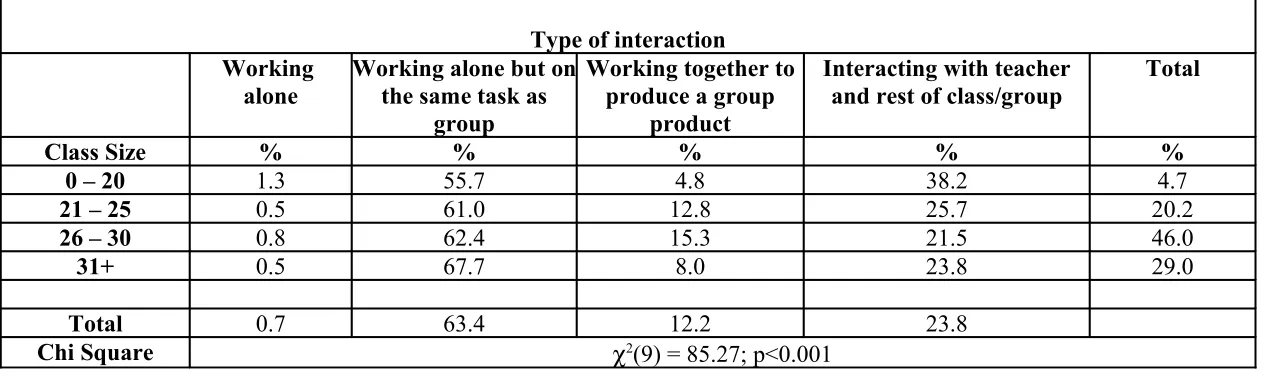
Table 6 shows a significant relationship between grouping size and the type of interactions found in groups. Consistent with results on group size by size of class, reported above, it was also found that children in smaller classes were relatively more likely to interact with the teacher and the rest of the class or group. Individuated work, that is, working alone but in a group, increases with size of class. Interestingly, although not common, working together to produce a group product was less likely in small, and to an extent, large classes, and more likely in classes with between 20-30 children.
Table 6 about here
Qualitative Analyses
One of the main points to come from the qualitative study concerned difficulties larger classes placed on teachers in terms of grouping arrangements. A main difficulty faced by teachers was what might be called a 'size/number dilemma'. This is evident in the following extract from a Year 2 teacher:
‘When I first had this class I had 33 children in it and I tried to group them into five groups but I just didn't have enough space and so then I had to put them into four groups of eight and they were a bit unwieldy. Eight is rather too many and now that some have left it's a much better arrangement - five groups of six because the tables are not so bulky and the children are more separated from each other away from the other groups and six is a smaller number to work with - it's a manageable number to work with, so I would definitely say that (class size) is quite a definite factor.’
It is evident here that class size brings about the difficulties faced by the teacher, and that she feels cuts in class size resolve the dilemma. There was a clear indication that teachers of large classes felt driven, for classroom management purposes, to use a few large groups rather than a number of small groups.
Group size preference
Teachers in the PCGP also commented on the relationship between size of class and size of group. Some said that group size depended on the activity but most preferred group sizes of between 4-6 children for a variety of reasons, including the lack of resources for larger groups, space restrictions, and the forced formality of larger groups. Teachers in answer to the Class Size study questionnaires and in interviews, said they preferred groups of 4-6 children.
Effects on teaching and learning of larger groups
A clear result from the quantitative results was the greater likelihood of a child in a larger class being in a larger group of 7-10 children. Results from the qualitative studies extended this picture. There were three main categories of responses by teachers. They were clear that as groups became bigger (1) the quality and amount of teaching, (2) the quality of the children's work, and (3) the children's contribution and concentration in groups were affected.
There were many comments on the way that larger groups adversely affected the nature of teachers' input into groups. Here is a selection of quotes from teachers:
‘If I teach larger groups and therefore get around more often, the quality is more likely to be reduced as there are more children working together - all of differing abilities.’ (Year1)
‘In my class we generally work in groups of 7 which is too large. It takes much longer for me to give my attention to each child in the group’ (Reception)
‘Working with large groups of 8.9 or 10 children means that I feel that I am not giving each child the attention he/she deserves and needs’ (Year1)
‘(When trying to cater for 7 or 8 in groups to make the class manageable) the children obviously get less time on lengthy adult intensive tasks.’ (Reception) ‘I feel that the quality of teaching and learning in my class this year is high, due to having a fairly small class of 25 children. This means that for group work, I can (have) small groups which in turn means more individual attention. It has also enabled me to have small groups for the lower ability children, who I feel benefit more from this.’ (Reception)
‘Having 18-23 children in our class enables us to organise the children in a number of small groups...I feel that the children also get more opportunities to experience a 'hands on' approach to their learning and are questioned by the teacher more thoroughly because we are teaching children in smaller groups.’ (Year1)
Some teachers also felt that the depth of their knowledge about individual children was adversely affected by having larger groups in the class:
‘I think getting to know the children is much easier in smaller groups and is fundamental to the smooth running and learning of the children - this must be much better in a smaller class’ (Reception)
Classroom management and control were also affected, according to some teachers, by having larger groups.
‘Some of my groups have 10 children - and I often have them working around a large table. It's much harder to control this size group which must affect learning.’ (Reception)
(2) The quality of children's work
The second main category of responses from teachers about the effects of size of group concerned the quality of children's work:
There was a view that smaller groups were more effective for certain curriculum areas, e.g. literacy hour/activities and practical work:
‘The children can be taught in small groups and year groups - particularly effective in the literacy hour and practical sessions’ (Year 1)
‘Guided reading is difficult with a group of 6/7 children.’ (Reception) The case studies revealed dilemmas faced by teachers:
‘The arrangements are fine for literacy hour but when you do maths you think 'now shall I just get them to work as individuals at their own seats or are we going to do musical chairs thing?' It's like a dilemma each time… (Year1/2) It could also be difficult to find tasks for those in other groups.
‘Being able to focus on groups to do a focused task is difficult as there are always so many others to find independent tasks for.’ (Year1)
Large within-class group sizes can therefore affect the quality of work engaged in by pupils and this can be magnified in certain curriculum areas and task activities, and pose difficult choices for teachers.
(3) Child contribution and concentration
Larger groups adversely affected the contribution and concentration of children in groups:
‘With a group of 6 children, generally, concentration is better and children have more opportunity to contribute...in a group of 8 or more those children who are inclined to lose concentration may lapse for longer periods, and have fewer opportunities to contribute.’ (Reception)
‘My daily routine is not affected by the number of children in my class but the size of groups I work with at any one time is. The bigger the group the easier for individual children to lose concentration, and miss the teaching point.’ (Year1)
This last quote is interesting in showing that it is group size, rather than the number of children in the class, which affects the teacher’s daily routine and the concentration and ability to grasp points.
The quantitative results suggested that the effects of size of class and group size were most marked in the case of Reception aged children. Worryingly, teachers' comments indicated that they felt the problems of larger groups were particularly acute for some younger children of Reception age - some, as we have said already, only just four years of age.
‘The quieter children lack confidence and often stay on the fringes during group discussions and activities’ (Reception)
More generally, some teachers felt that with larger groups it was hard to ensure children were working to their full potential:
‘With 5 groups of 6/7 children it is hard to ensure that they are working to their full potential.’ (Year1)
‘I have 30 children which breaks down into 5 groups of 6. This is about manageable. However, if several of the children are absent from the class and groups sizes are brought down to 4 or 5, it makes a tremendous difference.’ (Year1)
To sum up, the interview and questionnaire data indicate a number of educational consequences resulting from the tendency for larger classes to result in larger groups. Firstly, larger groups affected the quantity and quality of teaching in terms of the attention teachers could give each child and groups, the quality and effectiveness of their teaching, the thoroughness of their questioning, the amount of extended adult intensive tasks, the depth of their knowledge about individual children, and
difficulties with classroom management and control. Secondly, large within class group sizes affected the quality of pupils' work. And thirdly, larger groups adversely affected the contribution and concentration of children in groups, particularly in the case of the youngest children in school.
Discussion
In this paper we have looked at one way that class and within class contexts can be linked, by examining connections between class size and the size and number of within class groupings. It is perhaps surprising that the differences in class size between the three age groups were not more marked - only on average one or two children. It might have been expected, or hoped, that the youngest children in school would start in much smaller classes. Taking the class and group level data together, it looks as if the youngest children in school are in the smallest classes, and with the fewest number of groups, which might have been predicted, but in the largest groups, which seems surprising. The older primary aged child (Year 5), tends to be in a larger class, with more numerous but smaller groups. These groups are less likely to have adults in attendance. It seems likely that at Reception and Year 2, where more adult support is available, pupils may be perceived to be more reliant on adults for the maintenance of concentration and thus the teacher organises the class into a few large groups so that the ratio of adults to groups is low. At Year 5, the reduced amount of adult support, combined with the perception that Year 5 pupils are able to work more independently, may account for the loss of a positive association between the number of adults present and the number of groups (Blatchford et al., 1999).
child concentration and contribution. The results show that one consequence of larger classes is in terms of more and bigger groups in the class.
Closer analysis of the relationship between class size and within class group size showed that there was little difference in the number of individuals, dyads, triads or small groups of 4-6 pupils in classes of different sizes, but that in class sizes over 25 there is more likelihood of a pupil being in a large group of 7-10, while in classes under 25 there is, if anything, more likelihood of being in a very large group of 11 and over, which will include whole class groupings and teaching. There is relatively little likelihood of children in classes under 25 being in groups of 7-10. These results are particularly true of the Reception year. This shows that children in large classes, especially at Reception, are taught and work in larger groups of 7-10 children. A main result from the study, therefore, is that it in larger classes, especially with youngest Reception aged children, teachers seem forced to teach them in larger groups of 7 -10, larger than, according to their own preferences, they would like. Children were less likely to work together in larger groups. The qualitative analyses indicated that larger groups were a less effective educational environment: it was difficult to give children the attention they might want and need from the teacher, and quality of teaching could suffer; the quality of children’s work was lower; and their contribution and concentration in groups could suffer, perhaps especially in the case of the youngest children. In the words of one of the teachers, quoted in the results, in smaller groups there were ‘more opportunities to experience a “hands on” approach to their learning’. It seems fair to be concerned that one consequence of larger classes is the likelihood of larger, less educationally effective groups. These results are consistent with Molnar et al’s 1999 evaluation of the Wisconsin SAGE program, which, on the basis of first and second grade teacher interview and questionnaire responses, found that reduced pupil teacher ratios led to more individual attention and student participation in class, deeper knowledge of individual students' personality and progress. Lou et al. (1996) also found, on the basis of their meta-analysis of within-class grouping studies, that smaller group sizes were optimal for students' learning; larger groups of 6 to 10 members were less effective.
It might be argued that one solution to the teacher's difficulties with large classes would be to alter her approach so that there is more teaching to larger groups or the whole class. This may be possible in some curriculum areas, and for some activities, but will inevitably be of limited relevance to primary aged children, especially the youngest children, who may be more easily distracted. We have seen some evidence that in smaller classes there is, if anything, more whole class teaching. This result needs to be treated cautiously as the number of cases where this was happening were low (21 cases in classes of fewer than 20 pupils), and possible explanations can only be speculative at this stage. Anecdotal observations suggest that in smaller classes teachers have more flexibility to address or teach larger groups for particular occsions and purposes, while in a larger class they may be forced into a less flexible
Another consideration concerns the greater likelihood of heaving adult help at Reception level in larger classes (see Blatchford et al., 1999), and where there are more groups in a class. It may be that with extra help in the class the teacher sets up more large groups (of 7-10). She may even feel obliged to give the adult assistant a group of children – otherwise the assistant may just be sitting around waiting for the whole class session to end.
It is recognised that there are validity issues connected to qualitative component in that it relies heavily on teachers' perspectives and reported experiences. We are not able to test the relationship between grouping practices and learning in other more objective ways, so the connections identified in this paper have to be treated with caution; nevertheless, the consistency of results stemming from quantitative and qualitative components supports the plausibility of the argument developed in this paper.
Class size thresholds
The present results bear on issues concerning class size bands beyond which, or below which, effects can be seen to work. Much of the debate in the UK has been about the adverse effects of large classes over 30. The present UK Government policy on class size in England and Wales involves a commitment to maximum class sizes of 30 at Key Stage 1 (4-7 years). In the USA, the STAR project (Finn & Achilles, 1999) and research reviews (e.g. Slavin, 1990b), indicate that class size reductions below 20 are necessary before sizeable effects on student performance are seen. The present results indicate the value in looking at effects across the full distribution of class size bands. In the case of associations between class size and size of group, at Reception level, there is a suggestion that 25 in a class is an important threshold.
Modelling class size effects
As said earlier, conceptualisation of class size effects has not to date been very
sophisticated. While the present study has not modelled, statistically, causal pathways with educational outcomes, the results presented in this paper do indicate a linkage between class size and groupings in the class, and that any causal pathway would need to recognise this mediating variable. Our results suggest that class size affects the size and number of groups which may then affect the learning experiences and social relationships in classes, which may in turn affect children’s attainment. One implication is that while debate about size of class has often been in terms of reduced size of class resulting in pupil academic gains, it is also important, educationally, to consider grouping size, and to ask about the optimum group size, and its effects. This was nicely expressed by the teacher quoted above, who said that her daily routine was not affected by the number of children in the class but by the size of groups she worked with at any one time.
responsibility is then attached to the teacher. But in terms of the classroom contextual influences described here, this argument is far too simplistic. Teachers will of course vary in their effectiveness, but the size of the groups in the class necessarily affect what a teacher has to deal with, and can present her with choices and the need for compromises.
More work is needed on ways that micro classroom contexts like grouping affect learning. There are implications here for research on effective schooling and teaching. Such research has not paid much attention to classroom context effects and their implications for learning, or made use of conceptual models like Kounin & Gump (1974). One avenue for future research is further clarification of links between class level and within class level contexts. School and teacher effects will necessarily be mediated through activities and micro settings within classrooms.
NOTE
I There are different ways of viewing and using data on group size. The method used in this paper is
based on the number of children in each of the groups; that is, the prevalence of a group is weighted in terms of the number of children it contains. This is probably the best measure of the likelihood that a
child will experience a group of a given size and is used in this paper. If this method is not used and groupings are considered equally (regardless of their size) then small groupings bias the data set in their favour. For instance, a class of small groupings will contribute more cases to the data set than one
References
Alexander, R., Rose, J. & Woodhead, C. (1992) Curriculum Organisation and Classroom Practice in Primary Schools: A Discussion Paper. London:DES.
Baines, E., Blatchford, P., & Kutnick, P. (2000). Grouping practices within primary school classrooms: Changing patterns with pupil age. Proceedings of the British Psycholigical Society, Vol. 8 (1), 27.
Baines, E., Blatchford, P., & Kutnick, P. (2001). Changes in grouping practices over the primary years. Manuscript in preparation.
Barker, R , (1968) Ecological Psychology. Stamford, CA: Stamford University Press
Bennett, N. & Dunne, E. (1992) Managing Groups. Hemel Hempstead: Simon & Schuster Education.
Blatchford, P., & Martin, C. (1998) The Effects of Class Size on Classroom Processes: ‘It’s a bit like a treadmill - working hard and getting nowhere fast!’
British Journal of Educational Studies, Vol. 46, No. 2
Blatchford, P. & Mortimore, P. (1994) ‘The Issue of Class Size for Young Childrenin Schools: what can we learn from research?’ Oxford Review of Education, Vol. 20 No. 4, p. 411 - 428.
Blatchford, P., Goldstein, H., & Mortimore, P. (1998) Research on class size effects: a critique of methods and a way forward. International Journal of
Educational Research, 29, p.691-710.
Blatchford, P., Kutnick, P. & Baines. E. (1999) The Nature & Use of Classroom Groups in Primary Schools. Final Report to ESRC
Bronfenbrenner, U. (1979) The Ecology of Human Development: Experiments by Nature and Design. Cambridge, Mass.: Harvard University Press
Doyle, W. (1986) Classroom Organization and Management. In M.C. Wittrock (ed.) Handbook of Research on Teaching, 3rd Edition. New York: Macmillan.
Finn, J.D. & Achilles, J.D. (1999) Tennessee’s Class Size Study: Findings, Implications, Misconceptions. Educational Evaluation and Policy Analysis (1999), Vol. 21, No. 1, p. 97-125.
Fuchs, L., Fuchs, D., Kazdan, S., Karns, K., Calhoon, M., Hamlett, C., & Hewlett, S. (2000). Effects of work group structure and size on student productivity during collaborative work on complex tasks. Elementary School Journal, 100(3),
Galton, M., Simon, B, & Croll, P. (1980). Inside the Primary Classroom. London: Routledge & Kegan Paul.
Goldstein, H. (1995) Multilevel Statistical Models. London: Edward Arnold. Goldstein, H. and Blatchford, P. (1998) Class Size and Educational
Achievement: a review of methodology with particular reference to study design. British EducationalResearch Journal, 24, 3, p.255-268.
Grissmer, D. (1999). Class size effects: Assessing the evidence, its policy implications, and future research agendas, Educational Evaluation and Policy Analysis, 21(2),231-248
Hanushek, E.A. (1999) Some findings from an independent investigation of the Tennessee STAR experiment and from other investigations of class size effects.
Educational Evaluation and Policy Analysis, 21, 2, p.143-163.
Johnson, D. & Johnson, R. (1987) Learning Together and Alone. Englewood Cliffs: Prentice-Hall.
Kounin, J.S. & Gump, P.V. (1974), Signal systems of lesson settings and the task-related behaviour of pre-school children. Journal of Educational Psychology, 66, 4, 554-562.
Kutnick, P. (1994) Use and Effectiveness of Groups in Classrooms. In P. Kutnick & C. Rogers (eds.) Groups in Schools. London: Cassell.
Kutnick, P., Blatchford, P., & Baines, E. (2001). Pupil groupings in primary school classrooms: Sites for learning and social pedagogy? Manuscript in
preparation.
Lou,Y., Abrami, P.C., Spence, J.C., Poulsen, C., Chambers, B., and
D'Apllonia, S. (1996) Within-class grouping: a meta-analysis. Review of Educational Research, 66,
4 , 423 - 458
Molnar, A., Smith, P., Zahorik, J., Palmer, A., Halbach, A., and Ehrle, K. (1999) Evaluating the SAGE program: a pilot program in targeted pupil-teacher reduction in Wisconsin. Educational Evaluation and Policy Analysis, 21,2,165-177
Mortimore, P. & Blatchford, P. (1993) ‘The Issue of Class Size’. In National Commission on Education (1993) Briefings (pp.167-182). (London: Heinemann)
OFSTED (1995a) The Annual Report of Her Majesty’s Chief Inspector of Schools, Standards and Quality in Education 1993/4. London, HMSO.
Pellegrini, A. and Blatchford, P. (2000) Children’s Interactions at School: Peers and Teachers. London: Edward Arnold.
Prais, S.J. (1996) Class size and learning: the Tennessee experiment - what follows? Oxford Review of Education, 22, 399-414
Shapson, S.M., Wright, E.N., Eason, G. & Fitzgerald, J. (1980) An experimental study of the effects of class size. American Educational Research Journal, 17, pp. 144-52
Slavin, R. E. (1990a) Co-operative Learning. In Rogers, C. and Kutnick, P. (eds) The Social Psychology of the Primary School. London: Routledge.
Slavin, R. E. (1990b) Class size and student achievement: is smaller better?
Contemporary Education, 62, pp.6-12
Tizard, B., Blatchford, P., Burke, J., Farquhar, C. & Plewis, I. (1988) Young Children at School in the Inner City. Hove: LEA.
Table 1: proportions (and frequency) of classes at each year group with different registered class sizes and overall mean class size re-gistered.
Year group Class size registered
0-20 21-25 26-30 31+ Total Class size
registered
% n % n % n % n % n Mean S.D.
Reception 14 66 25 120 43 209 18 89 72 484 26b 5.5
Year 2 7 6 20 18 46 41 28 25 14 90 28a 4.2
Year 5 7 7 26 25 46 44 21 19 14 95 27ab 4.6
Total 14 79 32 163 44 294 20 133 100 669 27 5.3
Chi-square χ2(6) = 9.46; p< 0.149
ANOVA F(2,666)=5.48;
p<0.01
Table 2: Mean number of groups by registered class size and year group
Class Size registered
Year group
Reception Year 2 Year 5
Total
Mean S.D. n Mean S.D. n Mean S.D. n Mean S.D. n
10 to 20 3.2a 1.5 66 4 2.4 6 3.4 3.1 7 3.3a 1.8 79
21 to 25 3.9a 1.9 120 5.2 2.4 18 6.2 3.6 25 4.4b 2.4 163
26 to 30 4.6b 1.8 209 5.3 2.1 41 6.4 3.6 44 5.0c 2.3 294
31+ 5.4c 2.3 89 5.9 2.5 25 6.4 3.4 19 5.6d 2.5 133
Total 4.4a 2.0 484 5.3b 2.3 90 6.1c 3.6 95 4.7 2.4 669
Correlation r=0.29; n=484; p<0.001 r=0.19; n=90; p<0.05 r=0.18; n=95; p<0.05 r=0.26; n=669; p<0.001
ANOVA -
Linear trends F(1,480)=58.6; p<0.001 F(1,86)=3.4; p=0.069 F(1,91)=3.65; p=0.059
ANOVA F(2,657) = 11.72; p<0.001
F(3,657) =8.21; p<0.001
Table 3: Mean size of groups in relation to registered class size and year group
Year Group
Class Size Reception S.D. Year 2 S.D. Year 5 S.D. Total S.D.
0-20 4.8a 3.3 4.7 4.7 3.4 4.4 4.6a 3.6
21-25 5.6ab 4.4 4.6 5.6 3.8 4.0 5.1ab 4.5
26-30 5.7b 3.9 5.2 4.3 4.3 4.4 5.4b 4.1
31+ 5.6ab 4.4 5.5 5.4 4.8 4.3 5.4b 4.6
Total 5.6a 4.1 5.1a 4.9 4.2b 4.2 5.3 4.3
Correlation r=0.11; n=2091;
p<0.001
r=0.14; n=476; p<0.01
r=0.23; n=580; p<0.001
r=0.114; n=3147; p<0.001
ANOVA Linear
Trends* F(1,2087)=4.72;p=0.03 Not Significant F(1,576)=3.33;p=0.069 F(1,3143)=7.61;p<0.01
ANOVA** F(2,3151) = 22.88;
P<0.001 * ANOVAs are across class sizes within each age level ** ANOVAs are across age groups
Table 4: Class size as category (31+) * group size as a category crosstabulation
group size as a category
registered class size
Individuals dyads triads 4-6s 7-10s 11+ Total
0-20 1.8% 8.3% 8.8% 48.9% 6.3% 26.0% 7%
21-25 1.5% 6.6% 6.4% 50.2% 9.3% 25.9% 22%
26-30 1.0% 4.8% 4.3% 50.2% 24.3% 15.4% 46%
31+ 1.2% 5.1% 5.3% 44.6% 25.8% 18.0% 24%
Total 1.2% 5.5% 5.4% 48.7% 20.1% 19.1%
Table 5: proportion (and frequency) of different sized groupings that participated in different types of interaction and working arrange-ments (Years 2 & 5 only).
Type of interaction Working
alone Working alone but on the same task as group
Working together to produce a group
product
Interacting with teacher
and rest of class/group Total
Group size % % % % %
individuals 33% 67%* - - 10%
dyads - 76% 24% 1% 23%
triads - 67% 31% 3% 11%
4-6s - 81% 14% 5% 46%
7-10s - 79% 6% 15% 7%
11+ - 10% 0% 90% 4%
Total 3% 74% 15% 8% 100%
Chi-square χ2 (15) = 808.1; p<0.001
Table 6: proportion (and frequency) of different sized groupings that participated in different types of interaction and working arrange-ments (Years 2 & 5 only).
Type of interaction Working
alone
Working alone but on the same task as
group
Working together to produce a group
product
Interacting with teacher and rest of class/group
Total
Class Size % % % % %
0 – 20 1.3 55.7 4.8 38.2 4.7
21 – 25 0.5 61.0 12.8 25.7 20.2
26 – 30 0.8 62.4 15.3 21.5 46.0
31+ 0.5 67.7 8.0 23.8 29.0
Total 0.7 63.4 12.2 23.8
Chi Square χ2(9) = 85.27; p<0.001
Peter Blatchford et al