Contingency Analysis To Detect Weak links in the
Network
K Rachana Raj Dr. H R Sudarshan Reddy
PG Scholar Professor
Department of Power System Engineering Department of EEE
UBDTCE, Davangere, India UBDTCE, Davangere, India
Abstract
Power system is a large, interconnected and complex network. The security and stability is the most important factor for a system to work reliable. In order to make the system stable and secured the operator must minimize the outages occurring for this purpose contingency analysis is very important. The operator must have idea about violations that may occur in the system. So here work is done to identifying the weak links in the network by contingency analysis and then going to take necessary precautions to overcome the problem, i.e. strengthening the weak links. Mathematical model will outline the simulation done for identification of generator outages, transformer outages and transmission line outages so that contingency analysis and ranking has been done based on full AC load flow. Here generation outages and transmission line outages are of concern. This method is applied to the 35 bus system.
Keywords: AC Load Flow, Contingency Analysis and Ranking
________________________________________________________________________________________________________
I.
I
NTRODUCTIONPower system is vast and its complexity increases with the size of the system. System is usually operated under stressed condition and restricted stability margin. In order to make the system more reliable it should be taken care that outages or fault occurring has to be reduced. As the system operating conditions keeps varying with respect to time, its very important to predict the status of the system which would be difficult. This can be done by contingency analysis. A contingency means possibility of occurrence of the future event but cannot be predicted with certainty. Therefore we can define contingency analysis as the study of the outages of elements in the power system such as generators, transmission lines and transformers and to investigate the resulting effects on this on the bus voltages and line power flows of the remaining system. This is also useful in power system network design stage, during network expansion and during the maintenance.
By doing the contingency analysis, operator will get an idea about the components with has to be taken care or need more attention, so this will be helpful in taking necessary actions. Disturbance associated with the power system may cause serious troubles with short interval of time in case if operator fails to take necessary actions in time. In order to avoid this situations the modern power system is uses the fast computers equipped with contingency analysis programs which model the system and make sure that all the outages are studied and operator is notified in case of emergency.
There are various method that can be used to perform the analysis. The choice of the method or model is also important as it intern affects the system stability and security. Usually to widely used models are AC load flow and DC load flow. When accuracy and voltage magnitude is of concern AC load flow is preferred. When mega watt power flow is of concern DC load flow is preferred. AC load flow takes more time than DC load flow as accuracy is concerned so usually AC flow is run for critical outages. Contingency analysis can be modelled for single failure event or for the multiple failure event one after the other until credible outages are studied.
II.
M
ETHODOLOGYIn this method we perform the contingency analysis using the appropriate method, then we are going to simulate the outages of line and generating unit. Once the outage is created the contingencies are ranked based on there severity. The weak links in the network is determined and the strengthening of the network is done.
Proposed Algorithm: A.
Form the Y bus by inspection method.
Conduct load flow by Newton Raphson method.
Simulation of the line outages and generating unit outages is done. Rank the contingency based on APLPI method.
Once again obtain results for new flow limit.
Simulation of Line Outage and Generator Outage: B.
For the simulation of transmission line outages corresponding admittance matrix is formed. Lets consider there is an outage between the line connected between the buses a and b. here the representation is done based on the model.
Y`aa = Yab - (1/( Rab+ jXab)) - (jBab/2) Y`bb = Ybb - (1/( Rba+ jXba)) - (jBba/2)
Y`ab = Yab - (1/( Rab+ jXab)) Y`ba = Yba - (1/( Rba+ jXba)) Where,
Y`aa, Yaa : Post and pre-contingency self admittance at bus a. Y`bb, Ybb : Post and pre-contingency self adittance at bus b.
Y`ab = Y`ba : Post contingency mutual admittance between bus a and b. Yab =Yba : Pre-contingency mutual admittance between bus a and b.
The simulation for generating units can either be single unit or more in the system. Considering the total genartion for the station is Pnm at bus a, with the assumption the there exist identical(m) units, then
𝑃`ma = 𝑃ma − 𝑛 (𝑃ma/m) Where,
P`ma: Active power generated at bus a after the outage. Pma: Active power generated at bus a before the outage. n: Number of outage generation units in the station. Pma/m: Active power generated at bus a per generator unit.
Contingency Ranking: C.
The method used for contingency ranking is active power loading performance index (APLPI). This is one of the fast and accurate method for contingency ranking which utilises a system wide scalar PI to quantify the severity of each contingency, this is done by using AC load flow by calculating the post contingency bus voltages and line flows. The exponent of the performance index is changed from 2 to 30 in order to address the masking errors. The contingencies obtained are ranked based on their severity i.e., most sever line at the top of the list and less severe at the bottom. The line flow violation and voltage violation is considered for the performance index calculation.
This method is straight forward and in this study on the basis of line loading contingencies are ranked. The performance index will be the accumulation of the post contingency line flow over the line limits. The value of this fraction will be grater than one if the transmission line is overloaded. There are two possibilities that may occur i.e., if many lines are operating nearer to their limits the values of APLPI will be greater while another possibilities is that even though the line is overloaded but the value of APLPI is small. This is called as masking error, in order to avoid it the value of m has to be increased.
APLPI is the active power loading performance index corresponding to line real power flow violations. It is formulated as below and gives measure of line MW overloads
𝑃 𝑃 ∑ (𝑃 𝑃 ) Where,
Pipc : The post-contingency active power flow on line (i) PiLim : The active power flow limit on line (i)
Wpi : The weight factor of active power flow on line (i) NL : Number of transmission lines.
M : Is a positive integer.
III.
C
ALCULATION OF WEIGHT FACTOR BY FUZZY LOGIC APPROACHFor Line Loadings: A.
Obtained each post-contingent quantities of line loadings are considered in terms of percentage. Fuzzy set notation is divided into following four categories. They are,
With 0-50% of load is regarded as lightly loaded (LL), With 50-80% of load is regarded as normally loaded (NL), with 85-100% of load is regarded as fully loaded (FL),Aabove 85-100% of load is regarded as overloaded (OL).
Similarly the membership functions for the output of these quantities have also been described using Fuzzy set notation and is divided into following four categories for the evaluation of the severity of a post-contingent quantity. They are,
1) Less severe (LS), 2) Below severe (BS), 3) Above severe (AS) and 4) More severe (MS)
After getting severity indices for all lines loadings, the weighting coefficient used for different severity indices used are : w= 0.25 for severity index which is Less Severe (LS).
= 0.50 for severity index which is Below Severe (BS). = 0.75 for severity index which is Above Severe (AS). = 1.00 for severity index which is Most Severe (MS).
The effect of these weighting coefficient is first dominated by fourth category of severity index (MS) next by third, second and first category of severity index respectively. The severity of a system with contingency occurring in it is indicated by overall severity index.
For Bus Voltage Profiles: B.
In this, each post-contingent quantity of bus voltage profiles are classified into three categories as follows using fuzzy set notations. They are,
1) Low voltage, for voltage below 0.9pu (LV), 2) Normal voltage, for voltage 0.9-1.02pu (NV) and 3) Over voltage, for voltage above 1.02pu (OV).
Post-contingent quantity severity is divided into three categories using fuzzy set notations. The evaluation is done by using output membership functions as below. They are,
1) Below severe (BS), 2) Above severe (AS) and 3) More severe (MS)
The weighting coefficient used for indicating the severity indices are w = 0.30 for BS (Below Severe)
= 0.60 for MS (Most Severe) = 1.00 for AS (Above Severe)
IV.
R
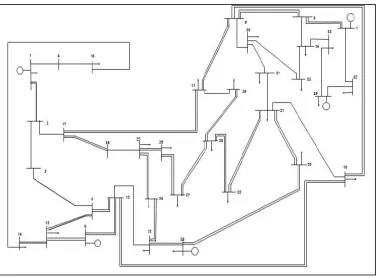
ESULTSFig. 1: 35 Bus Systems
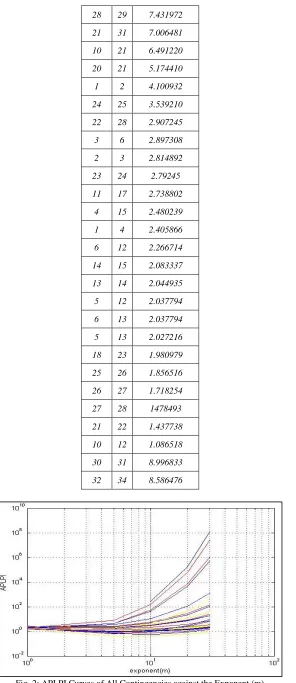
Results of Contingency Ranking Using APLPI Method: A.
Forty three contingencies have been done and the results of contingency ranking are shown in below Table(1). The curves of all contingencies in figure (2) shows the APLPI against the exponent (m) and it is seen that for severe contingencies the value of APLPI increases with (m).
Table – 1
Contingency Ranking Using APLPI Method
From To With m=30
8 34 1.264179 X 10⁸
7 35 2.452902 X 10⁷
19 35 1.077346 X 10⁶
8 9 5.117807 X 10⁵
19 33 1.482570 X 10⁴
12 23 1.232048 X 10³
30 32 4.503158 X 10²
18 20 1.467943 X 10²
9 10 1.029317 X 10²
9 11 6.512829 X 101
9 30 3.783353 X 101
16 17 3.711314 X 101
16 25 2.370971 X 101
11 29 1.900981 X 101
2 17 1.846212 X 101
28 29 7.431972
21 31 7.006481
10 21 6.491220
20 21 5.174410
1 2 4.100932
24 25 3.539210
22 28 2.907245
3 6 2.897308
2 3 2.814892
23 24 2.79245
11 17 2.738802
4 15 2.480239
1 4 2.405866
6 12 2.266714
14 15 2.083337
13 14 2.044935
5 12 2.037794
6 13 2.037794
5 13 2.027216
18 23 1.980979
25 26 1.856516
26 27 1.718254
27 28 1478493
21 22 1.437738
10 12 1.086518
30 31 8.996833
32 34 8.586476
Strengthening the Weaklinks: B.
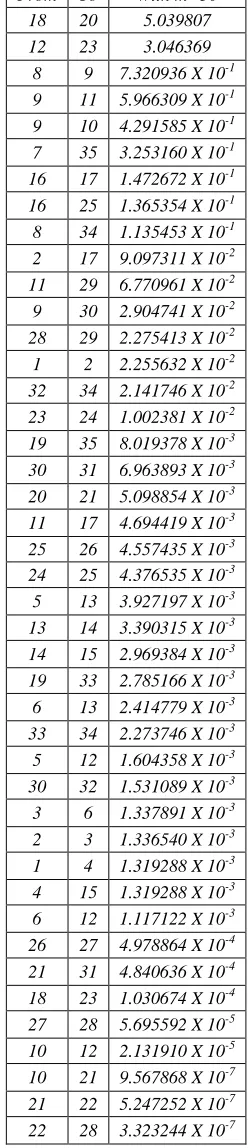
To strengthen the network and improve its flow security the weak transmission lines and transformers power handling capacity should be increased. After increasing the capacities once again APLPI ranking is done. Figure (3) shows APLPI curves of all contingencies against the exponent (m) after increasing weak elements capacity, it is clear that values of APLPI here decrease when (m) increases.
Table – 2
Contingency Ranking Using APLPI Method after Increasing the Capacities of the weaklinks From To With m=30
18 20 5.039807 12 23 3.046369
8 9 7.320936 X 10⁻¹ 9 11 5.966309 X 10⁻¹
9 10 4.291585 X 10⁻¹ 7 35 3.253160 X 10⁻¹ 16 17 1.472672 X 10⁻¹ 16 25 1.365354 X 10⁻¹ 8 34 1.135453 X 10⁻¹ 2 17 9.097311 X 10⁻²
11 29 6.770961 X 10⁻² 9 30 2.904741 X 10⁻² 28 29 2.275413 X 10⁻² 1 2 2.255632 X 10⁻² 32 34 2.141746 X 10⁻² 23 24 1.002381 X 10⁻²
Fig. 3: APLPI Curves Of All Contingencies Against The Exponent (M) After Increasing Weak Elements Capacity.
V.
C
ONCLUSIONContingency analysis is performed for 35 bus system and the weak links in the system is detected and the new capacities have been suggested. The new capacities ensure better power system security for both single contingency or any of the set of multiple contingencies that is occurring in the system.
R
EFERENCES[1] Mohamed, S. E. G., Mohamed, A. Y., and Abdelrahim, Y. H.,(2012) “Power System Contingency Analysis to detect Network Weaknesses”. [2] Wood, A. J.; Wallenberg, B. F.,(1996) “Power Generation, Operation and Control”.
[3] K. Nara, K. Tanaka, H. Kodama, R. R. Shoults, M. S. Chen, P. Van Olinda and D. Bertagnolli.,(1985)“On-Line Contingency Selection for voltage Security Analysis”.
[4] F. Albuyeh, A. Bose and B. Heath.,(1982) “Reactive Power Considerations in Automatic Contingency Selection”..
[5] A. Narendranatha Udupa, D. Thukaram, K. Parthasarathy.,(1999) “An expert fuzzy control approach to voltage stability enhancement”.