Analysis of Load Factors Based on Interpretive
Structural Model
Li Yanmei
School of Business and Administration, North China Electric Power University, Baoding 071003, China Email: [email protected]
Li Yanmei, ZI Chen
School of Business and Administration, North China Electric Power University, Baoding 071003, China
Abstract—There are so many factors of power load. The paper proposed a method of interpretive structural model that is used to analysis the factors of power load. Determine the factors of power load, establishing the interpretive structural model, seeking the solution of ratability matrix, and analyzing the relationship between various factors, finding the surface, middle and deep factors. Take risk factors which influence the power load as the objects of study, building a hierarchical structure chart and the risk transmission chain of the risk system, establishing power load forecasting model with ISM-based risk analysis. Verifying the effectiveness of the method by simulation and providing decision basis for risk management of power load forecasting.
Index Terms—power load, interpretive structural model, risk, forecasting
I. INTRODUCTION
Electric load means the power consumption of electrical equipments. According to the load characteristics of different users, the electric loads can be divided into industrial load, agricultural load, transport load and electricity load of living etc. The load change is affected by economic development, population, weather, industrial restructuring and energy policy etc. Finding and analyzing the load factors by interpretive structural model, rationalizing the relationship between various factors, gripping the deep factors and emphasis, the paper may provide reference for load forecasting.
Interpretative structure modeling(ISM) is a system architecture modeling method, mainly used to analysis the relationship (including one-way or two-way causality, size relationship, exclusion relationship, correlativity, affiliation or possessive relationship, etc.) between a large number of elements composed of the complex systems, which is expressed in the form of the multilevel hierarchical structure. ISM has been widely used in risk systems of the power supply and power generation enterprise in the field of power systems and used in structure model of general power system and demand side management risk system and used in many other aspects. Complex system can be layered to visually see
the level and interaction between various factors within the system by building hierarchical structure chart of the system with ISM, which provides deciding reference for system management.
In this paper, firstly studying various risk factors which influence the power load, building a hierarchical structure chart and the risk transmission chain of the risk system, then establishing power load forecasting model with ISM-based risk analysis and giving empirical analysis.
II.INTERPRETIVESTRUCTUREMODEL
A Introduction of Interpretive Structure Model
Interpretive structural model was developed by American Professor J. N. Warfield in 1973, which is a method used to analyze complex structure problem of socio-economic system. Interpretive structural model is an analysis method widely used in modern system engineering, which divides complex system into several sub-elements and constitutes multi-level hierarchical structure model supported by people’s practical experience knowledge and computers. This model can change fuzzy thoughts into intuitive model of well-structured relations that is structural model based on qualitative analysis. The model is suitable for system analysis which has many variables and complex structure, and also which is used to the ranking of alternatives. The method is widely used from energy problem to regional economic development etc.
B The Steps of Establishing Interpretive Structural Model
ISM is characterized by decomposing the complex system into several subsystems, and ultimately constructing the system into a multilevel hierarchical ISM with people's practical experience and theoretical knowledge and computer help.
First, sorts out the constituent elements of the system, determine system factors set, denoted as:
r
i
n
N
i
1
,
2
,
,
Second, forms consciousness model
Determine the existence of a direct binary relation between any two factors in factors set, a direct binary relation between any two factors ri and ri can be expressed as:
j factor on effect no has i factor 1
j factor on effect no has i factor 0
ij
a
Third, generates adjacency matrix. Summarize the relationship between any two elements into the form of adjacency matrix A by comparing the elements one by one on the basis of understanding the elements of system and providing relationship between any two elements.
Fourth, generates reachability matrix. Matrix is a square that the system can reach any time to pass between the elements or binary relation between two nodes on the graph from any long path to arrive. The generation method is: the adjacency matrix A and matrix I sum of matrix A + I do exponentiation, until eq. (1) holds.
A I
A I
A I
A I
M n1 n 2 (1)
Exponentiation is based on Boolean algebra, n is for the long road to reach the matrix, that is the maximum transfer that the number of loop-free, the matrix M = (A + I) n is called reachable matrix, characterized by direct and indirect relationship between elements.
Fifth, divides matrix levels. Class division is to divide different factors into different levels. Set of factors affected by factors ri is defined as reachable set P (ri) of factors ri. Set of influence factors ri is defined as antecedent set Q (ri). If P (ri) ∩Q (ri) = P (ri), then ri is the most senior factors, that is factors that meet the conditions are at the same class L1. And so on, to get different classes L2, L3, and ⋯
Sixth, establishes ISM. Draw multilevel hierarchical directed graph on the basis of matrix class division to generate ISM.
Seventh, generates risk transmission chain. Generates risk transmission chain based on class structure chart.
C Power losd forecasting model based on ISM On the basis of class structure chart and risk transmission chain of risk factors which affect urban electricity, establish urban power demand forecasting model with ISM risk analysis, the model is as follows:
x f x PQ R Q
Q ijk
i m
j n
k ijk i
m
j
ij
4
1 1 1 0
4
1 1 0
. Among it, Q is said as power demand forecasting value
with taking into account the risk, Q0 is as power demand forecasting value without taking into account the risk,
4 , 3 , 2 , 1
i is said as the first, second, third industry and
residential power demand, j1,2,,m is said as m risk transmission chains of urban power demand, k1,2,,n
is said as n risk profiles, Rij is said as risk affecting value
of the j-th risk transmission chain on the first, second,
third industry and residential power demand, Pijk x and
x fijkare said as influence functions of risk source x of the j-th risk transmission chain which affects the first, second, third industry and residential power demand on probability of the k-th risk profiles and on the power demand respectively. Influence function is based on different affecting features of different transmission chain on power demand and experts experience.
III. POWER LOAD FACTORS
Power load risk factors mainly include demand side management factors, energy market factors, economic factors, climate and demographic factors according to risk source; and affect power load via the first, second, third industry and residential power demand according to electrical properties. This paper decides the risk factors of urban power demand with Delphi method, and gets seven major risk factors ultimately: 1) demand side management, 2) adjustment of energy market and energy policy, 3) economic factors, 4) national macro-industrial structure adjustment, 5) the price of electricity and alternative energy, 6) climate and demographic factors, 7) scientific and technological progress.
A Demand Side Management
In recent years, countries in the world adapt Demand Side Management, recognizing the demand for electricity can be changed. Demand-side management can take measures to make the occurrence of a large power load curve changes in the electricity sector, users and society benefit under the conditions of meeting production and life needs.
B Energy Markets and Energy Policy Adjustments
From the entire energy consumption market, the electricity market is just one component. In fact, it is something with the user types and quantities of energy consumption and energy prices and ease of use. Under certain conditions, users choose their power consumption and other energy consumption may change the proportion, sometimes even completely reversed. For example, the increase of pipeline gas prices will rapidly increase residential electricity load. Electricity prices remain high or uncompleted power supply network will result in the reform from electrical energy consumption of rural users to other energy consumption.
So the power consumption and other energy consumption are closely related. Domestic or foreign sources of energy price adjustment will have some impact on electric load.
C EconomicFactors:
decline trends. In addition, the power system management policies, such as the load side management and pricing policies and other factors will also affect the load changes. The impact of economic factors on the load a long time, generally at least longer than a week. Changes in seasonal and annual changes, load forecasting based on these factors and make the appropriate correction value is very important;
D. The National Macro-adjustment of Industrial Structure
National macro-adjustment of industrial structure changes will inevitably impact on electricity demand, power consumption which accounts for a large proportion of secondary industry declined every year, the relative power consumption of the tertiary industry rose, so that the whole unit of GDP energy consumption levels continues to decline
E. The Price of Electricity and Alternative Energy
The price of power will affect power demand. It will not only affect the demand for electricity, it will also affect the industry. Under certain conditions, the proportions of users’ choose for their power consumption and other energy consumption may change, sometimes even completely reversed. For example, the natural gas price increases will rapidly increase in residential electricity load. Electricity prices remain high or uncompleted power supply network will result in the reform from electrical energy consumption of rural users to other energy consumption.
F. Climate, Demographic Factors
As the world climate anomalies for cooling and heating power consumption considerably, and mostly concentrated in the period of time, it often becomes the formation of peak load in summer or winter, one important factor. Meanwhile, strong uncertainties of climate change have a strong impact on the demand side. The number of population will significantly impact on power demand. In addition, the structure of the population, family size, and the characteristics of residential areas will also affect the demand for residential electricity consumption.
G Scientific and Technological Progress
Electricity production and power consumption of technology, on the one hand it improves the energy efficiency, and reduced power consumption, lower cost of electricity. Electricity and other energy efficiency will lead to comparative national economic development and improve people's living standard electrification. On the other hand, it can save electricity and meet the needs of the people in the same conditions. Electricity science and technology, the impact on demand for electricity has positive from negative, but overall, advances in technology are always moving in the direction of electrification, but this growth rate is also uncertain.
IV. ESTABLISHINTERPRETIVESTUCTURE MODELOFRISKFACTORS
A Establish the Interpretive Structure Model
We should gain a clear idea of the logical relationship between the factors and obtain the adjacency matrix for modeling the interpretive structural model of system. The
element aij of adjacency matrix A is defined as:
When there is relationship between the two elements,
ij
a
is represented by 1, otherwise it is showed by 0.
B on effect no has A when B on effect has A when aij 0 1
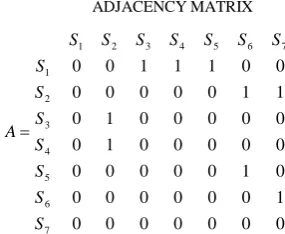
Accordingly, the adjacency matrix A obtained by ISM team is showed as follows:
TABLE I. ADJACENCYMATRIX 0 0 0 0 0 0 0 1 0 0 0 0 0 0 0 1 0 0 0 0 0 0 0 0 0 0 1 0 0 0 0 0 0 1 0 1 1 0 0 0 0 0 0 0 1 1 1 0 0 7 6 5 4 3 2 1 7 6 5 4 3 2 1 S S S S S S S S S S S S S S A
Obtaining the adjacency matrix, we can get the reachability matrix through the calculation of evolution. According to the operation rule of Boolean algebra, when
AI
k1
AI
k AI
k1M , M is the reachabilitymatrix that we want to obtain. The calculation result is
4 3 A
A ,so the reachability matrix MA3, which is
shown as TABLE. II.
TABLE II.
REACHABILITYMATRIX
A I
MS S S S S S S S S S S S S S I
A 3
7 6 5 4 3 2 1 7 6 5 4 3 2 1 4 1 0 0 0 0 0 0 1 1 0 0 0 0 0 1 1 1 0 0 0 0 1 1 0 1 0 1 0 1 1 0 0 1 1 0 1 1 0 0 0 1 0 1 1 1 1 1 1 1
B Domain Decomposition of the Reachability Matrix
a) Introduction of several related definitions
1) Reachability collectionR
Si : The column elementcollections that matrix elements including the number 1 correspond to the line elements Si of reachability matrix,
which expresses the elements that Si reach.
3) Intersection AR
Si Q
Si : In order to do domaindecomposition, we first list all the reachability collection, first collection and intersection, which are shown as TABLE. III
TABLE III.
REACHABILITYCOLLECTION,FIRSTCOLLECTIONAND
INTERSECTION
i R(Si) Q(Si) R(Si)∩Q(Si)
1 1,2,3,4,5,6,7 1 1
2 2,6,7 1,2,3,4 2
3 2,3,6,7 1,3 3
4 2,4,6,7 1,4 4
5 5,6,7 1,5 5
6 6,7 1,2,3,4,5,6 6
7 7 1,2,3,4,5,6,7 7
b) Domain decomposition of reachability collection
According to the decomposition result of reachability collection, first collection, we can see that in the first
collection Q Si ,S1 andS3,S1 andS4 S1andS5, they
have strong direct relation, and there are direct relation betweenS2andS3,S4.So we adjust the position of line
and column of reachability matrix M,that is to put
2 5 4 3
1、S、S、S、S
S together, which are shown as TABLE.
IV.
TABLE IV.
ADUSTMENTOFLINEANDCOLUMNOFREACHABILITY
MATRIXANDDOMAINDECOMPOSITION
1 0 0 0 0 0 0
1 1 0 0 0 0 0
1 1 1 0 0 0 0
1 1 0 1 0 1 0
1 1 0 0 1 1 0
1 1 0 0 0 1 0
1 1 1 1 1 1 1
7 6 2 5 4 3 1
7 6 2 5 4 3 1
'
S S S S S S S
S S S S S S S
M
Ⅰ
Ⅱ
Ⅲ
Ⅳ
The four parts of
M
'
separated by dashed line express: Matrix Ⅰ in the upper left corner expresses adjacencymatrix (A) composed by elements S1、S3、S4、S5.
Matrix Ⅳ in the lower right corner expresses
adjacency matrix (B) composed by elements S2、S6、S7.
Matrix Ⅱ in the upper right corner expresses the influence of (A) to (B).
Matrix Ⅲ in the lower left corner expresses the influence of (B) to (A).
The elements 0 expresses that there is no influence of (B) to (A).
Level of decomposition
The way of level of decomposition is to extract level according to the rule of R
Si QSi RSi , which isshown as Tab.4.If i=7 satisfy the condition, which means
7
S is the top level of the system, also the ultimate goal.
Then we extract the elements related 7 and obtain TABLE. V
TABLE V.
THERESULTOFEXTRACTEDELEMENT7
i R(Si) Q(Si) R(Si)∩Q(Si)
1 1,2,3,4,5,6 1 1
2 2,6 1,2,3,4 2
3 2,3,6 1,3 3
4 2,4,6 1,4 4
5 5,6 1,5 5
6 6 1,2,3,4,5,6 6
We can see from Tab.5 that i6 satisfies the condition, so to extract element 6, which are shown as
Tab. VI. It means S6is the second level and reason of
S
7.TABLE VI.
THERESULTEXTRACTED6
i R(Si) Q(Si) R(Si)∩Q(Si)
1 1,2,3,4,5 1 1
2 2 1,2,3,4 2
3 2,3 1,3 3
4 2,4 1,4 4
5 5 1,5 5
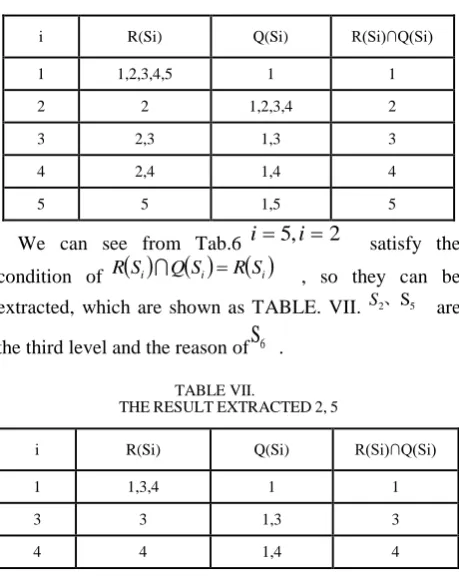
We can see from Tab.6
i
5
,
i
2
satisfy the condition of R
Si Q
Si R
Si , so they can beextracted, which are shown as TABLE. VII. S2、S5 are
the third level and the reason of
S
6 .TABLE VII.
THERESULTEXTRACTED2,5
i R(Si) Q(Si) R(Si)∩Q(Si)
1 1,3,4 1 1
3 3 1,3 3
4 4 1,4 4
We can see from Tab.7 i3,i4satisfy the condition of R
Si QSi RSi , so they can be extracted, whichare shown as TABLE. VIII. i3,i4 are the third level and the reason of S2、S5.
TABLE VIII.
i R(Si) Q(Si) R(Si)∩Q(Si)
1 1 1 1
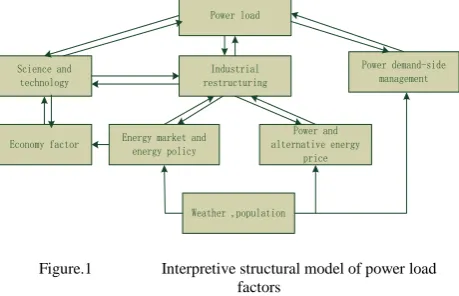
The relationship between layers is shown as Figure.1
Weather ,population Energy market and
energy policy
Power and alternative energy
price Economy factor
Science and technology
Industrial restructuring
Power demand-side management Power load
Figure.1 Interpretive structural model of power load
factors
C. Conclusion and Analysis of Power Load Factors ISM:
Figure 1 shows load factors model is a more than three level hierarchical model, starting from the deep through the hierarchical relationship between factors affecting the middle, shallow factors, and ultimately affects the load. Factors and their relationship are that economic factors are the most influential factors load factors, namely, underlying factors. Country's economic development directly affects electricity production and electricity consumption, advances in technology. Electricity science and technology, the impact on the power load both positive and negative, but overall, the advancement of technology is a step in the direction of electrification.
Climate conditions and changes in the number results in the formation of peak load period of time, not only influence people's demand for electricity, so that the power load changes, and also affects people of other energy sources such as natural gas demand. Electricity market is only a part of the energy market, power consumption and other energy consumption is closely related. The price level of alternative energy sources will affect the people's demand for electricity, which make the energy consumption structure change. Such as increase of natural gas prices will make residential electricity load increase rapidly.
Energy markets and energy policy changes are bound to affect the national macro adjustment of industrial structure. In recent years, a large proportion of secondary industry consumption declines year by year and the rise of relatively low power consumption of the tertiary industry finally the structure and load power consumption changes.
In this paper, structural model of the ISM is used to explain the impact of load factors and the relationship between various factors. Identify underlying factors that influence power load, intermediate factors and shallow factor .Making the development of adjustment measures should not only consider the surface of factors to consider, but more to consider the middle factors and underlying factors, grasp the principal contradiction, targeted to be
addressed and analyzed in order to find reasonable effective solution.
V. LOADFORECASTINGBASEDONISMRISK ANALYSIS
A Influence Function of Risk Trasmission Chain First, it’s need to identify the representative indicators of risk source of each risk transmission chain. According to data availability, in this paper, select GDP growth rate as risk transmission chain’s risk source indicator of economic factor, the highest monthly average temperature as risk transmission chain’s risk source indicator of climate and temperature, per capita income as risk transmission chain’s risk source indicator of electrovalency, gas price as risk transmission chain’s risk source indicator of other energy prices, resident population as risk transmission chain’s risk source indicator of population.
Second, identify probability distribution of representative risk indicator of each risk transmission chain.
Third, identify the influence function of each risk transmission chain on power demand. Choose influence
function based primarily on two principles: first, to be able to objectively reflect the actual affecting situation of
risk transmission chain on power load; second, to give full consideration to the feasibility of quantitative calculation. Based on the above principles, to determine
influence function of risk transmission chain on power demand with experts discussion and experience. According to the influencing characteristics of risk transmission chain on power demand, risk transmission chain can be divided into three categories, a total of five
kinds of influence functions, as shown in Figure 2
G f1G
(a) Influence function of economic risk transmission chain on power load
p f2
p
(b) Influence function of electrovalency risk transmission chain on power load
Y f3Y
p
p f4(d) Influence function of power prices risk transmission chain on power load
' 4 pf
'
p
(e) Influence function of other alternative energy prices risk transmission chain on power load
T f5
T
(f) Influence function of temperature risk transmission chain on power load
Figure.2 The five kinds of influence functions
Type 1 is a risk transmission chain of domestic and international economic situation. This type of risk transmission chain’s influencing characteristics on power demand is economic development faster, power demand greater, conversely, power demand smaller. Change of this process can be described with Elasticity Ratio of Electricity Consumption; we select eq. (1) to say influencing characteristics of risk transmission chain on power demand.;
0 01 Q
G G E G
f g
(1) Among it, G is the risk variation of GDP growth rate; 1
f
is influence function of G on power demand; G0 isbase GDP without taking into account G ; Eg is
Elasticity Ratio of Electricity Consumption.
Type 2 includes risk transmission chains of electrovalency, other energy prices and resident income. According to economics principle, with electrovalency rising, power demand will reduce, and change of the process can be described with coefficient of price elasticity of power demand; with other energy (such as natural gas) prices rising, power demand as an alternative energy (mainly residential electricity consumption) will rise, and change of the process can be described with coefficient of cross-elasticity of power demand; with resident income increasing, residential electricity demand will rise, and change of the process can be described with coefficient of income elasticity of power demand. We select eq. (2) to say influencing characteristics of electrovalency risk transmission chain on power demand.
00
2 Q
p p E p
f d
(2)
Among it,
p
0 is base electrovalency; p is risk variation of electrovalency; f2
p is influence quantityof p on power demand; Ed is price elasticity coefficient
of power demand.
Influence functions of resident income and other energy prices risk transmission chain on power demand growth rate are shown with eq. (3) and eq. (4) respectively.
00
3 Q
Y Y E Y
f Y
(3)
Among it, Y0 is base income; Y is risk variation of
income; f3
Y is influence quantity of Y on powerdemand;
E
Y is income elasticity coefficient of powerdemand.
' 00 ' '
4 Q
p p E p
f p
(4)
Among it, ' 0
p
is base price of other energy; 'p
is risk
variation of other energy price; f4
p' is influencequantity of p' on power load; EY is cross-elasticity coefficient of power demand.
Type 3 is a risk transmission chain of summer temperature. This type of risk transmission chain’s influencing characteristics is summer temperature higher, power load(mainly residential domestic temperature-fall power load) greater, conversely, power load smaller. Change of this process can be described with the elasticity coefficient of residential power load on the highest monthly average temperature in summer. We select eq. (5) to say the influence of this risk transmission chain on power load.
00
5 Q
T T E T
f T
(5)
Among it, T0 is base temperature; T is risk variation of summer temperature; f5
T is influence quantity ofT
on power load; EY is elasticity coefficient of power load on temperature.
B Simulation
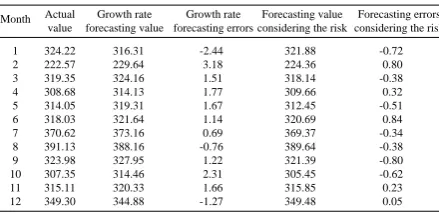
TABLE IX.
TYPE SIZES FOR CAMERA-READY PAPERS
Month Actual value
Growth rate forecasting value
Growth rate forecasting errors
Forecasting value considering the risk
Forecasting errors considering the risk 1
2 3 4 5 6 7 8 9 10 11 12
324.22 222.57 319.35 308.68 314.05 318.03 370.62 391.13 323.98 307.35 315.11 349.30
316.31 229.64 324.16 314.13 319.31 321.64 373.16 388.16 327.95 314.46 320.33 344.88
-2.44 3.18 1.51 1.77 1.67 1.14 0.69 -0.76 1.22 2.31 1.66 -1.27
321.88 224.36 318.14 309.66 312.45 320.69 369.37 389.64 321.39 305.45 315.85 349.48
-0.72 0.80 -0.38 0.32 -0.51 0.84 -0.34 -0.38 -0.80 -0.62 0.23 0.05
CONCLUSIONANDANALYSIS
With the urban social economy development, uncertainty factors affecting urban power load are increasing, to improve the accuracy of the forecasts, it’s need to identify and analysis risk sources of power load. According to statistical inquiry, decide the main risk sources of power load. Establish clear hierarchy and context class structure system and risk transmission chain with ISM, on the basis of which, establish power load forecasting model based on ISM risk analysis. Testing with whole society power load of some province in 2010, based on the conventional forecasting methods, the proposed method takes full consideration of the influence of probability of occurrence and influence quantity of various risk factors, effectively improves the level of urban power load forecast, and provides decision basis for power load forecasting risk management.
ACKNOWLEDGMENT
The research was supported by “the Fundamental Research Funds for the Central Universities”, Fund No: 11MR62
REFERENCES
[1] [ZHOU Xiao, LI Na-na, YANG Ying, Analysis of the power demand side management based on ISM, RELAY, 2007, 35(7): 58-60.
[2] HE Yong xiu, TAO Wei jun, YANG Wei hong. Urban Power Load Forecasting Based on an Interpretative Structural Model, Automation of Electric Power System, 2009, 33(20): 37-42.
[3] KANG Chongqing, YANG Gaofeng, XIA Qing. Analysis on the uncertainty of electrical demand, Automation of Electric Power Systems, 2005, 29 (17): 14-19, 39.
[4] HAN Jinshan, TAN Zhongfu, LIU Yan. Research on interpretative structure modeling for risks of electricity retail market, Power System Technology, 2005, 29(8): 14-19.
[5] LI Hanfang, TAN Zhongfu, WANG Chengwen, et al .Interpretative structural model based risk structural analysis of power generation company in electricity market, Power System Technology, 2007, 31 (13): 59-264.
[6] HAN Jinshan, TAN Zhongfu. An interpretative structure model for generalized electric power system, Automation of Electric Power Systems, 2008, 32 (20): 42-49.
[7] KANG Chongqing, MU Tao, XIA Qing. Power system multilevel load forecasting and coordinating: Part one
research framework, Automation of Electric Power Systems, 2008, 32 (7): 34-38.
[8] SUN Hui, ZHOU Ying, FAN Zhi-qing. An Analysis of the Influencing Factors of Public Transportation Passenger Flow on the Base of Interpretive Structural Model, JOURNAL OF BEIJING INSTITUTE OF TECHNOLOGY (SOCIAL SCIENCES EDITION), 2010, 12(1): 29-32.
[9] WEI Lingyun, WU Jie, LIU Yongqiang. Long term electric load forecasting based on system dynamics, Automation of Electric Power Systems, 2000, 24 (16): 44-47.
[10]XIAO Jun, ZHANG Jing, ZHU Tao, et al. Analysis of urban power load based on association rules, Automation of Electric Power Systems, 2007, 31 (17) : 103-107. [11]YANG Bin,YU Bo, SUN Qian. Research on risk
generating mechanisms of overseas oil and gas development projects based on an interpretative structural model, Journal of Harbin Engineering University, 2010, 31(9): 1259-1264.
[12]TANG Zhi-wei, DU Ren-jie, GAO Tian-pen. Risk Analysis of E-Government Information System Based on ISM, Journal of UEST of China, 2005, 34(2): 251-253. [13]WANG Yuan- ming, ZHAO Dao- zhi. The Transmission
Model of Controlled Quality Risks in Construction Projects, Business Economics and Administration, 2008, (6): 15-20.
[14]YIN Hong-yang, XU Li-qun, QUAN Xiao-feng. Research on Influencing Factors of Road Network's Vulnerability Based on Interpretive Structural Model, Soft Science, 2010, 24(10): 122-126.
[15]XU Min-jie, HU Zhao-guang, SHAN Bao-guo, WU Jun-yong. Analysis on influencing factors of electricity demand by using interpretative structural modeling, Electric Power, 2009, (4): 1-5.
[16]ZHANG Zi-jian. Research of risk cause of formation of product development item based on the explanatory structural model, Ship Engineering, 2007, 29(6): 88-91. [17]Liu Wei, Liu Lu. Risk Analysis of Knowledge System
Based on ISM, Computer Engineering and Applications, 2006, 42(14): 134-136.
[18]Gu XiaoXia. The Systematic Analysis on the Regional Risk of High Technology Projects Based on Interpreted Structural Model, Industrial Engineering and Management, 2005, 10(4): 70-75.
[19]Kim, I.; Watada, J.. Decision Making With an Interpretive Structural Modeling Method Using a DNA-Based Algorithm, NanoBioscience, 2009, 8(2): 181-191.
[20]ZHENG Zhi-jie, LI Lei, ZHAO Lan-ming. Medium and long term load forecasting considering data uncertainty, Relay, 2011, 39(7): 123-126, 132.
[21]SUN Da-shuai, MA Li-xin, WANG Shou-zheng. Design of short-term load forecast systems based on the theory of complex systems, Journal of University of Shanghai For Science and Technology, 2011, 32(1): 39-43.
[22]YANG Hu-ping, BI Zhi-peng. Particle Swarm Optimization- based Grey Model for Long- term Load Forecasting, Electrical Measurement & Instrumentation, 2011, 48(2): 40-43, 63.
[23]ZHU Ji-ping, DAI Jun. Optimization Selection of Correlative Factors for Long -term Load Prediction of Electric Power, Computer Simulation, 2008, 25(5): 226-229.
[25]JI Xun-sheng. Short-term power load forecasting on partial least square support vector machine, Relay, 2010, 23: 55-59.
[26]FANG Ge-fei1, HU Chang-hong1, ZHENG Yi-hui, CAI Jin-ming. Study on the method of short-term load forecasting considering summer weather factors, Relay, 2010, 22: 100-104.
[27]WANG Feng-shan, ZHU Wan-hong, WANG Quan-peng. Constructing quality systems of engineering equipment based on ISM, Journal of PLA University of Science and Technology(Natural Science Edition), 2005, 6(5): 479-483. [28]CHENG Bo, LI Bing-xiang. Interpretative Structural Modeling Method Based on Analysis of Entrepreneurs Capacity Factors, Journal of Xi’ an University of Technology, 2010, 2: 239-245.
[29]SHI Xiao-bo, et al. Analysis of Interpretative Structural Model on the Influencing Factors in New Rural Housing Construction Quality, Journal of Anhui Agricultural Sciences, 2009, 26: 12853-12854
[30]WANG Wanqiu, ZHANG Yong'an. Research on Factors Influencing Technology-Based Mergers and Acquisitions Synergy, Science of Science and Management of S.& T., 2009, 30(4): 104-109, 193.
[31]Wang MeiYuan, Lu YaoBin, Zhang JinLong. An Empirical Analysis on the Whole Process Risk Structure to the Software Outsourcing Project, 2006, 23(4): 139-142. [32]Su Ju-ning, Shi Chuan-fang. ISM-Based Impact Factor
Analysis in the Selection of Logistics Mode in Manufacturing Enterprises, Industrial Engineering Journal, 2009, 12(4): 6-10.
[33]ZHU Zhao-xia, ZOU Bin. Risk model of distribution utilities and analyzing the infection on the load factor in electricity market, Relay, 2007, 35(12): 56-60.
[34]Yang Yonghui, Xiao Xiumei. The reascher on an alyzing the impact factors of regional sustainable development
base on the approach of system engineering, Scientific Management Research, 2008, 26(3): 57-59. [30] WANG Wanqiu, ZHANG Yong 'an. Research on Factors Influencing Technology-Based Mergers and Acquisitions Synergy, Science of Science and Management of S.& T., 2009, 30(4): 104-109, 193.
[35]Wang MeiYuan, Lu YaoBin, Zhang JinLong. An Empirical Analysis on the Whole Process Risk Structure to the Software Outsourcing Project, 2006, 23(4): 139-142. [36]Su Ju-ning, Shi Chuan-fang. ISM-Based Impact Factor
Analysis in the Selection of Logistics Mode in Manufacturing Enterprises, Industrial Engineering Journal, 2009, 12(4): 6-10.
[37]ZHU Zhao-xia, ZOU Bin. Risk model of distribution utilities and analyzing the infection on the load factor in electricity market, Relay, 2007, 35(12): 56-60.
[38]Yang Yonghui, Xiao Xiumei. The reascher on an alyzing the impact factors of regional sustainable development base on the approach of system engineering, Scientific Management Research, 2008, 26(3): 57-59.
Li Yanmei, lecture, master, works in School of Business and Administration, North China Electric Power University, China