Corresponding author, email:[email protected] (R. Andayesh).
Tel.: +98912 072 2359; Fax: +98613 441 7174.
Asian Journal of Green Chemistry
Journal homepage: www.ajgreenchem.com
Orginal Research Article
Application of modified sawdust for solid phase
extraction, preconcentration and determination of
trace lead in water samples
Rashin Andayesh
a,*, Shahla Elhami
ba Department of Chemistry, Khouzestan Science and Research Branch, Islamic Azad University, Ahvaz, Iran b Department of Chemistry, Ahvaz Branch, Islamic Azad University, Ahvaz, Iran
A R T I C L E I NF O R MA T I O N A B S T R A C T
Received: 17 November 2018
Received in revised: 4 February 2019
Accepted: 4 February 2019
Available online: 2 March 2019
DOI: 10.33945/SAMI/AJGC/2019.4.10
A new sorbent was prepared for separation and preconcentration of Pb (II) by using the flame atomic absorption spectrometry. The normative studies on extraction, separation and preconcetration of Pb(II) were represented in this work. This novel method was based on new sorbent by adding diethylenetriamine to sawdust, increasing the incidence exterior. The effect of different parameters including, pH, ligand concentration and sample volume, type and volume of eluent and ligand effect were studied. The optimum pH and preconcentration factor and limit of detection for Pb (II) were 4, 100, and 0.48 µg/L, respectively. In addition, the calibration curve was linear in the range of 0.05-100 mg.mL-1 with R2=0.995. The vertical and
horizontal confines of calibration diagrams in 500 mL solution were calculated about 0-0.5 mg L-1 and 0-0.6. The results of applying the present
method to determinate the separated lead ions in water samples were prosperous and harmonious. Precision of the method was investigated by comparing them with the observations from previous similar researches. © 2019 by SPC (Sami Publishing Company), Asian Journal of Green Chemistry, Reproduction is permitted for noncommercial purposes.
KEYWORDS
Preconcentration Pb (II)
Sawdust
Graphical Abstract
Introduction
Various kinds of toxic heavy metals containing cadmium, lead, cobalt, copper, arsenic, zinc and Hg enter the environment through mineral production, industrial discharges, pollutions, and dissolution
of agriculture lands [1‒3]. Lead has a wide range of application among thw heavy metals. Tetraethyl
and tetramethyl lead which penetrate in fluids and food chain are the main source of environment’s
pollutions [4]. Lead has many detriments for human health and may accumulate at liver, bones, and
muscles [5, 6]. Accordingly, precise determination of heavy metals in natural is the important part of
analytical chemistry’s studies [7, 8].
Flame atomic absorption spectrometry is a method with simple application and low triggering
disbursement [9]. Manifestation limitation of this procedure causes the fact that preconcentration
has been known as a necessary step before determination of heavy metals [10, 11]. Membrane
separation [12], liquid-liquid extraction [13], and solid phase extraction [14‒16] were used for
preconcentration and separation of metal ions prior measuring the heavy metals [17]. Simple setup
and availability are the advantages of solid phase extraction in comparison with the other current methods. It is a known efficient procedure for separating the metal ions which may reduce the time
and cost of conducting the experiments with high enrichment factor [18, 19]. Many researchers have
preconentrate metal ions in various samples. High cost of keeping sorbents and providing them have
the main role in getting proper efficiency and yield for the solid phase extraction methods [25]. Many
studies have been conducted to find a low cost and effective sorbent for preconcentration of trace
metals [26, 27].
One novel technology which includes absorption of solvated particles from natural samples, is called adsorption. Low cost, short-time design and further usage capability are some of the features
of the adsorption method [28]. Among the surface adsorbent, sawdust is a high usage over plus and
production of wooden industry which can be used as a low cost sorbent [29]. Some other sorbents
were used to remove lead from hexamine, poli acrylamide and colored inks. In lead adsorption [30],
there are just a few studies conducted on analytical usage of sawdust as low cost and safe adsorbent for separating lead ions from water samples.
In the present research study, the possibility of utilization of sawdust was examined as a simple and low price method for solid phase extraction of trace lead. So, lead ions were preconcentrated before the flame atomic absorption to determine the adsorbed lead particles from water samples existing in environment. Effects of different parameters such as pH of solution, kind and volume of solution and eluent and ligand influences were investigated. Performance and efficiency of the aforementioned method was studied for Dez river, Karkhe river and tap water samples.
Experimental
Reagent and solutions
All the materials which contain Pb (NO3)2, C4H13N3, HNO3, KI and HCl were purchased from Merck company, Germany. In the present study, water which was used for providing solutions was distilled twice. 1.396 g Pb (NO3)2.4H2O and distilled water were chosen for daily preparing of storage solution and a little more diluted solution. Standard solution was provided with suitable density before starting the experiment. All the glass and plastic instruments were eluted within diluted HCl and
HNO3 and cleaned with distilled water. To prepare 1.2 mol/L-1 acid nitric, 8.3 mL of high pure HNO3
was brought to volume with distilled water in a 100 mL flask.
Apparatus
Preparing sorbent
At first, sawdust was washed about 24 hours and then, it was dried at 110 °C and sieved by a 35 mm mesh. After that, 10 g of sawdust was mixed with 140 mL of dense HCl. After one hour, 60 mL of diethylenetriamine was added to prepare the combination. After two hours, the mixture was eluted by distilled water and was located in a bottle in order to be dried for 18 h at 40 °C.
General procedure
A mixture of 25 mL of 1 mol.L-1 Pb solution and 4 mL of 1 mol.L-1 KI solution was spilled in a 500
mLglassware. The mixture was adjusted in pH=4 by adding suitable amounts of HNO3 and distilled
water. The prepared solution was passed through the column containing 0.25 g of the modified
sorbent by diethylenetriamine. Then, the content of column was eluted by 5 mL of 1.2 mol.L-1 HNO3.
Finally, the accumulated solution of column was injected for the determination of the flame atomic absorption spectrometry.
Results and Discussion
Characterization of sawdust
Scanning electron microscopy (SEM) image of the sawdust, acidic sawdust, and the modified
sawdust by diethylenetriamine was represented (Figure 1). SEM analysis was carried out to study
the structure of sawdust before and after modification. As seen in Figure 1a, the sawdust’s surface is
relatively smooth. Figure 1b demonstrates a mixture of sawdust and HCl, indicating that the
configuration of surface was changed. Figure 1c illustrates the structure of the sawdust modified with
diethylenetriamine which causes many groups to form and collect on the surface.
IR spectra analysis of three kinds of sorbent was measured at 400-4000 cm-1 limitation. The
results for the pure sawdust, acidic sawdust and modified one are presented in Figure 2. The
adsorption bands at 1439 to 1448 cm-1 are due to a contribution from C‒H stretching. The peaks at
1538 to 1637 cm-1 were assigned to the C=O bonds. The strong band was observed at 3422 cm-1
indicating the stretching of the O‒H band. The peak related to O‒H band for pure sawdust in Figure
2a is wider and sharper in the modified sawdust in Figure 2c. The peak of tensional C=O band was
removed in Figure 2b. Besides, the peak of CN band has a higher intensity in the modified state in
A b
c
Figure 1. Scanning electron microscopy for a) sawdust, b) acidic sawdust, c) modified sawdust
Figure 2. FT-IR spectra analysis for a) sawdust, b) acidic sawdust, c) modified sawdust [31, 32]
Empirical parameters including, pH of solution, the type of sorbent, ligand effect, type and volume of eluent were studied to obtain a higher value of lead sorption and favorable repeatability.
Effect of pH of solution
This is the main and essential step of solid phase extraction method. Assessment of optimum pH value for preconcentration and extraction of lead ions in water samples was investigated in the
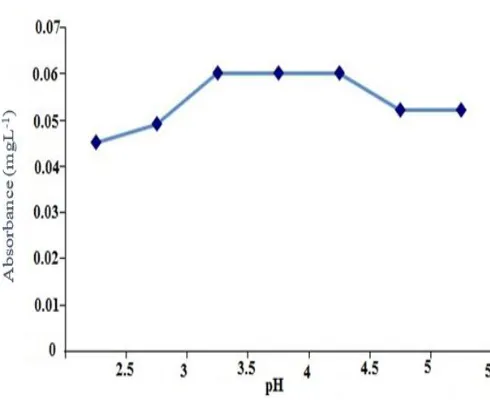
present study. Each point of the curve in Figure 3 shows the average consequence of three
experiments which has been done in 0.03 error range. As seen in Figure 3, there is a correlation between the sample solutions with different pH and determination of Pb (II) ions. In addition, decreasing the pH values causes increased the solubility of lead ions in buffer solutions at the pH of 4. The optimum condition of pH value was found to be 4 in which, by decreasing and increasing the pH value, the extraction of lead ions reduced. So, the pH value was adjusted at 4 for the next tests.
Effect of buffer
According to the optimum pH which is 4, three types of buffer were selected including acetate,
formate, and citrate buffer. As demonstrated in Table 1, the effect of formate buffer is small at all
stages of testing and lead adsorption is almost close to zero. Acetate and citrate buffers revealed better performance in absorbing the lead ions in the solution in 5 mL and 10 mL of volume, but the impact of the selected buffers is not sensible for the measurement of lead ions and their use are neglected.
Analysis and preparation of sample
Modifying flow rates of samples and eluents at the best acquired conditions is an indispensable factor in determination of a suitable recovery for every analyte. So, it has been adjusted at the range
of 2-8 mL.min-1. The optimum flow rate for all the solutions was 3 mL.min-1. The recovery of metal
ions did not achieve properly at higher and lower than this value.
Some parts of the sample solutions within 100-1000 mL capacity containing 10 mg.L-1Pb (II) were
tested in the optimum conditions to determine the proper sample volume. The pH value was set at 4
by regulating the amount of acid nitric. Finally, the column was eluted by 10 mL of 1 mol.L-1 HNO3,
and the remnant of solution was given to system for determination. As can be seen in Table 2, the
Effect of type and volume of ligand
To determin the lead ions by flame atomic absorption spectrometry, 4 to 10 mL of several ligands
(NaCl, NaF and KI) were added to 50 mL solution containing 10 mL of 1 mol.L-1 HNO3. As seen in Table
3, KI plays a considerable role in increasing the amount of determination value of lead ions. Various
amounts of KI were added to 50 mL solution containing 10 mL HNO3 to assess the optimum volume
of KI. Table 3 shows that the proper volume for current experiments is 4 mL. The optimum
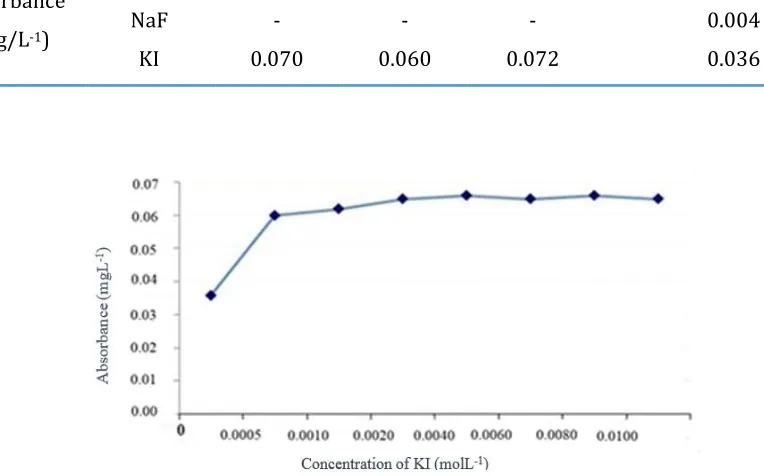
concentration range was tested from 0.0 to 0.1 mol/L-1 KI. As shown in Figure 4, 0.04 mol.L-1 is the
best concentration for the next level of this research.
Figure 3. The effect
of pH of solution on preconcentration of lead ions
Table 1. Effect of buffer’s solution on adsorption of trace lead
Buffer Acetate Formate Citrate
Volume (mL) 5 10 5 10 5 10
Absorbance (mg/L-1) 0.037 0.027 0.002 0.001 0.034 0.039
Table 2. The effect of volume of sample on lead adsorption
Sample volume (mL) Absorbance (mg/L-1)
100 0.06
250 0.065
500 0.068
Table 3. The effect of different volumes on preconcentration of lead ions
Volume (mL) 4 mL 6 mL 8 mL 10 mL
Absorbance
(mg/L-1)
NaCl - - - 0.001
NaF - - - 0.004
KI 0.070 0.060 0.072 0.036
Figure 4. The effect of concentration of KI in measuring the Lead adsorption
Effect of kind, concentration, and volume of eluent
Different eluents (HCl, HNO3) were examined to study their effect on the determination of lead
ions. The results revealed that, in determination of trace metals in analyte, 1.2 mol.L-1 of HNO3 could
be effective more than 95%. Solution was eluted by various concentration of eluent based on Figure
5. Observations showed that 1.2 mol.L-1 is the steady state of acid concentration variation. The
volume changes of eluent were studied by 4 mL in range of 1 to 5 mL. 5 mL of 2 M HNO3 was chosen as an optimum volume for determination procedure. The dimensionless ratio of sample volume and eluent volume is known as preconcentration factor and for represented experiment obtained 100.
Effect of sorbent amount and regeneration of sorbent
Fixing the proper amount of sawdust plays an important role in the determination of lead ions. Reducing the value of sorbent leads determination and deficiency of elution to collect the solution into column which is in the result of utilization of an extra sorbent [33]. Solutions were chosen with different amount of sorbent in an acceptable status to prevent the aforementioned problems. As
shown in Figure 6, the maximum absorption of Pb (II) ions was accessed in 0.25 g of sorbent that is
process [34, 35]. The evaluated solution was spread on a column containing 0.25 g sawdust before
eluting it by 5 mL of 1.2 mol.L-1 HNO3. These processes were done for ten times which showed the
efficient level of modifying sawdust during the lead sorption. Table 4 represents the fact that the
sorbent can be reused well in which 15.625 adsorption percentage changes can be neglected (Equation 1).
15.625%=(0.064-0.054)/0.064×100 Eq. 1
Analytical features
Calibration curve was accounted by measuring Pb (II) in optimum conditions by flame atomic
spectrometry in 0.01-0.50 mg/L-1. C is known as the concentration of Pb (II) at mg/L-1 and line
equation is obtained as 1.028 C+0.003 (Figure 7) with R2=0.995. The proportion of 3 product of the
relative standard deviation to the calibration curve slope is known as the limit of detection which is equal to 0.48 µg/L in ten times repetition. Present study includes the proper and precise preconcentration and separation of trace Pb (II) since the relative standard deviation is fewer than 5
percent [36].
Application to real samples
To examine real samples, three primary models were provided from tap water, Karkhe and Dez
rivers. 100 mL of each real sample was added to 4 mL of 1 mol.L-1 KI lead solution and, then, pH was
registered at 4 using distilled water. Results of the determination after eluting the column are shown
in Table 5. As seen in Table 5, absorbent and methods employed in this study revealed a high
capability to attract and determine the lead from water-soluble naturally found in the nature.
Validation of present work
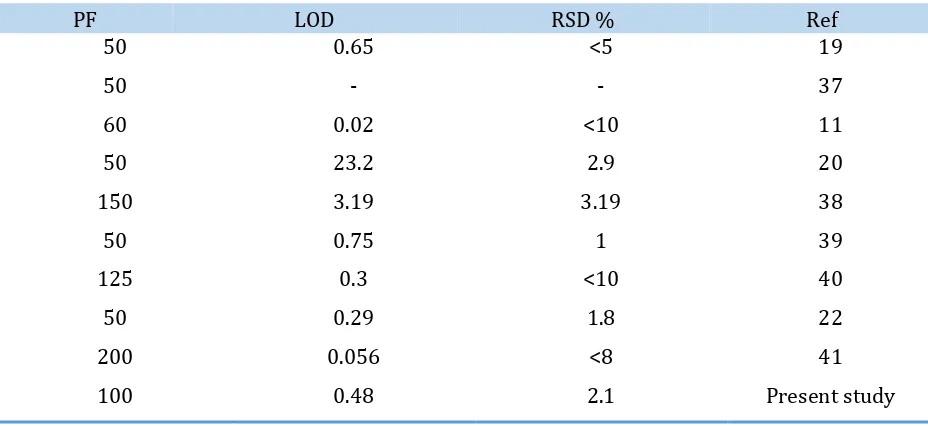
Comparatively, the performance of this method with the work which was done about
determination and lead capture is shown in the Table 6. The amount of the preconcentration factor
Figure 5. The effect of eluent concentration on Lead adsorption
Figure 6. The effect of sorbent amount on lead adsorption
Table 4. The possibility of reusing the sorbent on determination of lead ions
No 1 2 3 4 5 6 7 8 9 10
Absorbance
(mg/L-1)
0.064 0.061 0.059 0.057 0.055 0.056 0.055 0.055 0.053 0.054
Conclusions
nature are the advantages of the present method. The impact of effective factors were investigated. The optimum pH and limit of detection for Pb (II) were 4 and 0.48 µg/L. The preconcentration factor for Pb (II) and maximum adsorption capacity on the basis of the amount of sorbent were 100 and 76
mg.g-1, respectively. The represented new sorbent revealed a high absorption capacity and
preconcetration factor. The results showed that, the applied experiment was sensitive and precise to the determination of lead ions in real water samples.
Figure 7. The calibration curve of
determination of Pb(II) in this research
Table 5. Preconcentration of Pb(II) ions in real samples
Recovery (%) Adding Pb(II)
Getting Pb(II) Sample
mgL-1
mgL-1
- 0.0
Not Detected
Tap water 0.095 0.1 95.2
97.5 0.2
0.195
- 0.0
Not Detected
Dez river water 0.094 0.1 94.6
96.05 0.2
0.192
- 0.0
Not Detected
Karkhe river water 0.100 0.1 100
95.5 0.2
Table 6. Comparing previous researches with present method in preconcentration and determination of Pb (II)
Ref RSD % LOD PF 19 <5 0.65 50 37 - - 50 11 <10 0.02 60 20 2.9 23.2 50 38 3.19 3.19 150 39 1 0.75 50 40 <10 0.3 125 22 1.8 0.29 50 41 <8 0.056 200 Present study 2.1 0.48 100 Acknowledgements
The authors would like to appreciate Prof. Dr. Babak Mokhtari for his guidance during my researches.
we are also indebted to the Department of Chemistry of Azad University of Ahvaz, all stuff and laboratory assistants, for their support and coopration. Finally, we would like to thank the stuff of the Analytical Laboratory, especially Ms Ladan Kaviani for her valuable assistance during the course of my study.
Disclosure Statement
No potential conflict of interest was reported by the authors.
References
[1]. Castro R.S.D., Caetano L., Ferreira G., Padilha P.M., Saeki M.J., Zara L.F., Martines M.A.U. Ind. Eng.
Chem. Res., 2011, 50:3446
[2]. Dabas T., Saçmac S., Ülgen A., Kartal S. Food Chem., 2015, 174:594
[3]. Dabas T., Ülgen A., Kartal S. J. Ind. Eng. Chem., 2015, 28:316
[4]. Hossein Baki M., Shemirani F., Khani R. J. Food. Sci., 2013, 78:797
[5]. Khalid N.R.S., Ahmad S. Sep. Sci. Technol., 2005, 2427:43
[6]. Haman DJ.B.Z., Proceedings of the 10th International Conference on Environmental Science and
Technology, Kos Island, Greece. 2007; p 246
[8]. Hossien-poor-Zaryabi M., Chamsaz M., Heidari T., Arbab Zavar M.H., Behbahani M. Food Anal.
Method., 2014, 352:359
[9]. Benzo Z., Velosa M. J. Food Sci., 2006, 222:4
[10]. Behbahani M., Babapour M., Amini M.M., Sadeghi O., Bagheri A., Salarian M., Rafiee B. Am. J. Anal.
Chem., 2014, 90:98
[11]. Divrikli U.K.A., Soylak M., Elci L. J. Hazard. Mater., 2007, 459:64
[12]. Liu Y.C.X., Guoa Y., Menga S. J. Hazard. Mater. B, 2006, 389:94
[13]. Behbahani M., Najafi M., Amini M.M., Sadeghi O., Bagheri A., Ghareh Hassanlou P. J. Ind. Eng.
Chem., 2014, 2248:2255
[14]. Behbahani M., Abolhasani J., Amini M.M., Sadeghi O., Omidi F., Bagheri A., Food Chem, 2015,
1207:1212
[15]. Behbahani M., Bide Y., Salarian M., Niknezhad M., Bagheri S., Bagheri A. Food Chem., 2014, 14:19
[16]. Behbahani M., Amini M.M., Esrafili A., Farzadkia M., Bagheri A. Food Chem., 2015, 14:19
[17]. Dasbas T.S., Çankaya N., Soykan C. Food Chem., 2016, 68:73
[18]. Komjarova I.B.R. Anal. Chim. Acta., 2006, 221:8
[19]. Melek E.T.M., Soylak M. Anal. Chim. Acta., 2006, 578:213
[20]. Bermejo-Barrera P., Nancy M.A., Cristina D.L., Adela B.B. Microchim. Acta., 2003, 101:8
[21]. Mendli D. J. Food Sci., 2012, 181:6
[22]. Marahel F., Shokrollahi G., Montazerozohori M., Davoodi S. Chemosphere, 2009, 583:9
[23]. Pyrzynska K. TrAC Trends Anal. Chem., 2010, 718:27
[24]. Kaur A.G.U. J. Mater. Chem., 2009, 8279:89
[25]. Sari A.D.U., Tuzen M. Chem. Eng. J., 2011, 155:61
[26]. Rafatullaha M.S.O., Hashima R., Ahmad A. J. Hazard. Mater., 2009, 969:77
[27]. Vania M.M.R., Villanueva R.A.C., Garnica-Romo M.G., MartInez-Flores H.E. J. Food Sci., 2012,
71:10
[28]. Kaczala F.M.M., Hogland W. Biores. Technol., 2009, 235:43
[29]. Hao L., Liu Q. Li X., Du Z., Wang P. RSC Advances, 2014, 4:49569
[30]. Shi B., Li G., Wang D., Feng C., Tang H. J. Hazard. Mater., 2007, 143:567
[31]. Wang H., Yuan X., Zeng G., Peng L., Liao K., Peng L., Xiao Z. Environ. Sci. Pollut Res., 2014,
21:11552
[32]. Sabermahani F., Bahrami H. Arab J. Chem., 2012, 9:1700
[33]. Tunceli A., Turker R. Talanta, 2002, 1199:1204
[34]. Gouda A.A., Al-Ghannam Gouda S.M. Food Chem., 2016, 202:409
[36]. Burham N., Azeem S.A., El-Shahat M.F. Cent. Eur. J. Chem., 2009, 945:54
[37]. Tewari P.K., Singh A.K. Fresenius J. Anal. Chem., 2000, 562:567
[38]. Ramesh A., Mohan K.R., Seshaiah K. Talanta, 2002, 243:252
[39]. Tuzen M.S.K., Soylak M. J. Hazard. Mater., 2008, 632:9
[40]. Saracoglu S., Soylak M., Elci L. J. Anal. Chem., 2003, 1127:31
[41]. Narin I., Soylak M., Kayakirilmaz K., Elci L. J. Anal. Lett., 2003, 641:658
How to cite this manuscript: Rashin Andayesh*, Shahla Elhami. Application of modified sawdust
for solid phase extraction, preconcentration and determination of trace lead in water samples.