* Corresponding author: [email protected]
High Strain Rate Compaction of Porous Materials – Experiments
and Modelling
MatthewCotton1,* andJohnMaw1
1AWE Plc, Aldermaston, Reading, Berkshire, RG7 4PR, UK
Abstract. Porosity can be found in many forms in common materials, either naturally occurring such as wood, or introduced by a manufacturing process. Applications for such materials include impact protection and energy absorption, which require a good understanding of their response to rapid loading. In order to increase confidence in simulations of porous materials under different loading conditions it is important to validate models with experimental data. To support this requirement experiments have been conducted to investigate the compaction behaviour of porous copper samples in the high strain rate regime. Gas gun plate impact trials with impact velocities in the range 100-300 m/s were used to achieve the conditions of interest. Simulations of the experiments were conducted with a focus on accurately modelling the material response in the region prior to complete compaction. This work will report on the experimental technique and the modelling approach employed to achieve good agreement with the data.
1 Introduction
AWE has an enduring requirement to develop high fidelity material models for use in computer simulations of complex systems. An important component of these models is the ability to accurately represent the behaviour of underdense or porous materials. This is handled computationally by applying a separate porosity model onto the model which describes the fully dense material. This needs to be able to describe the response of porous material over a wide range of strains, strain rates and temperatures, and under both tension and compression. A good understanding of the dynamic response is particularly relevant to scenarios such as blast and impact mitigation, which is a common application for porous materials [1-2]. The response of the porous material to dynamic loading can broadly be divided into two regimes: one where the material experiences sufficient pressure to eliminate all voids, and another below this critical pressure where the porous material remains in a state of incomplete compaction behind the shock front. It is this latter situation which is the most challenging for computational models to predict, as conventional Mie-Grüneisen analyses of shock propagation do not apply.
A number of approaches have been proposed to capture the response of porous media, but this is complicated by the heterogeneous nature of a porous system. Effects such as inter particle bonding, pore morphology, phase transformations and temperature can
all display local variations under dynamic loading which can influence macroscopic response.
Experimental validation plays an important role in establishing confidence in a predictive model, and is particularly relevant when considering a complex structure such as a porous material. Ideally any experiments will supply data on the regime and materials of interest, while using a simple geometry which avoids introducing any unnecessary complexities. In the dynamic regime, gas gun plate impact experiments fulfil this role effectively, delivering data in a state of uniaxial strain which is amenable to simulation.
This paper will review the development of porosity models and discuss their implementation into a hydrocode. A series of gas gun experiments on porous copper is then described, and the analysis techniques applied to this experimental data to help validate the chosen porosity model.
referred to as the Snow Plow model. The compacted material then follows a similar thermodynamic path to fully dense material. At sufficiently high impact pressures material strength effects are negligible and this method can produce accurate results, but many high strain rate loading scenarios do not achieve the necessary pressures to allow this approach. It should also be noted that the response of porous materials of <50% solid density remains very challenging to model even at high pressures with a Snow Plow model due to limitations in the simple Grüneisen EoS, although this is not discussed further in this study.
Several models of varying complexity [3-4] were proposed to address the shortfalls in the simple Snow Plow model by incorporating a finite compaction pressure to more accurately describe response at low and intermediate pressures. Of these, Hermann’s P-α model [5] was the first to provide a reasonably accurate representation of the compaction path in P-V space. Hermann related the distension of the material, α, to the pressure, and considered the elastic and plastic regimes separately. While this model performed well it was limited to certain pressure regimes due to assumptions becoming invalid outside these limits.
Carroll and Holt proposed another porous model [6] which defined a three-stage elastic-plastic pore collapse model where the pore is modelled as an incompressible spherical shell. In this model pore collapse only initiates above a critical pressure, an assumption which neglects change in porosity in the elastic phase. Void collapse is then controlled by an exponential relation depending on yield strength, density, porosity and pore radius. The matrix material was assumed to be incompressible while pore collapse was occurring, a hypothesis that agreed well with experimental data. A shortcoming of this model is the reduction in accuracy in the plastic compaction region which means it has trouble fitting experimental data over the entire compaction region. An attempt to address this problem was made through the subsequent addition of a rate dependent plastic flow term [7]. Nesterenko [8] also modified the basic hollow sphere collapse model by introducing a solid core to address problems caused by the void reducing to zero volume.
All the models described above operate on the assumption that void closure is driven by the application of hydrostatic pressure. However, if the material has shear strength then there will also be a shear stress contribution to this process. There have been some attempts to incorporate shear stress into a porosity model [9-10], but practical application as a predictive tool has proven difficult. The simplest method of approximating shear stress effects is to apply a stress deviator term on top of the hydrostatic pressure, although this still requires some assumptions about material behaviour to implement.
In practice, Hermann’s P-α model is still the most widely used method for dealing with porous materials, with the model parameters determined from
representation of which is the principal objective of this work.
Following the selection of the P- α model as the most appropriate for dealing with porous materials, it is necessary to parameterise it and underwrite its performance by comparison to experimental data. Of particular interest is data gathered in the regime of partial compaction, the reproduction of which offers a robust test of porosity models. In this study, this data is supplied by gas gun plate impact experiments on porous copper.
Similar approaches to investigating the effect of porosity have been reported by a number of authors using a variety of materials at varying densities. Some of the earliest work was conducted by Boade [11-12] on porous copper, which provided evidence of the multi-wave structure relating to the densification process. The data was processed to yield information on the low pressure Hugoniot, demonstrating that it converged with the solid Hugoniot as pressure increased. This analysis revealed that the compaction of the material took place over a pressure range of ~0-2 GPa, highlighting the need for a physically realistic treatment of pore collapse and densification in this region. Other materials were also observed to display similar behaviour when shocked [13-14]. Application of the P-α model to the experimental data [12] produced a good match which captured the form of the compaction curve.
3 Experiments
A series of experiments was carried out using the AWE single stage gas gun, a 3 m long, 70 mm bore He-driven launcher. An impactor mounted on a polycarbonate projectile was accelerated down the barrel to impact a porous copper target mounted at the end of the barrel. The nominal density of the porous targets was 72%, a value chosen to allow comparison to the work of Boade [12]. Samples were produced by pressing 10 µm copper powder under 10 tonnes for 30 minutes, resulting in discs of 40 mm diameter and 2 mm thickness. Measured pre-shot densities are shown in table 1, showing evidence of a small (~1%) variation around the nominal value.
The target was backed with a quartz window and impacted with quartz or PMMA discs. The impactor thickness was chosen to ensure that the release wave propagating from the rear of the impactor did not erode the shock in the target. The quartz discs were supplied in z-cut orientation, and the face of the quartz window in contact with the porous copper target and the front face of the impactor were gold coated to ensure a strong reflected signal for the laser diagnostic.
and tilt at the impact face. Impact tilt was measured as <2 mrad for all experiments. Triggering of the diagnostics was accomplished by the impactor striking a piezoelectric pin situated slightly proud of the impact face. A diagram of the experimental geometry is shown in figure 1, and a picture of the assembled target is shown in figure 2.
Fig. 1. Experimental geometry.
Fig. 2. Target assembly with diagnostics.
A total of six shots were fired in this series, details of which are shown in table 1.
Table 1. Shot details.
Shot No. Impact Velocity
(m s-1) Target Density (%) 1 279.4 70.73 2 244.9 72.86 3 208.1 72.59 4 163.7 71.59 5 158.6 72.37 6 153.4 72.44
All experiments recorded data on the HetV diagnostic, supplying velocity-time profiles for subsequent analysis. This analysis was achieved through the application of a sliding window Fourier transform technique to move from the frequency-time to the velocity-time domain.
An example of an interface velocity-time profile following processing of the raw HetV data is shown in figure 3.
Fig. 3. Velocity-time data from interface HetV channel.
Several features can be identified on the HetV signal, corresponding to shock and release waves arriving at the recording location. A low amplitude elastic wave can be seen arriving ~1.5 microseconds before the compaction wave, evidence of the slow plastic wave speeds in uncompacted material. An increase in noise is evident in the profile following the compaction wave arrival, caused by the breakup of the porous target. In order to mitigate these phenomena, which obscures the velocity in the plateau region, a 0.6 mm solid copper disc was introduced between the porous copper target and the window for later shots. This improved the ability of the HetV to resolve information following the arrival of the compaction wave.
Following processing of the velocity-time data each experiment generates a data point in P-V space which corresponds to a state on the compaction curve of the porous copper. This analysis will be discussed in the following section.
4 Discussion
The first stage of the post-shot analysis is to identify the wave arrival times using the HetV data, which, in conjunction with the known impact time and target thickness, supplies wave velocities for the elastic wave, ue, and the compaction wave, uc.
In order to calculate the pressure generated in the target on impact, the following formula is then applied:
P=
ρ
0upuc (1)Where: P = pressure
ρ
0= initial densityup = particle velocity
Fig. 4. P-up analysis of porous copper impact. Dashed lines
indicate P-up states generated during the experiment.
Once pressure is known, the volume in this state can be calculated using the formula:
V = V0-(up2/P) (2)
where:
V0 = initial volume of porous copper target V = final volume at pressure P
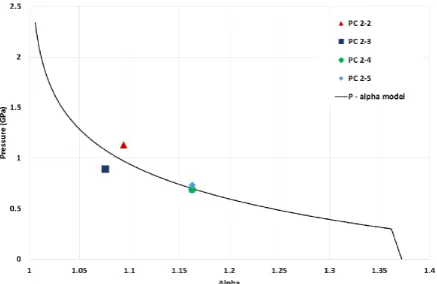
The P-V states generated in this series of experiments have been plotted in figure 5 alongside the simulated compaction curve generated by the hydrocode. Simulations were carried out using the P-α model, using the exponential compaction path form used by Boade.
α = 1 + (αe-1)exp[1-α*(P-Pe)] (3)
Where:
α=distension P=pressure
and subscript e refers to the elastic region. For the porous copper simulation presented here, Pe=0.3 GPa and α*=2 GPa-1.
Fig. 5. Experimental P-V data points and simulated compaction path.
The data shown here confirms that the experiments were successful in generating P-V states which fall in the
experimental error, they do allow the rapid volume change which takes place during compaction to be better quantified, and provide assurance that simulations based on a P-α model provide physically realistic outputs in this region.
A further check of the performance of the porosity model is to simulate the output of the interface HetV probe to enable a comparison of wave velocities and amplitudes over the timescale of interest. The fact that the HetV data is a continuous record over several microseconds means that a comparison offers a challenging test of the fidelity of the simulation. Figure 6 shows the experimental and simulated data plotted together.
Fig. 6. Comparison of experimental data with simulation.
The agreement between the two is generally good, with the simulation providing a good match to both the timing and velocity of the main features. Some small variation in timing is apparent, but this can be ascribed to the inherent variability in wave propagation speeds through a porous material with local density heterogeneities.
5 Conclusions
A series of experiments have been conducted to investigate the shock response of porous copper during the compaction process. Using low velocity impacts, partially compacted states were generated in the porous samples under conditions of uniaxial strain. Data from this work was used to parameterise a porosity model with the aim of improving predictive capability in the low pressure regime. The application of point diagnostics to a heterogeneous sample meant that there was some variability between individual experiments, but when taken in aggregate the data can be used to help define a compaction path in P-V space.
of quantifying this variation may be to employ a diagnostic with multiple discrete, closely spaced recording locations, such as line VISAR. In addition to copper, the use of gas gun plate impact experiments to deliver high strain rate loading may also be extended to other porous materials of interest.
© British Crown Owned Copyright 2018/AWE.
The authors would like to thank Glenn Whiteman, Mark Collinson, Tina Jewell and Vince Durrant for their assistance in conducting these experiments.
References
1. J.J. Harrigan, S.R. Reid, C. Peng, Int. J. Imp. Eng. 22 955 (1999)
2. V.F. Nesterenko, MRS Symp. Proc. 759 4.3.1 (2003) 3. B.M. Butcher, SC-RR-66-325 (1966)
4. L. Seaman, R.K. Linde, AFWL-TR-68-143 Vol. 1 (1969).
5. W. Herrmann, J. Appl. Phys. 40 2490 (1969) 6. M. Carroll, A.C. Holt, J. Appl. Phys. 43 1626 (1972) 7. B.M. Butcher, M.M. Carroll, A.C. Holt, J. Appl.
Phys. 45 3864 (1974)
8. V.F. Nesterenko, Computer Methods in Theory of Elasticity and Plasticity: Proceedings of X All-Union Conference ed. F.M. Fomin, 212-220 (1988)
9. J.W. Swegle, J. Appl. Phys. 51 2574 (1980) 10. A.L. Gurson, Transactions of the ASME, 2 (1977) 11. R.R. Boade, J. Appl. Phys. 39 5693 (1968) 12. R.R. Boade, J. Appl. Phys. 41 4542 (1970) 13. R.R. Boade, J. Appl. Phys. 40 3781 (1969)
14. R.K. Linde, L. Seaman, D.N. Schmidt, J. Appl. Phys. 43 3367 (1971)
15. O.T. Strand, D.R. Goosman, C. Martinez, T.L. Whitworth, Rev. Sci. Instrum. 77 083108 (2006) 16. J.P. Borg, T.J. Vogler, Int. J. Sol. Struct. 45 1676