© Global Society of Scientific Research and Researchers
http://ijcjournal.org/
New Normal and Abnormal Red Blood Cells Features for
Improved Classification
Jameela Ali Alkrimi
a*, Sherna Aziz Tomeb
b, Loay E. Georgec
ca
College of Dentistry, University of Babylon, Iraq
b
College of medicine, Baghdad University, Iraq
cDepartment of Computer Science, College of Sciences, Baghdad University, Iraq
aEmail: jameela_ali65 @yahoo.com
bEmail: shernaaziz @yahoo.com
cEmail: [email protected]
Abstract
This paper focused obtaining new features for improved classification of red blood cells (RBCs). RBCs varies according to shapes, colors and sizes. Abnormal RBCs may be caused by anemia. Abnormal RBCs has great similarities among each other causing difficulties in medical diagnosis. In this work, spatial, spectral statistical features and geometrical features of RBCs are extracted from 1000 normal and abnormal RBCs. The extracted features are reduced using Principal Component Analysis (PCA) and tested with different types of machine learning algorithms for classification. Classifications were evaluated for high sensitivity, specificity, and kappa statistical parameters. The classifications yielded accuracy rates of 97.9%, 98% and 98% for discriminative (SVM), generative (RBFNN) and clustering (K-NN) algorithm respectively, which is an improvement over previous works.
Keywords: Principal Component Analysis; RBC classifications; red blood cells features; machine learning algorithms.
1.Introduction
Medical images help identify and treat various blood diseases and perform clinical studies to reach a diagnosis [1]. Blood can have normal and abnormal RBCs, where abnormalities are in the variations in shapes, colors and sizes. RBCs images can determine whether it is normal or abnormal by its external edge and central pallor area which may indicate different types of blood diseases or anemia [2].
---
* Corresponding author.
morphology of RBCs produces a huge number of features. To efficiently classify them, number of features need to be kept small. This can be achieved when a larger decimation (reduction of features) factor is applied [4]. Classification makes use of machine learning algorithms and feature selection or feature reduction process. The process of decimation is useful in providing acceptable classification accuracy. Principal Component Analysis (PCA) is a statistical technique for feature reduction used in image recognition by almost all scientific disciplines [7]. PCA involves a linear transformation of the data such that, in the new coordinate frame, the projection of the data has its greatest variance along the first axis (the first principal component), its second greatest variance along the second principal component, etc. Variance is retained for representing the data, while higher-order ones are discarded. The number of principal components used depends on the level of accuracy needed to reconstruct the original data set [10]. Nandi and his colleagues [11] presented a survey of the applications of PCA used in the various medical images and the results obtained prove their efficacy. A few other studies were done on RBCs classification using PCA and machine learning algorithms [12]. Park and his colleagues [13] uses three machine learning algorithms to classify abnormal RBCs. Sharma and his colleagues [14] compares different machine learning classifiers of RBCs. Wheeless and his colleagues [15] mentioned that there are no literatures yet with regard to the anaemic RBCs feature selection that has been published leading to this work in studying issues related to this topic.
2.Features reduction of RBCs Images
This work performed studies on the new features for RBCs classification using data as described in the following sections below. The data sets were self-collected and various steps were performed to obtain the necessary samples from the raw data set collected. Features were extracted, then relevant and useful ones were selected to reduce the total number of features. The aim is to suggest the best features for the RBCs data set collected and explain the steps of obtaining them, validated by the results of three choices of classification methods.
2.1 Input Dataset of RBCs
In this study, 100 different anaemic blood smear slides are used. The slides are collected from the Hematology Unit of the Pathology Department, Faculty of Medicine, Serdang Hospital in 2015. An Olympus BX43 U-CAM D3 photo imaging microscope was used to transform peripheral blood smear slides into digital images at the Faculty of Medicine, SEGI University, Malaysia. Samples of normal and abnormal RBCs slides are shown in Figure 1.
2.2 Materials and Methods
2.2.1 Feature Extraction
similarities in the RBCs. It requires the examination of cells by several features, such as size, area, shape, and internal configurations to distinguish RBCs that have different central pallors but with cells of similar size and shape.
Figure 1: Anaemic blood smear image slide
Figure 2: Samples of Individual RBCs
More specifically, feature extraction aimed to obtain a hybrid of statistical, spectral texture, and geometric features based on first, second, or higher-order statistics of the gray level of an image. In the case of spectral methods, textures are defined by the spatial frequencies of the band color image, which are red, green, and blue. Fourier descriptor is extracted as geometrical features to identify the shape of RBCs. Finally, a total of 271 features were extracted from 1000 individual RBCs. These led to a new data set called FRBCs. The features included some redundancies, that is, some of the variables are correlated with one another because they measured the same construct. Thus, reducing the observed variables into a small number of artificial variables (principal components) is important, which will account for most of the variances in the observed variables.
2.2.2 Feature Reduction Using PCA
significantly. In the data preparation phase, data set underwent normalization using standard deviation method where all feature values are made to be in the same range, between (±1) and replicated data removed as suggested by Gibson and his colleagues [17].
The normalization step aims to reduce the significant variations in the range of values of raw data in several ML algorithms. The majority of classifiers calculated the distance between two points. When one of the features has a broad range of values, this particular feature will determine the distance. The data set obtained from the scaling process normality test was applied using Gaussian distribution test. Results of Gaussian test of the FRBC dataset shows that 99.7% of feature RBCs data set ranges from -0.4 and 0.8 and 68% of FRBCs data are in the range from 0 and 0.4 and the data has normal distribution.
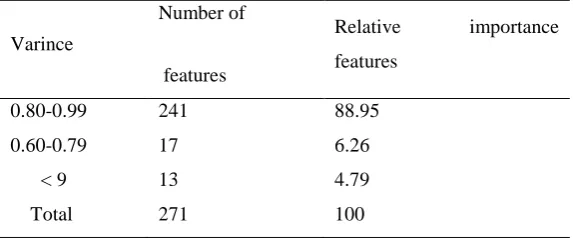
Before applying PCA to the FRBC data a test whether the FRBC data are suitable for reduction was done using the Kaiser–Meyer–Olkin test. The null hypothesis is tested to prove that the correlation matrix is an identity matrix of FRBC data set by using Bartlett's test of sphericity. Then Pearson test was used to test the correlation coefficients matrix. Subsequently, the extraction of communalities for each feature is conducted. The communalities indicated that the variance in each of the original features is explained by the extracted component. The summaries of 271 variances with relative importance for each feature are shown in Table 1.
Table 1: Descriptive summaries of variance, relative importance features
Varince
Number of
features
Relative importance features
0.80-0.99 241 88.95
0.60-0.79 17 6.26
< 9 13 4.79
Total 271 100
The components are extracted after the FRBC data set was prepared. In the component extraction phase, Cattell’s scree test was used to select the number of component return, which included plotting the eigenvalues of the component and examining the plot to find a point where the shape of the curve changes its direction. The recommendation is that all components that have large eigenvalues above the certain points (the elbow in the graph) should be retained because they contributed the most for the explanation of variance in the dataset. 8 components were chosen by this way with a threshold value of 0.60 for the loading component matrix [16]. The estimation score (ESS) of the PCA model was tested by using the Bartlett method to test the orthogonal components solution, which is calculated as follows [18,19] .
𝐸𝐸𝑆𝑆𝑆𝑆=∑8 𝑀𝑀𝑀𝑀𝑀𝑀
𝑖𝑖=1 (1)
ESS: is an estimation of score model
ML: is the maximum loading variable in factor
3.Evaluating Feature Reduction Results
After the feature reduction processes using PCA model we done, the resulting feature sets were tested. The evaluation of the PCA model is described in the following sections and the evaluation procedure of the obtained features using three classification methods are also given.
3.1 Evaluation of the PCA model
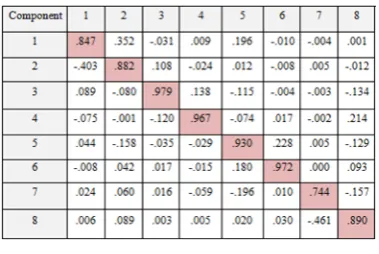
The evaluation of the PCA model was performed according to the identity and degree of rotation (DoR) matrices. DoR is measured by the average diameter of the component transformation matrix. It is the efficiency indicator of the rotation process to obtain the orthogonal components. The value of DoR should be more than 0.70. The component transformation matrix is presented in Table 3.
Table 3: Component Transformation or DoR Matrix
4.Classification using Obtained features
Classifications were performed using machine learning (ML) algorithms to test the features and component abilities in recognizing different types of RBCs. Three different supervised ML algorithms, each with its own properties, were applied using Weka software. The first algorithm is generative in the form of artificial neural networks (RBFNN), the second algorithm is discriminative in the form of support vector machines(SVM), and the third is a clustering algorithm, which is the K-nearest neighbor algorithm(KNN).
5.Classification Results
Feature reduction is computed by using the PCA technique for all features (normal and anemic) RBCs. The PCA technique reduced 271 features to 8 feature components, which created the new data set, CRBCs. Each component contains at least two features with a high loading value and a minimum 0.90 variance. The accuracy of the three ML classifications in the data set of features and components is shown in Table 4.
Table 4: Comparison between three Classification
ML- Algorithms Data
set
Accuracy% Time Sec.
KNN FRBCs 90 1.01
CRBCs 98 0.01
SMO-SVM FRBCs 92 6.97
CRBCs 97.9 1.89
RBFNN FRBCs 91.875 18478
CRBCs 98 2.36
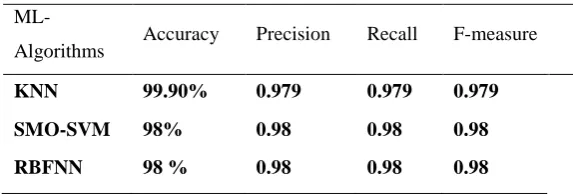
From table 4, the effected of PCA technique is clear, where increase the accuracy of the results of the classification task. In addition reducing training time especially in the RBFNN algorithm. The evaluation of classification performance of the three ML algorithms is presented in Table 5. It clearly show that the perfect performance of algorithms after using PCA tachniqe
Table 5: Evaluation results of the ML algorithms
ML-Algorithms Accuracy Precision Recall F-measure
KNN 99.90% 0.979 0.979 0.979
SMO-SVM 98% 0.98 0.98 0.98
RBFNN 98 % 0.98 0.98 0.98
6.Conclusion
extracted from anemic RBC images are not significant when observed independently but improved the percentage of accuracy when combined with other features. In addition, the reduction in time consumption was very clearly visualized in the training of RBFNN algorithms. The high classification results and the closeness of components indicated their strength.
References
[1] Savkare, S. S., and S. P. Narote. "Blood cell segmentation from microscopic blood images." Information Processing (ICIP), 2015 International Conference on. IEEE, 2015.
[2] Apostolopoulos, G. T. (2010). Recognition and identification of red blood cell size using angular radial transform and neural networks. In XII Mediterranean Conference on Medical and Biological Engineering and Computing 2010 .
[3] J. Ford (2013). Red blood cell morphology, International Journal of Laboratory Hematology, Volume 35, Issue 3,June 2013 ,Pages 351–357.
[4] Jones, K. W. (2009). "Evaluation of cell morphology and introduction to platelet and white blood cell morphology". Clinical Hematology and Fundamentals of Hemostasis , 93-116.
[5] Jameela Ail Alkrimi, L. E.-J. (2014)."Isolation and Classification of Red Blood Cells in Anemic Microscopic Images". World Academy of Science, Engineering and Technology, International Journal of Medical, Health, Biomedical, Bioengineering and Pharmaceutical Engineering 8, no. 10, 8(10), 727-730.
[6] Danglade, F., Veron, P., Pernot, J. P., & Fine, L. (2015). Estimation of CAD model simplification impact on CFD analysis using machine learning techniques.
[7] Domingos, P. (2012). A few useful things to know about machine learning. . Communications of the ACM,, 55(10), 78-87.
[8] Elsawy, A. S. (2013). Principal component analysis ensemble classifier for P300 speller applications. 8th International Symposium on In Image and Signal Processing and Analysis (ISPA), 2013, 444-44.
[9] Martín-Fernández, J. A., Pawlowsky-Glahn, V., Egozcue, J. J., & Tolosona-Delgado, R. (2017). Advances in Principal Balances for Compositional Data. Mathematical Geosciences, 1-26.
[10] David, Charles C., and Donald J. Jacobs (2014). Principal component analysis: a method for determining the essential dynamics of proteins. In Protein dynamics (pp. 193-226). Humana Press, Totowa, NJ.
[12] Nandi, D. A. (2015). Principal component analysis in medical image processing:a study. . International Journal of Image Mining, 1(1), 65-86.
[13] Vincent, I., Shin, B. K., Kwon, S. G., Lee, S. H., & Kwon, K. R. (2014, July). Feature Selection using Principal Component Analysis for Leukemia Classification. In Proceeding of the 10th International Conference on Multimedia Information Technology and Applications 2014 (pp. 206-207).
[14] Park, H. S. (2016). Automated Detection of P. falciparum Using Machine Learning Algorithms with Quantitative Phase Images of Unstained Cells. PloS one, 11(9).
[15] Sharma, N. M. (2012). Color image segmentaion techniques and issues: an approach. . International Journal of Scientific & Technology Research, 1(4), 9-12.
[16] Wheeless, L. L. (1994). Classification of red blood cells as normal, sickle, or other abnormal, using a single image analysis feature. Cytometry, 17(2), 159-166.
[17] Henson, R. K., & Roberts, J. K. (2006). Use of exploratory factor analysis in published research common errors and some comment on improved practice.Educational and Psychological measurement, 66(3), 393-416.
[18] Gibson, Ian, and Christopher Amies. "Data normalization techniques." U.S. Patent No. 6,259,456. 10 Jul. 2001.