Abstract—Buses are the most widely used in transit technology today. Due to the limited other types of public transportation, passenger demand for using the bus network is higher. In fact, static structure and real operation of bus scheduling have some difference with each other, due to some cases, such as traffic congestion and accumulation of delays of buses missions. The most different on bus operation elements is duration rush traffic period that standard deviation is very far in compare by duration light traffic period. Proper Schedule of bus service is a main issue in reliability of bus operation. In the present paper we compare the different bus operation elements that obtained by questionnaire duration rush and light traffic period. Hence, a case study based on an actual public bus operation in Tehran, Iran is used to demonstrate the differences.
Index Terms—Efficient bus lane, waiting time, average speed of bus operation, journey time.
I. INTRODUCTION
Scheduling of bus services is a plan for operating each of the buses, which is made by the Transport Company. Operating time and costs are the main parameters used by both passengers and operators of a public land transportation system.
Delay problems are the most important issue in transit operation performance measurement which need to be considered by the Transport Company when they want to prepare the transit schedule. Delays of transportation means are due to different reasons such as: delay in moving to the first station, more dwell time in the stations, and non-recovery of time lag in the traffic during progress of the operation. Since speed and acceleration is regulated, only time spent at a station can cause delay [1].
Bus operation includes scheduling, crew resting, running and supervision of vehicles, fare collection and system maintenance [2, 3]. An accurate bus operation schedule
Manuscript received February 11, 2012; revised March 26, 2012. M. H. Hafezi is with the Sustainable Urban Transport Research Centre (SUTRA)/, Department of Civil and Structural Engineering, Faculty of Engineering and Built Environment, Universiti Kebangsaan Malaysia, 43600 UKM Bangi, Selangor Darul Ehsan, Malaysia (e-mail: hafezi23@ eng.ukm.my).
A. Ismail is with head of Sustainable Urban Transport Research Centre (SUTRA)/, Department of Civil and Structural Engineering, Universiti Kebangsaan Malaysia (e-mail: abim@ eng.ukm.my).
R. A. Al-Mansob is with the Sustainable Urban Transport Research Centre (SUTRA)/, Department of Civil and Structural Engineering, Faculty of Engineering and Built Environment, Universiti Kebangsaan Malaysia (e-mail: [email protected]).
O. K. Seifabad is with Shoushtar Branch, Department of Urbanity and civil Engineering, Islamic Azad University Shoushtar Branch- Iran (e-mail: [email protected]).
which considers actual arriving and departure time is essential for bus companies, due to high passenger demand [4, 5].
The path of a route is difficult to change once in place, but, the local bus stops along the route may be able to be reviewed biennially. Also, the schedule of buses can be changed normally with the season of the year [6].
Increasing car ownership and use has generally proved unfavorable for bus operation, particularly, where the spiral of increasing road congestion and poor bus reliability has led people to purchase and use cars instead of buses [7]. Bus service performance measurement is based on unit departures per hour [2]. This is achieved through the valuation of these parameters; service frequency, operating speed, reliability, safety, line capacity, productive capacity, productivity and utilization.
Service frequency is the period buses are in motion during their mission, throughout the day [8, 9]. It is the main issue in increasing reliability. Proper headway of buses along the route can reduce delays in arrivals of buses at each stop [10, 11].
Operating speed usually is defined as average speed in total traveling time. Reliability is expressed as a percentage of vehicle arrivals with less than a fixed time deviation from the schedule.
This depends on traffic conditions along the route. Safety is measured by number of fatalities, injuries and accidents. Line capacity is maximum number of spaces, which includes seats and standing space. Productive capacity is the product of operating speed and capacity of the line. Using the full capacity of buses can decrease operating costs.
Productivity is the quantity of output per unit of resource space-km. Utilization is the ratio of output to input person-km/space-km.
The most difficult time is during weekdays, and especially during rush traffic periods. During this time, buses are sent out from origin or destination terminal according to their normal planning schedule but they do not achieve the same headway to bus bays along their route, and also do not return to terminal in line with the planning, because of the negative impact of rush traffic periods, which disrupts the planned schedule [12, 13].
II. QUESTIONNAIRE DESIGN
Many research projects needs to collection of primary data for validation and measurements of their funding. Questionnaires are often the best way of gathering such information and views.
For obtaining the best results of questionnaire it is
Comparative Analysis on Bus Operation Duration
Light and Rush Traffic Period
necessary that questions is designed based on the major research objectives.
There are many different types of question and in the main, these falls into open and closed questions. In the first type, responders can to use their own words to answer. So, in the second type, questioners give them pre-defined options.
Furthermore, questions in the questionnaires can divides in two main categories: stated preference and revealed preference.
The main emphasis in the stated preference questions category is in the quality and modality. Researcher with designed these questions will to understand about responders satisfactory and quality of services.
On the other hand, the main emphasis in the revealed preference questions category is in the disclose and detection. The most useful information in the questionnaires is obtained by this category. Results of this section can helps to solving the research problem and detecting the main variation [14].
Respondents should be selected so that covers all kinds of the sample of population. Population is all the members of the group that researcher is interested in.
Sample is the subset of the population selected to receive the questionnaire. Finally, respondents are the subset of the sample that actually complete and return the questionnaire.
Having created the questionnaire, it is significant that before the main collecting this tested it out on a small target group that called pilot study before circulate it more widely. This will helps to highlight any ambiguity in the wording of the questions. Also, discover that in order to analyses the data in the way researcher want, researcher needs some extra questions. Or researcher may find out that some questions are superfluous [15].
To obtaining the sample size it is necessary to know how much error are willing to tolerate, how many people are in the population. Then, can to calculate the sample size with 90%, 95% or 99% confidence. So, per 20 persons in sample size 1 person is needed to obtaining the pilot study sample size [16]. Questionnaire design in this present study is provided by two main sections, with each section consisting of stated and revealed preference. Most questions in the first section are about the demographic profile of the respondents (gender, age, educational attainment, monthly income and occupation), and the data provided is based on the stated preference. This section can help to understand about various sectors of the people who use the bus operation.
Furthermore, information about bus operation users can help to analyse the second part of the questionnaire, which is provided by the revealed preference.
The question design of the second section was based on the identification of the different elements of the bus operation, and the achievement of different bus operation during rush and light traffic periods. Bus services questionnaire collection is provided for two levels: pilot study and actual study. In the first level, pilot study, the questionnaire is filled in by some people selected from the whole of the sample size, for understanding and modification of questions, to better achieve the objectives of the study. Some people from bus passengers and some people from the Bus Company are chosen for the pilot study.
After doing the pilot study, these questionnaires will be analyzed, and the results will be compared with the main
objectives of the study. After modification of the questionnaires, the actual study will be conducted based on the whole of the sample size.
The questionnaire explained below identifies our research objectives and outlines the designing of the research. The questionnaire makes it easy to give the critical information, and for the interviewer to verify the answers and to organize a sound analysis and explanation as well. Questions are analyzed and prepared to handle missing data. It expected that this approach will guarantee an excellent questionnaire design, and provide an accurate but quick approach to the definition of related parameters. The questionnaire expands to directly address the objectives of the research.
III. SAMPLE SIZE
For obtaining the sample size it was necessary to determine some parameters, namely, error toleration, population and estimated response rate. In the present study the value of error toleration is assumed at 5%. Population is obtained by multiplying total number of passengers transferred in one hour by total operation time in the weekday.
Total number of passengers transferred in one hour in the case study bus line is 3884 persons, and total operation time is 15 hours. To achieve a 95% confidence level, the minimum survey respondents needed is 382.
In the next step, the total number of people that should receive the survey and return the completed form is obtained. For an 85% estimated response rate, the minimum people are 449.
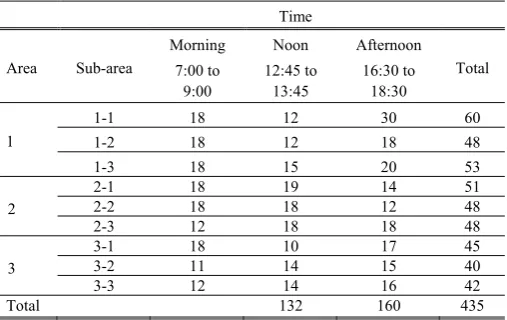
Table I is a summary of questionnaires collected in area research according to time. Total number of questionnaires collected in the research is 435.
Total area is divided into three sub-areas, and questionnaire collection is done in three different traffic periods (morning between 7.00 a.m. and 9.00 a.m., noon between 12.45 p.m. and 13.45 p.m. and afternoon between 16.30 p.m. and 18.30 p.m.).
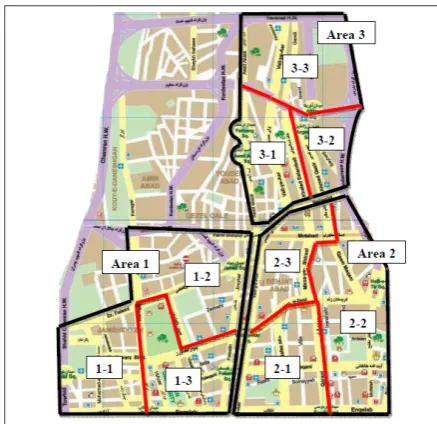
Distribution of questionnaires is chosen according to bus line traffic and passenger demand. Map of area No.6 in Tehran, in addition to the sub-area study, is shown in Fig. 1 Research area and sub-areas are divided into three major places. The northwest of the research area is not considered for data collection, due to the presence of three major highways, and different traffic flow situation at other points.
TABLEI:DISTRIBUTION OF QUESTIONNAIRES COLLECTED
Time
Area Sub-area Morning
7:00 to 9:00
Noon 12:45 to
13:45
Afternoon 16:30 to
18:30
Total
1
1-1 18 12 30 60 1-2 18 12 18 48 1-3 18 15 20 53
2
2-1 18 19 14 51 2-2 18 18 12 48 2-3 12 18 18 48
3
3-1 18 10 17 45 3-2 11 14 15 40 3-3 12 14 16 42
Fig. 1. Map of research area and sub-area in Tehran, Iran
IV. COMPARATIVE ANALYSIS ON BUS OPERATION
Bus services questionnaire in this study was responded to by 435 participants. Total number of the responded is chosen by consideration 5% tolerate of error and 95% confidence (according to sample size calculation a minimum 382 persons was needed).
Pilot study in the present study is related to completing bus questioners, in relation to research objective from passengers point of view. A pilot study is provided due to ensure that the ideas or methods behind a research idea are sound, as well as to work out the kinks in a study protocol before launching a larger study. 19 questions are considered for pilot study that after completed questionnaires by around 25 responders, 17 questions are considered for final research questionnaire (according to pilot study calculation a minimum 21 persons was needed). Structure of some questions is changed. For instance, for average monthly income question, a range of answers is added to choices that respondents could choose one of them. This range is provided according to local level of life welfare. This change can help to understanding relationship between monthly income and uses of private car or buses network.
Responders were different people in different occupations, namely, students, bankers, laborers, etc. They filled in questionnaire forms in the bus stop, in-bus or on the sidewalk.
The Gender of the respondents is categorized as male and female as shown in Fig. 2.
Fig. 2. Gender of the respondents
Sixty eight percent (68%) of the respondents were male and thirty two percent (32%) of the respondents were female. The higher percentage of males shows that most of bus service passengers are men, working outside the home.
The time of buses uses of the respondents is categorized in the two groups in week as shown in Fig. 3.
Fig. 3. Time of buses uses
Sixty seven percent (67%) of the respondents were in weekdays. Thirty three percent (33%) of the respondents were in the weekend. The survey indicates that the most of them used the buses in weekdays, due to more commuting to workplaces and offices, and in weekends bus usage is low, and they will be using the private car for travel.
The most time for using buses of the respondents is categorized in the six ranges as shown in Fig. 4.
Fig. 4. Most time for using buses
Thirty percent (30%) of the respondents were using buses before 07:00 a.m. Twenty four percent (24%) of the respondents were between 13:00 p.m. and 17:00 p.m. Respondents using buses between 07:00 a.m. and 09:00 a.m. were 19% of the total respondents. On the other hand, 15% of the respondents are using of buses after 19:00 p.m. Eleven percent (11%) of the respondents were using buses between 17:00 p.m. and 19:00 p.m. Lastly, there is one percent (1%) of respondents who were using of buses between 09:00 a.m. and 13:00 p.m. This survey also indicates that all segments of society by different monthly incomes used buses. The survey indicates that the busiest times for use of buses are before 07:00 a.m. and between 13:00 p.m. and 17:00 p.m.
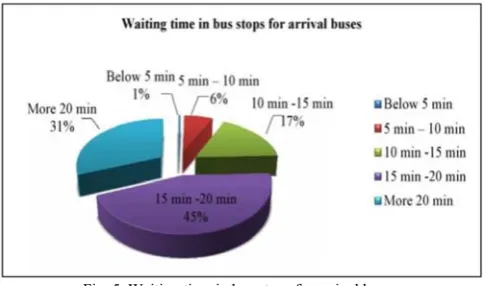
Fig. 5. Waiting time in bus stops for arrival buses
Forty five percent (45%) of the respondents had waiting time between 15 and 20 minutes. Thirty one percent (31%) of the respondents waited more than 20 minutes.
Respondents waiting between 10 and 15 minutes were 17% of the total respondents. On the other hand, 6% of the respondents had waiting time between 5 and 10 minutes.
Lastly, there is one percent (1%) of respondents whose waiting time was below 5 minutes. The survey indicates that most respondents were waiting at bus stops for arrival of buses between 15 and 20 minutes.
The On-time arrivals of buses of the respondents are categorized in the five groups as shown in Fig. 6.
Fig. 6. On-time arrivals of buses
Fifty five percent (55%) of the respondents chose low level. Forty four percent (44%) of the respondents chose medium level. And, four percent (4%) of the respondents chose high level. The survey indicates that on-time arrival of buses is in low level.
The available empty seats in buses of the respondents are categorized in the four groups as shown in Fig. 7.
Fig. 7. Available empty seats in buses
Relationships between time periods of bus journeys and
on-time arrival of buses are summarized in Table II.
TABLEII:RELATIONSHIPS BETWEEN TIME PERIODS OF BUS JOURNEYS AND ON-TIME ARRIVALS
Time periods of buses
uses On-time arrival of buses value
7.00 a.m. – 9.00 a.m.
Low 59% Medium 34%
High 7%
17.00 p.m. – 19.00 p.m.
Low 48% Medium 47%
High 5%
Other time
Low 57% Medium 39%
High 3%
Time periods of bus journeys are divided into three categories: first category is between 07.00 a.m. and 09.00 a.m., second category is between 17.00 p.m. and 19.00 p.m. and third category is other times.
In the first category, fifty nine percent (59%) of respondents chose low level for on-time arrival of buses. Thirty four percent (34%) of respondents chose medium level. And, seven percent (7%) of respondents chose high level. On the other hand, in the second category, forty eight percent (48%) of respondents chose low level for on-time arrival of buses. Forty seven percent (47%) of respondents chose medium level. And, five percent (5%) of respondents chose high level.
Lastly, in the third category fifty seven percent (57%) of respondents chose low level for on-time arrival of buses. Thirty nine percent (39%) of respondents chose medium level. And, three percent (3%) of respondents chose high level. The survey indicates that the most of them chose the low level for on-time arrival of buses in bus operation time.
Table III is a summary of relationships between time periods of bus journeys and waiting time.
TABLEIII:RELATIONSHIPS BETWEEN TIME PERIODS OF BUS JOURNEYS AND WAITING TIME
Time periods of
buses uses Waiting time in bus stop value
7.00 a.m. – 9.00 a.m.
Below 5 min 1%
5 min to 10 min 5% 10 min to 15 min 12% 15 min to 20 min 44% More than 20 min 40%
17.00 p.m. – 19.00 p.m.
Below 5 min 0%
5 min to 10 min 7% 10 min to 15 min 16% 15 min to 20 min 55% More than 20 min 23%
Other time
Below 5 min 1%
5 min to 10 min 6% 10 min to 15 min 18% 15 min to 20 min 44% More than 20 min 32%
Time periods of bus journeys are divided into three categories, same as Table 4.7. Waiting times in bus stops for arrivals of buses are divided into five periods: below 5 min (a), 5 min to 10 min (b), 10 min to 15 min (c), 15 min to 20 min (d) and more than 20 min (e).
And, forty percent (40%) of respondents chose (e).
On the other hand, in the second category, zero percent (0%) of respondents chose (a). Seven percent (7%) of respondents chose (b). Sixteen percent (16%) chose (c). Fifty five percent (55%) of respondents chose (d). And, twenty three percent (23%) of respondents chose (e).
Lastly, in the third category, one percent (1%) of respondents chose (a). Six percent (6%) of respondents chose (b). Eighteen percent (18%) of respondents chose (c). Forty four percent (44%) of respondents chose (d). And, thirty two percent (32%) of respondents chose (e). The survey indicates that most of them chose the waiting time between 15 and 20 minutes in bus stops for arrivals of buses.
Relationships between time periods of bus journeys and available empty seats are summarized in Table IV.
TABLEIV:RELATIONSHIPS BETWEEN TIME PERIODS OF BUS JOURNEYS AND AVAILABLE EMPTY SEATS
Time periods of buses uses Availability empty seats in
buses value
7.00 a.m. – 9.00 a.m.
0% - 25% 27%
25% - 50% 34%
50% - 75% 22%
75% - 100% 18%
17.00 p.m. – 19.00 p.m.
0% - 25% 3%
25% - 50% 4%
50% - 75% 50%
75% - 100% 43%
Other time
0% - 25% 21%
25% - 50% 44%
50% - 75% 25%
75% - 100% 10%
Time periods of bus journeys are divided into three categories, the same as Table 4.7. Available empty seats in buses are divided into four shares: 0% - 25% (a), 25% - 50% (b), 50% - 75% (c) and 75% - 100% (d).
In the first category, twenty seven percent (27%) of respondents chose (a). Thirty four percent (34%) of respondents chose (b). Twenty two percent (22%) of respondents chose (c). And, eighteen percent (18%) of respondents chose (d). On the other hand, in the second category, three percent (3%) of respondents chose (a). Four percent (4%) of respondents chose (b). Fifty percent (50%) of respondents chose (c). And, forty three percent (43%) of respondents chose (d).
Lastly, in the third category, twenty one percent (21%) of respondents chose (a). Forty four percent (44%) of respondents chose (b). Twenty five percent (25%) of respondents chose (c). And, ten percent (10%) of respondents chose (d).The survey indicates that the chance for seating in the buses is around 50 percent (50%).
V. CONCLUSION
During light traffic periods buses can follow their scheduling exactly, as there is no traffic congestion and demand is lower. Also, bus operations at weekends and holidays have similar behavior.
Bus operation during rush traffic periods faces disruption of schedules, because of traffic jams, vehicles queues at intersections and long waiting times at traffic lights (Carlos and Luis 2009). Also, passenger demand is higher than normal, and due to limited capacity of buses and fleet size, boarding and alighting passengers takes more time. In this situation, bus authorities are forced to increase fleet size for compensation of scheduling. Which and this practice causes increased operating cost (Chen et al. 2009).
ACKNOWLEDGMENT
We thank the Fara Tarabar Mahdi Bus Company for providing the test data. We would like also to thank Engr. Mohammad Hadi Hafezi for his help in the preparation of this paper.
REFERENCES
[1] S. Yan and H.-L. Chen, “A scheduling model and a solution algorithm for inter-city bus carriers,” Transportation Research Part A: Policy and Practice, vol. 36, no. 9, pp. 805-825, 2002.
[2] V.R. Vuchic, “Urban Public Transportation,” Facsimile ed. 1981: Prentice Hall College Div.
[3] S. Grava, “Urban Transportation Systems,” 1 ed. 2002: McGraw-Hill Professional.
[4] M. Dessouky, R. Hall, L. Zhang, and A. Singh, “Real-time control of buses for schedule coordination at a terminal,” Transportation Research Part A: Policy and Practice, vol. 37, no. 2, pp. 145-164, 2003.
[5] S. C. Wirasinghe and U. Vandebona, “Route layout analysis for express buses,” Transportation Research Part C: Emerging Technologies. In Press, Corrected Proof.
[6] D. Meignan, O. Simonin, and A. Koukam, “Simulation and evaluation of urban bus-networks using a multiagent approach,” Simulation Modelling Practice and Theory, vol. 15, no. 6, pp. 659-671, 2007. [7] X. Chen, L. Yu, Y. Zhang, and J. Guo, “Analyzing urban bus service
reliability at the stop, route, and network levels,” Transportation Research Part A: Policy and Practice, vol. 43, no. 8), pp. 722-734,
2009.
[8] Á. Ibeas, L. dell'Olio, B. Alonso, and O. Sainz, “Optimizing bus stop spacing in urban areas,” Transportation Research Part E: Logistics and Transportation Review, vol. 46, no. 3, pp. 446-458.
[9] J.-C. Bermond and F. Ö. Ergincan, “Bus interconnection networks,”
Discrete Applied Mathematics, vol. 68, no. 1-2, pp. 1-15, 1996. [10] T. Nagatani, “Interaction between buses and passengers on a bus
route,” Physica A: Statistical Mechanics and its Applications, vol. 296, no. 1-2, pp. 320-330, 2001.
[11] S.-W. Lam, L.-C. Tang, T.-N. Goh, and T. Halim, “Multiresponse optimization of dispatch rules for public bus services,” Computers and Industrial Engineering, vol. 56, no. 1, pp. 77-86, 2009.
[12] D. L. van Oudheusden and W. Zhu, “Trip frequency scheduling for bus route management in Bangkok,” European Journal of Operational Research, vol. 83, no. 3, pp. 439-451, 1995.
[13] S. K. Hwe, R. K. Cheung, and Y.-w. Wan, “Merging bus routes in Hong Kong's central business district: Analysis and models,”
Transportation Research Part A: Policy and Practice, vol. 40, no. 10, pp. 918-935, 2006.
[14] C. Sun, W. Zhou, and Y. Wang, “Scheduling Combination and Headway Optimization of Bus Rapid Transit,” Journal of Transportation Systems Engineering and Information Technology, vol. 8, no. 5, pp. 61-67, 2008.
[15] Y. Fang, H. Xiangpei, W. Lirong, and M. Yidi, “A Real-Time Scheduling Method for a Variable-Route Bus in a Community,” in
Advances in Intelligent Decision Technologies, G. Phillips-Wren, et al.,
Editors. 2010, Springer Berlin Heidelberg. pp. 239-247.
Engr. Mohammad Hesam Hafezi was born on September 21, 1986. He received the B.S. degree in Civil Engineering from the faculty of Engineering, IH University, Tehran, Iran in 2008. He has been project manager and designer in Beton Aseh civil and infrastructure company since July 2008 to July 2010. Currently, he is pursuing his study in master degree in Sustainable Urban Transport Research Centre (SUTRA)/, Department of Civil and Structural Engineering, Universiti Kebangsaan Malaysia, 43600 UKM Bangi, Selangor Darul Ehsan, Malaysia.
His research interest is planning public transportation and Intelligent Traffic Control.
Prof. Engr. Dr. Amiruddin Ismail obtained his PhD
in Civil and Structural Engineering (Transportation Engineering - Driver Behaviour) from Universiti Kebangsaan Malaysia (UKM) in 2002, MSCE from University of Pittsburgh, USA in 1984 and BSCE from Point Park College, USA in 1983. Currently, he is the Head of Sustainable Urban Transport Research Centre (SUTRA), Faculty of Engineering and Built Environment, UKM. He is a member of the UK Chartered Institution of Highways and Transportation (CIHT), Road Engineering Association of Malaysia (REAM), Road Engineering Association of Asia and Australasia (REAAA), Transportation Science Society of Malaysia (TSSM) and The Malaysian Academy of Islamic Science (ASASI). His areas of research are in transportation engineering (traffic engineering) specialising in drivers’ lane-changing behaviour on
urban roads, traffic accidents, transport planning and modelling, traffic control and management, sustainable transportation, pavement engineering and construction management of transportation projects.
Engr. Ramez Al-Ezzi Al-Mansob was born in April
10, 1980 in Lebanon. He received bachelor in civil engineering from the faculty of Engineering, University of Sana’a, Yemen in 2005. He has worked as highway designer and site Engineer for road construction project in Sana’a- Arhab- Aljawf road between August 2005 and Jun 2007. He received master in civil Engineering from the faculty of Engineering, National University of Malaysia, Malaysia. Now he is a PhD candidate in the Faculty of Engineering, National University of Malaysia, Malaysia since January 2010. His research interest is Highway Engineering (Highway Design and Construction, Pavement Materials, Mix Design).
Engr.Omran Kohzadi Seifabad was born on
August 28, 1974. He received the B.S. degree in urbanization from Tabriz University, Iran, Tabriz in 1995. He received the MSc degree in urbanization from Tehran University, Iran, Tehran in 2005. He has been full time lecturer of Shoshtar Islamic Azad University since 2005. Currently, he is pursuing his study in Doctor of Philosophy degree in Department of Civil and Structural Engineering, Universiti Kebangsaan Malaysia in field of urbanization. He interested in doing urbanization researches.