Abdu Hamoud Al-Khawlany et al., IJSRR 2018, 7(1), 74-84
IJSRR, 7(1) Jan. – March, 2018 Page 74
Research article
Available online www.ijsrr.org
ISSN: 2279–0543
International Journal of Scientific Research and Reviews
Measurement of Linear and Mass Absorption Coefficients in some soil
samples foruse in shields against Gamma-rays from different Nuclides.
Abdu Hamoud Al-khawlany
1*, Khan A. R.
2and Pathan J. M.
31
Research Student Maulana Azad College, Dr. Babasaheb Ambedkar University, Aurangabad Maharashtra, India
2
HOD, PG Department of Computer Science, Maulana Azad College, Aurangabad, Maharashtra India
3
Assistance Professor, Department of Physics,Maulana Azad College, Aurangabad, Maharashtra India
ABSTRACT
The liner and mass absorption coefficient of various soil samples (density ranges between
1.1308 and 1.3959gcm-3) collected from four sites distributed in Aurangabad region of India have
been determined for gamma ray sources 133Ba, 137Cs, 22Na, 60Co with gamma- ray energy of
0.360MeV, o.662MeV,1.28MeV and 1.33 MeV using gamma spectrometry NaI scintillator/PMT detector and MCA system. Attenuation coefficient is of interest to scientists and research in different areas of present day technology.Samples are prepared using standard techniques and the attenuation constants estimated are presented. It is found that the linear attenuation coefficient is in the range of
1.0520 to 1.0813, 1.0645 to 1.1603, 1.0387 to 1.1504 and 1.0336 to 1.1115 cm-1 for 133Ba, 137Cs,
22
Na and 60Co respectively. Also the mass attenuation coefficient is found in the range of 0.7687 to
0.9562, 0.7632 to 0.9648, 0.8130 to 0.9336 and 0.7794 to 0.9140 cm2/gm for 133Ba, 137Cs, 22Na and
60
Co respectively. The work presented is part of a survey recently conducted with larger database. In general, mass attenuation coefficients determined in this study can be used for determination of gamma emitters in any soil samples. This method is useful for the study of properties the soils in agriculture purposes.
KEYWORDS-
Linear and mass attenuation coefficient, Gamma ray, Multichannel analyzer, Soil sample.
*Corresponding Author
Abdu Hamoud Al-khawlany
Research Student Maulana Azad College, Dr. Babasaheb Ambedkar University, Aurangabad
Maharashtra, India-431001.
Abdu Hamoud Al-Khawlany et al., IJSRR 2018, 7(1), 74-84
IJSRR, 7(1) Jan. – March, 2018 Page 75
INTRODUCTION
The gamma-ray attenuation technique is based on the interaction of radiation with matter. When the
photons interact with certain material, they might be scattered or absorbed1.The probability of
interaction of this photon per unit of length of a given absorber characterizes its linear attenuation
coefficient (μ).However, μ depends on the material physical state and for this reason it is usually
substituted by the mass attenuation coefficient (μm ),which is the μ divided by the density2.Accurate
measurements of μ are of interest in fundamental physics and applied fields such as radiation
protection and dosimeter, nuclear diagnostics and medicine, soil science, and engineering. This
physical property is used in many applications such as X-ray fluorescence, X-ray tomography,
gamma-ray tomography, and gamma-ray attenuation.The study of attenuation coefficient of various
materials has been an important part of research in Radiation Chemistry, Physics, agriculture and
human health.
Aurangabad is an industrial hub with lot of industrial activity and monitoring of radioactivity and
related aspects is one of the concerns. A property of soil like attenuation coefficient is widely used in
industry, science and technology for a variety of applications3,4. The attenuation constant of a soil
sample mainly depends on its constituents. Linear attenuation coefficient is one of the fundamental
parameter that is important for characterization of the diffusion and penetration of gamma rays in a
given medium5. Study of linear and mass attenuation of other materials of interest to biology and
biotechnology such as proteins that is supposed to be most abundant macro molecule in living
organisms has also been a subject of interest in this area6,7. Mass attenuation coefficients of
gamma-rays in some compounds and mixtures of dosimetric and biological importance have been compiled
in the energy range 1KeV to 20 MeV8. The prominent interactions between the photons and atoms
are the photoelectric effect, the Compton scattering and the pair production processes in addition to
other types of interactions in a wide range of energies, lot of work is documented along these
lines9,10. The present work aims at the estimation of attenuation coefficient of selected soil samples
from outskirts of Aurangabad, Maharashtra (India) as this is a historic region with a documented
history and having monuments of world heritage for tens of centuries. Attenuation coefficient is a
basic quantity used in calculation of penetration of radiation through materials. The linear attenuation
coefficient, also called the narrow beam attenuation coefficient, is a quantity, which describes the
extent to which the intensity of a beam is reduced as it passes through the material due to absorption
Abdu Hamoud Al-Khawlany et al., IJSRR 2018, 7(1), 74-84
IJSRR, 7(1) Jan. – March, 2018 Page 76 Liner attenuation coefficient and mass absorption are two parameters widely used in the study of
gamma rays. These parameters mainly depend on various factors including photon energy, nature of
absorber and the medium through which radiation passes. The linear attenuation coefficient gives
information about the effectiveness of a given material per unit thickness, in promoting photon
interactions. The large value of attenuation coefficient is more likely to the given photon energy will
interact in a given thickness of material. The magnitude of attenuation coefficient varies with
material and its density, as we imply, with photon energy, while specific values of the attenuation
coefficient will vary among materials forphotonsof specified energy. We studied the linear and mass
attenuation coefficient in selected soil samples using gamma ray sources 133Ba, 137Cs, 22Na, 60Co
with gamma- ray energy of 360 KeV, 662KeV, 1280KeV and 1330KeV.
EXPERIMENTAL SECTION
The soil samples were collected from four selected locations from outskirts of Aurangabad
and standard initial preparations of the samples were implemented that includes drying, powdering
and sieving. The location details of the four locations where from samples are drawn is shown in Fig.
1 and Table–1.
Abdu Hamoud Al-Khawlany et al., IJSRR 2018, 7(1), 74-84
IJSRR, 7(1) Jan. – March, 2018 Page 77
Table – 1: Location details showing latitude and longitude.
Spot. No Sample Location Latitude Longitude
1 Harsul Tank 19.926436 75.329620
2 Ohar 19.946103 75.313918
3 Jatwada 19.956592 75.285846
4 Tanda Turn 19.966837 75.273615
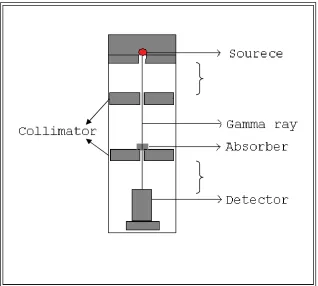
Gamma ray spectrometer with 2"x2"NaI(Tl) detector was used for measuring the intensity of
gamma rays and the sources used were 133Ba , 137Cs, 22Na and 60Co with gamma-ray energy of
360KeV, 662 KeV, 1280KeV and 1330KeV respectively. It has been procured from the Bhabha
Atomic Research Centre, Mumbai. It was well shielded by means of lead bricks. For the narrow
beam setup, the gamma ray beam from the source was collimated by using a cylindrical lead block
with a central hole ofdiameter 1cm. The transmitted beam was also collimated using a similar lead
cylinder. The absorbers used were lead sheets of dimensions 5cm x 5cm and had thickness of 0.9 gm
/cm2. The detector was placed in a lead castle with proper shielding and arrangement was provided
for placing the sample above the detector and at the top of the sample holder source with γ ray source
was mounted at a fixed place as shown in Fig. 2.
Abdu Hamoud Al-Khawlany et al., IJSRR 2018, 7(1), 74-84
IJSRR, 7(1) Jan. – March, 2018 Page 78 The multichannel analyzer used with the gamma-ray spectrometer had 8 K channels and the
channel numbers were set corresponding to the γ ray photo-peak of radiation sources energy. The
sample cell was a cylindrical container made of plastic and the powdered soil sample after due
preparation was placed in the cell and the sample cell was placed in the sample holder provided in
the detector housing. Diameter of the sample cell was 4.2 cm and height was 5.1 cm thus the
available volume is 70.62 cm3.
Once the gamma ray scintillation counter assembly is ready and set to appropriate channel
background count was found taking several readings. The incident gamma ray intensity Io was
determined using the standard source keeping the channel number at the photo-peak of the gamma
radiation used, and no sample in the sample cell. For determination of gamma intensity I at different
sample thickness the sample cell was filled with fixed amount of soil sample (say 1, 2 … cm thick
layer) and kept between the source and detector in the sample holder present in the lead castle.
Counting was done for suitable time interval and several trials were used and the average count was
recorded for each sample thickness used. From the count representing the γ ray intensity, background
count was subtracted to find I. A graph is plotted using Io (incident γ ray intensity) and I (transmitted
γ ray intensity) versus the thickness for each sample as shown in some Figures 3–6.
Fig-3: The thickness versus Io/I for the soil sample–1 using Ba–133 of Energy 360keV. y = 0.056x + 0.994
R² = 0.984
0.0 0.4 0.8 1.2 1.6
0 1 2 3 4 5 6
Io
/I
Sample Thickness (cm)
Data
Abdu Hamoud Al-Khawlany et al., IJSRR 2018, 7(1), 74-84
IJSRR, 7(1) Jan. – March, 2018 Page 79
Fig–4: The thickness versus Io/I for the soil sample–2 using Cs–137 of Energy 660keV.
Fig–5: The thickness versus Io/I for the soil sample–3 using Na–22 of Energy 1280keV.
y = 0.0581x + 1.0694
R
2= 0.9406
0.0
0.4
0.8
1.2
1.6
0
1
2
3
4
5
6
Sample Thickness (cm)
Io
/I
Data (Sample-2)
Best Fit Line
y = 0.106x + 1.018 R² = 0.947
0.0 0.4 0.8 1.2 1.6 2.0
0 1 2 3 4 5 6
Io
/I
Sample Thickness (cm)
Data
Abdu Hamoud Al-Khawlany et al., IJSRR 2018, 7(1), 74-84
IJSRR, 7(1) Jan. – March, 2018 Page 80
Fig–6: The thickness versus Io/I for the soil sample–4 using Co–60 of Energy 1330keV.
It is seen from all Figures above that all the points lay well along a straight line, the points plotted
represent the actual data i.e. the value of Io/I corresponding to each thickness of the sample and the
straight line joining to those points is the leas square fit straight line. The equation shown in the inset
of the graphs is the equation to the fitting straight line and the coefficient of x is the slope (m) and
the constant in the equation is the intercept on the y–axis (c), the values of m and c are used in
calculation of the attenuation constant μ and μm.
RESULT AND DISCUSSION
The linear attenuation coefficient and mass attenuation coefficient for soil samples from four
selected locations (S1 – S4) are shown in Tables 2–5.
Table–2: Attenuation coefficient of soil samples using Ba–133 of Energy 360 keV:
Sample. No
Soil density(ρ)
gm/cc Slope(m)
Intercept on Y axis(c)
Linear absorption Coefficientμ (cm–1)
Mass attenuation Coefficient (µ/ρ) (cm2/g)
1 1.3959 0.0566 0.9940 1.0730 0.7687
2 1.2662 0.0786 0.9525 1.0520 0.8308
3 1.2322 0.0580 0.9998 1.0713 0.8694
Abdu Hamoud Al-Khawlany et al., IJSRR 2018, 7(1), 74-84
IJSRR, 7(1) Jan. – March, 2018 Page 81
Table–3: Attenuation coefficient of soil samples using Cs–137 of Energy 662 keV:
Sample. No
Soil density(ρ)
gm/cc
Slope(m) Intercept on Y-axis(c)
Linear absorption Coefficientμ (cm–1)
Mass attenuation
coefficient(µ/ρ)(cm2/g)
1 1.3959 0.0894 0.9406 1.0654 0.7632
2 1.2662 0.0581 1.0694 1.1430 0.9027
3 1.2322 0.0939 1.0446 1.1603 0.9416
4 1.1308 0.2492 0.8092 1.0910 0.9648
Table–4: Attenuation coefficient of soil samples using Na–22 of Energy 1280 keV: Sample.
No
Soil density(ρ)
gm/cc Slope(m)
Intercepton Y-axis(c)
Linear absorption Coefficientμ (cm–1)
Mass attenuation Coefficient(µ/ρ)(cm2/g)
1 1.3959 0.1702 0.8973 1.1349 0.8130
2 1.2662 0.2004 0.7849 1.0387 0.8203
3 1.2322 0.1068 1.0188 1.1504 0.9336
4 1.1308 0.0361 0.9998 1.0406 0.9202
Table–5: Attenuation coefficient of soil samples using Co–60 of Energy 1330 keV:
Sample. No
Soil density(ρ)
gm/cc
Slope(m) Intercepton Y-axis(c)
Linear absorption Coefficientμ (cm–1)
Mass attenuation Coefficient(µ/ρ)(cm2/g)
1 1.3959 0.0713 0.9885 1.0880 0.7794
2 1.2662 0.0566 1.0070 1.0787 0.8519
3 1.2322 0.0524 1.0469 1.1115 0.9020
4 1.1308 0.0355 0.9935 1.0336 0.9140
The linear and mass attenuation coefficients of soil samples collected from four selected
locations from the outskirts of Aurangabad, Maharashtra, India, has been determined for gamma
radiation from 133Ba,137Cs, 22Na and 60Co with γ ray energy of 360KeV,662 KeV,1280KeV and
1330KeV using gamma ray spectrometry.From the slope of the above Figures and according to the
equation
m
c
it was found that the linear attenuation coefficient of soil samples and theratio of the linear attenuation coefficient µ (cm-1) to the density ρ (gm cm-3) is called the mass
attenuation coefficient (µ/ρ) and has the dimension of area per unit mass (cm2/gm). In the present study, the mass attenuation coefficient has been calculated using the following
relation,µm= µ/ρ
Where, ρ- is the density of the thin absorber and µ-is the linear attenuation coefficient.It was
Abdu Hamoud Al-Khawlany et al., IJSRR 2018, 7(1), 74-84
IJSRR, 7(1) Jan. – March, 2018 Page 82
(I0) per number of particles of radiation counted with absorber (I) were linearly increased with
increasing thickness. Also, as the density of soil increases, mass attenuation coefficient decreases
exponentially as shown in the Figures.7–9. This confirms the contribution of photoelectric
absorption, Compton scattering and pair production to the absorption of gamma rays by the soil
samples.
Fig–7: The mass attenuation coefficient versus the soil density using Ba–133 of Energy 360 keV.
Fig–8: The mass attenuation coefficient versus the soil density using Na–22 of Energy 1280 keV.
y = 2.402e-0.82x
R² = 0.977
0.60 0.65 0.70 0.75 0.80 0.85 0.90 0.95 1.00
1 1.1 1.2 1.3 1.4 1.5
M a ss A tt e n u a tio n C o ef fic ie n t
Soil Density (gm/cc)
y = 1.678e-0.52x
R² = 0.607
0.60 0.65 0.70 0.75 0.80 0.85 0.90 0.95 1.00
1 1.1 1.2 1.3 1.4 1.5
M a ss A tt e n u a tio n C o e ff ic ie n t
Abdu Hamoud Al-Khawlany et al., IJSRR 2018, 7(1), 74-84
IJSRR, 7(1) Jan. – March, 2018 Page 83
Fig–9: The mass attenuation coefficient versus the soil density using Co–60 of Energy 1330 keV.
It is found that the linear attenuation coefficient is in the range of 1.0520 to 1.0813, 1.0645 to
1.1603, 1.0387 to 1.1504 and 1.0336 to 1.1115 cm-1 for 133Ba, 137Cs, 22Na and 60Co respectively with
γ ray energy of 360KeV, 662 KeV, 1280KeV and 1330KeV. Also the mass attenuation coefficient is
found in the range of 0.7687 to 0.9562, 0.7632 to 0.9648, 0.8130 to 0.9336 and 0.7794 to 0.9140
cm2/gm for 133Ba, 137Cs, 22Na and 60Co respectively. The work presented is part of a survey recently
conducted with larger database.
CONCLUSION
The liner and mass attenuation coefficients values for various soil samples collected from
different area of Aurangabad-Maharashtra, India were measured by using gamma-ray spectrometry
NaI(Tl) detector for gamma radiation sources 133Ba,137Cs, 22Na and 60Co with γ ray energy of
360KeV,662 KeV,1280KeV and 1330KeV. The mass attenuation coefficient values are useful for
quantitative evaluation of interaction of gamma radiations with soil samples. It can be concluded
from this work as density increases the mass attenuation coefficient of soil samples decreases
.This gives the validity of exponential absorption law I = I0 e-µxwhere, x is thickness of the soil
sample. This method is useful for the study of properties the soils in agriculture purposes. The linear
and mass attenuation coefficient depends on soil density, sample composition and photon energy E.
y = 1.897e-0.63x
R² = 0.904
0.60 0.65 0.70 0.75 0.80 0.85 0.90 0.95
1 1.1 1.2 1.3 1.4 1.5
M
a
ss
A
tt
e
n
u
a
ti
o
n
C
o
ef
fic
ie
n
t
Abdu Hamoud Al-Khawlany et al., IJSRR 2018, 7(1), 74-84
IJSRR, 7(1) Jan. – March, 2018 Page 84
REFERENCS
1. Kaplan, AddisonWesley, Pub. Co, Cambridge. Massachusetts, Medhat M.E., Applications of
gamma-ray transmission method for study the properties of cultivated soil. Ann. Nuclei.
Energy. February 2012; 40(1):53-59.
2. Ferraz, E.S.B., Mansell, R.S. Determining water content and bulk density of Soil by gamma
ray attenuation methods. IFAS, Florida. November 2010;110(2):197-210.
3. D.V. Raje1, L.M. Chaudhari, ‘Mass Attenuation Coefficients of Soil Samples in Maharashtra
State (India) by Using Gamma Energy at 0.662 MeV’. Bulg. J. Phys. 2010; 37:158–164.
4. Surung Bharat S, Lokhande Rajkumar M, Pawar Pravina P., ‘Linear attenuation coefficient
and mean free path in the energy range of 0.1MeV to 1.5MeV’. International Journal of
Applied Research. ISSN: 2394-5869, 2016; 2(2): 279-283.
5. Chaudhari Laxman M and Raje Dayanand V. ‘Study of photon attenuation coefficient of soil
samples from Maharashtra and Karnataka states (India) at gamma ray energies from 122 keV
to 1330 keV’. Research Journal of Chemical Sciences. Feb. 2012; 2(2): 49-53.
6. Pravina P. Pawar and Chandrakant S. Mahajan. ‘Measurement of mass and linear attenuation
coefficients of gamma - rays of Glycine for 0.360, 0.662, 1.170 and 1.330 MeV photons’.
Science Research Reporter. April 2013; 3(1): 53-56.
7. Jackson D, F and Hawkes D J. ‘X ray attenuation coefficients of elements and mixtures’.
Phys. Rep. April (1981); 70(3): 169-233.
8. Hubbell J. H., ‘Mass attenuation and energy absorption coefficients from 1 keV to 20 MeV’.
Intern. J. Appl. Radiation Isotopes. November 1982; 33(11): 1269-1290.
9. G.A. Carlsson. "Absorbed dose equations. On the derivation of a general absorbed dose
equation and equations valid for different kinds of radiation equilibrium. Radiation research, 1981; 85(2): 219-237.