Usability Studies In Virtual And
Traditional Computer Aided Design
Environments For Navigation
Syed Adeel Ahmed, Xavier University of Louisiana, USAKurt M. Satter, Retired IE professor, Louisiana Tech University, USA
ABSTRACT
A usability study was used to measure user performance and user preferences for a CAVETM
immersive stereoscopic virtual environment with wand interfaces compared directly with a workstation non-stereoscopic traditional CAD interface with keyboard and mouse. In both the CAVETM and the adaptable technology environments, crystal eye glasses are used to produce a stereoscopic view. An ascension flock of birds tracking system is used for tracking the user’s head and wand pointing device positions in 3D space.
It is argued that with these immersive technologies, including the use of gestures and hand movements, a more natural interface in immersive virtual environments is possible. Such an interface allows a more rapid and efficient set of actions to recognize geometry, interaction within a spatial environment, the ability to find errors, and navigate through a virtual environment. The wand interface provides a significantly improved means of interaction. This study quantitatively measures the differences in interaction when compared with traditional human computer interfaces.
This paper provides analysis via usability study methods for navigation termed as Benchmark 1. During testing, testers are given some time to “play around” with the CAVETM environment for familiarity before undertaking a specific exercise. The testers are then instructed regarding tasks to be completed, and are asked to work quickly without sacrificing accuracy. The research team timed each task, and recorded activity on evaluation sheets for Navigation Test. At the completion of the testing scenario involving navigation, the subject/testers were given a survey document and asked to respond by checking boxes to communicate their subjective opinions.
Keywords: Usability Analysis; CAVETM (Cave Automatic Virtual Environments); Human Computer Interface (HCI); Benchmark; Virtual Reality; Virtual Environments; Competitive Comparison
INTRODUCTION
his paper is an extension of the work done by Satter (2005) on Competitive Usability Studies of Virtual Environments for Shipbuilding. The key difference is the use of a new immersive environment called CAVETM. The significance and the detail description of this study is very well explained by Satter (2012) in his recent paper. Here we only present the details of this usability study. The CAVETM was developed at the University of Illinois at Chicago and provides the illusion of immersion by projecting stereo images on the walls and floor of a room-sized cube. Several users wearing lightweight stereo glasses can enter and walk freely inside the CAVETM. A head tracking system continuously adjusts the stereo projection to the current position of the leading viewer. A CAVETM and wand system schematic is shown in Figures 1 & 2.
Figure 1: Schematic of the CAVETM System Figure 2: The Wand Interface
ENVIRONMENTS AND USABILITY STUDY
The Navigation scenario was designed to test the user’s ability to utilize the two environments/interfaces (Non-stereoscopic workstation and Stereoscopic CAVETM) to navigate through the study space locating each of 4 distinct items/parts within the space. The common measure recorded was simply the elapsed time to navigate the space (from a common starting point), locate each required item/part, and return to the starting point. Each of the thirty users performed this Benchmark three times in each of the two environments. The analysis of the final pass results of these Benchmark 1 tests by the users is presented in the following sections. Pass 3 results represent each user’s final exposure to each environment within each scenario. Therefore, pass 3 results tend to show the user’s best ability to perform the required tasks. Each environment/interface (Non-stereoscopic workstation and Stereoscopic CAVETM) is represented in a distinct chart.
PASS-TO-PASS IMPROVEMENTS IN ELAPSED TIMES
Figure 3 shows user elapsed times for pass 3 of the navigation Benchmark tests in the two environments. A preliminary investigation of the chart data shows that the users performed navigation tasks faster using the CAVETM stereoscopic (wand) interface over the non-stereoscopic environment workstation.
Benchmark 1 - Pass 3 Elapsed Times
0 100 200 300 400 500 600 700 800
User # Elapsed
Time (in Sec.)
WkSta 460 260 735 450 347 343 342 316 265 389 346 338 382 389 369 432 443 441 518 398 478 510 409 539 508 456 465 491 456 457 424 Cave 223 164 354 236 166 236 213 251 310 306 236 209 284 153 216 231 182 240 241 202 134 217 197 175 202 248 175 198 214 166 219 U1 U2 U3 U4 U5 U6 U7 U8 U9 U10 U11 U12 U13 U14 U15 U16 U17 U18 U19 U20 U21 U22 U23 U24 U25 U26 U27 U28 U29 U30 Avg
Figure 3: Benchmark 1 – Pass 3 Elapsed Times
BENCHMARK 1-PASS-TO-PASS COMPARISON OF ELAPSED TIMES ANALYSIS
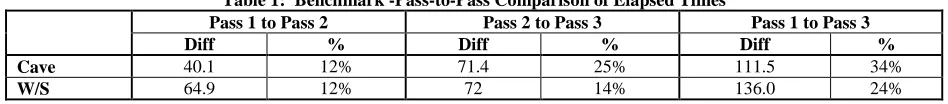
Note that there appears to be 34% improvement in the use of the CAVETM from pass 1 to pass 3 against only 24% improvement in Workstation interface from pass 1 to pass 3. This indicates that stereoscopic environment resulted in sharper decreases in navigation times than for non-stereoscopic environment (improved user performance).
Table 1: Benchmark -Pass-to-Pass Comparison of Elapsed Times
Pass 1 to Pass 2 Pass 2 to Pass 3 Pass 1 to Pass 3 Diff % Diff % Diff % Cave 40.1 12% 71.4 25% 111.5 34%
W/S 64.9 12% 72 14% 136.0 24%
ELAPSED TIMES DETAILED STATISTICAL ANALYSIS
All statistical analyses of the test data were performed using Number Cruncher Statistical Systems (NCSS software, 2004). Considerable assistance in interpreting the results was gained from NCSS. NCSS software provides both descriptive statistics on the data and a T-test that aids in selecting the proper tests based on the distribution of the test data.
The descriptive statistics tests are performed to determine if the sets of environment data are normally distributed (Gaussian distribution). Such testing (Normality Testing) quantifies and reports the discrepancy between the distribution of the data and the ideal Gausian (Normal) distribution. NCSS uses the Kolmogorov-Smirnov test for calculating this value; the KS statistic. A larger KS statistic value denotes a higher discrepancy and is used to compute a traditional statistic P-value. The results presented here are based on the means and standard deviations of each set of Benchmark, environment, and test pass sample results.
The P-value from the normality test answers the question: “In a random sample from a Gaussian distribution, what is the probability (P-value) of obtaining a sample that deviates as much from a Gaussian distribution (or more so) than the given sample. Stated differently, the P-value answers the question: If the population is Gaussian, what is the chance (as measured by probability) that a randomly selected sample of this size would have a KS statistic smaller, giving a higher P> 0.10 value for a normal distribution?”
Since the sample sizes for this study are relatively small (30 users), a large P-value only means that the data is consistent with a Gaussian (normal) population. This does not exclude the possibility of a non-Gaussian population.
There are two hypotheses in this case. The first is the null hypothesis (H0,) that states that there is no difference between the two environments. The second is the alternative hypothesis (Ha) that states that the environment with the smaller (faster) elapsed time is “better”. (In this particular case, the CAVETM environment has a lower mean than workstation; indicating that the user had faster times for the CAVETM interface than for Workstation interface.)
In either parametric (normal distribution) or nonparametric testing, it is sufficient to test the null hypothesis of equal means for normal distribution and the null hypothesis of equal medians for non-normal distribution:
Null Hypothesis: (H0): m1 – m2 = 0.
Should H0 prove true, the means of the navigation times (or any other variable) for the two environments being compared are equal (at the 90% confidence level) and thus there is no statistical difference in the compared environments/interfaces? However, should the test fail, statistical credence can be given to the alternative hypothesis:
Alternative Hypothesis: (Ha): m1 – m2 ≠ 0.
MANN-WHITNEY TEST
The Mann-Whitney Test is used when there is a non-normal distribution and the normality test fails or when the data is non-variant. It uses the median to compare differences between the two groups.
The median is used for non-normal comparisons because the median is unaffected by the non-normal distribution of the data. The mean, since its calculation involves all the data, is skewed by the non-normality of the data. Therefore, the mean is an unreliable measure to use in tests. Hence the median is used instead of the mean (T-test).
PASS 3 STATISTICS
Table 2 presents the descriptive statistics test results (normality testing) of the K.S. test followed by the results of Levene’s test for equal variance of the data. The null hypothesis (H0) and alternative hypothesis (Ha) discussed above applies here.
Table 2: Benchmark 1 – Pass 3 Elapsed Times
For Table 2, the K.S. test is used to test for normality of data. Since the P-value is greater than 0.1, the data are normal. Levene’s test is used to test for equal variance. When the P-value is less than 0.1 the data have unequal variances. In this case, since the data has unequal variance, the Mann-Whitney test is used. With the Mann-Whitney test, the P-value is less than 0.1. This indicates that the medians are unequal for both the CAVETM and Workstation environments. Further examination of these results shows that for the two environments, the differences are statistically significant. The conclusion then is that at the 90% confidence level, there is sufficient evidence to support the alternative hypothesis (Ha). Thus, since the CAVETM interface demonstrates shorter elapsed find/repair times, this environment is statistically “better” than non-stereoscopic Workstation environment (for Benchmark 1 during pass 3 elapsed timings).
Figure 3 provides a summary of Benchmark 1 - Pass 3 elapsed navigation times for all user elapsed timings in the two environments under test. As shown in the chart, the CAVETM environment resulted in somewhat lower navigation times. It should also be noted that as a group, all users performed better using the stereoscopic environments (CAVETM and Wand) over the non-stereoscopic environment (Workstation).
User Subjective Overall Environment Ratings
After completion of each pass of each Benchmark test in each environment, users provided their subjective views of their experience by completing the 22-question Usability Survey, rating the environment on a scale of 1 to 5 (very poor to very good).
A further examination of the results detailed in Figure 4 show that upon completion of the Benchmark tests, users preferred the stereoscopic wand interface over traditional CAD workstation interface.
Benchmark 1 - Pass 3 - Overall Impressions Ratings
0 1 2 3 4 5
User # Rating
WkSta 4.05 4.50 4.20 4.05 4.00 4.25 4.20 4.35 4.35 4.35 4.45 4.20 3.95 4.15 4.15 4.10 4.25 4.15 4.25 4.50 4.25 4.25 4.40 4.10 4.30 4.20 4.35 4.45 4.60 4.75 4.27 Cave 4.05 4.05 4.00 4.00 4.10 4.10 4.10 4.15 4.10 4.85 4.85 4.85 4.85 4.90 4.90 4.55 4.85 4.85 4.90 4.85 4.85 4.75 4.75 4.85 4.15 4.10 4.00 4.15 4.05 4.05 4.45 U1 U2 U3 U4 U5 U6 U7 U8 U9 U10 U11 U12 U13 U14 U15 U16 U17 U18 U19 U20 U21 U22 U23 U24 U25 U26 U27 U28 U29 U30 Avg
Figure 4: Benchmark 1 – Pass 3 Overall Impressions Ratings
Figure 5: Usability Survey Questionnaire (Satter, 2005)
Workstation environments. Further examination of these results shows that for the two environments, the differences are not statistically significant. The conclusion then is that at the 90% confidence level, there is sufficient evidence to support the null hypothesis (H0). This indicates that neither of the two environments is statistically better for Benchmark1 pass3 overall impressions subjective ratings.
Table 3: Benchmark 1 – Pass3 Overall Impressions Ratings
B1OP3 # Users Mean St. Dev. Low High P Value Normal? CV
Cave 30 4.45 0.38 4 4.90 <0.10 No 0.09%
W/S 30 4.27 0.18 3.95 4.75 >0.10 Yes 0.04%
F-Value P Value Value P Value
57.56 <0.001 No -0.91 0.18 Yes N/A
Cave vs W/S
Homogeneity of Variance Test for Differences
Levene's Test Equal
Var?
Mann-WhitneyTest
Equal? Significant?
For Table 3, the K.S. test is used to test for normality of data. Since the P-value is less than 0.1 for CAVETM, the data are not normal. Levene’s test is used to test for equal variance; since the P-value is less than 0.1 the data have unequal variance. In this case, since the data is not normal, the Mann-Whitney test is used. With the Mann-Whitney test, P-value is greater than 0.1, which indicates that the medians are equal for the CAVETM and Workstation environments. Further examination of these results shows that for the two environments, the differences are not statistically significant. The conclusion then is that at the 90% confidence level, there is sufficient evidence to support the null hypothesis (H0). This indicates that neither of the two environments is statistically better for Benchmark1 pass3 overall impressions subjective ratings.
Thus, since the CAVETM interface demonstrates shorter elapsed find/repair times, this environment is statistically “better” than non-stereoscopic workstation environment for Benchmark 1 during pass 3 elapsed timings.
BENCHMARK 1 - PASS TO PASS COMPARISON OF OVERALL IMPRESSIONS RATINGS ANALYSIS
Table 4 shows the pass-to-pass improvements in user overall impression ratings for each of the environments. Note that with each successive exposure (pass-to-pass) the user’s overall impressions of the interfaces improved. Examination of the pass-to-pass analysis of improvements noted in Table 4 shows that for Benchmark 1 overall impressions subjective ratings, the ratings improved for both the CAVETM and Workstation interfaces from pass-to-pass. In comparing the CAVETM and Workstation interfaces, the ratings appear to have improved more for the CAVETM environment with a higher percentage from pass-to-pass than for the workstation.
Table 4: Benchmark 1 - Pass-to-Pass Comparison of Overall Impressions Ratings
Pass 1 to Pass 2 Pass 2 to Pass 3 Pass 1 to Pass 3 Diff % Diff % Diff % Cave -0.65 -19% -0.30 -7% -0.95 -27%
W/S 64.90 12% -0.69 -19% -0.92 -27%
The negative values in Table 4 show that pass 1 ratings were lower than pass 2 and pass 2 ratings were lower than pass 3. This means that user’s preference improved from pass to pass. For example, a value of -27% for the CAVETM (Pass 1 to Pass 3) is calculated as (3.5-4.45)/3.5, where 3.5 and 4.45 represent the means of Benchmark 1 over impressions ratings for pass 1 and pass 3 respectively.
CONCLUSIONS
Examination of the pass-to-pass analysis of improvements noted in Table 4 shows that for Benchmark 1 overall impressions subjective ratings, the ratings improved for both the CAVETM and Workstation interfaces from pass-to-pass. In comparing the CAVETM and Workstation interfaces, the ratings appear to have improved more for the CAVETM environment with a higher percentage from pass-to-pass than for the workstation. Our future work will focus competitive usability on Benchmarks 2 for Error detection/correction under these same environments.
AUTHOR INFORMATION
Syed Adeel Ahmed, Ph.D., Xavier University of Louisiana, 1 Drexel Dr., New Orleans, LA 70125. He is an Assistant Professor of Management at Xavier University of Louisiana and Editor/Reviewer of UJEEE at HRPUB. E-mail: [email protected] or [email protected] (Corresponding author)
Kurt Satter, Ph.D., is a retired IE professor, Louisiana Tech University. E-mail: [email protected]
REFERENCES
1. Number Cruncher Statistical System (NCSS software, 2004).
2. K. M. Satter, "Competitive Usability Studies of Virtual Environments for Shipbuilding." PhD Dissertation, Engineering Management, University of New Orleans, 2005.
3. Syed Adeel Ahmed, “Usability Studies with Virtual and Traditional Computer Aided Design Environments." PhD Dissertation, Engineering Management, University of New Orleans, 2006.