Published online February 20, 2014 (http://www.sciencepublishinggroup.com/j/ijnfs) doi: 10.11648/j.ijnfs.20130206.25
Self-reported weight patterns and perceptions among
female students of Saudi Arabia: A cross sectional survey
Suneetha Epuru
*, Ala’a Eideh, Shahida Banu Shamsuddeen, Sara Faraj Ammash Al Shamarry
College of Applied Medical Sciences, University of Hail, Hail, Saudi Arabia
Email address:
[email protected] (S. Epuru)
To cite this article:
Suneetha Epuru, Ala’a Eideh, Shahida Banu Shamsuddeen, Sara Faraj Ammash Al Shamarry. Self-Reported Weight Patterns and Perceptions among Female Students of Saudi Arabia: A Cross Sectional Survey.International Journal of Nutrition and Food Sciences.
Vol. 2, No. 6, 2013, pp. 360-365. doi: 10.11648/j.ijnfs.20130206.25
Abstract:
Background:Young adults are known across the world for the concern for weight and their perceptions of weight are known to be influenced by factors like media, culture, societal norms, parental and peer group expectations. Objective: This study explores the associations between body mass index (BMI), weight perceptions, and attempts to lose weight in female university students from university of Hail. Methodology: Data were collected from 100 university female students, using self-reported weight, height, self, parent and peer perception of weight, and weight loss strategies. BMI was calculated from weight and height and was categorized into International and Asian clinical criteria. Results: The total mean age ± SD was 21.66 ± 1.39 years (range 19-25) and mean± SD BMI was 22.96 ± 3.74. Nearly 16 % and 4 % of study population were overweight and obese respectively according to BMI International cut off whereas around 34 % and 11 % of study population were overweight and obese respectively according to BMI Asian cut off. Self, parents and peer perceptions are either skewed towards underweight or obese indicating the need for educating the knowledge of actual BMI status in these populations. Currently 22 % agree that they are on dieting while 31 % agree that they do physical exercise as weight management strategy. Cohen’s Kappa suggests a very poor agreement of self-perception with actual weight status. Conclusions: Our study has shown that among female university students, there is significant misperception of weight, with one third of students misclassifying themselves. Weight perceptions were not good indicators for weight management practices.Keywords:
BMI, Weight Perception, Weight Control Behavior, Young Adults1. Introduction
The prevalence of obesity has been increasing progressively in the past two decades across most of the world [1-2]. The clinical categories “overweight” and “obese,” defined by BMI (body mass index) thresholds of over 25 and over 30, respectively, are used universally by health professionals to evaluate risks associated with excess body weight. The public’s weight perceptions are probably less rigidly defined and influenced by perceptions of acceptable weight related to specific cultural and social groups [3-5].
Inaccurate recognition of weight status is a threat to healthy weight control. Historically, the emphasis was the concern was focused primarily on the risks of eating disorders especially in young women’s tendency to identify themselves as overweight despite a healthy body size risking their physical and mental health [6]. However with rising obesity rates attention has now turned to awareness of
weight status among those who are overweight or obese. Studies indicate that many overweight people are unaware that their body weight is too high [7] and many parents fail to recognize that their children are overweight [8].
Regardless of whether a person is underweight, normal or overweight, weight perception is an important determinant of nutritional habits and weight management [9]. Failure to recognize weight correctly may perpetuate a false sense of security around health and contribute to persistence of unhealthy lifestyles. Normal or underweight adolescents, who perceive themselves as overweight, are at risk for eating disorders such as anorexia nervosa [10] whereas conversely, overweight adolescents perceiving otherwise are unlikely to control diet or engage in physical activity [11].
and there is a lack of information from Saudi Arabian population. More widespread studies are needed to properly assess the importance of the patterns and perceptions of weight status.
It is important to study health behavior of young adults because the rapidly changing conditions in the world are bringing about changes in behavior. Young adults are a particularly significant group in relation both to overweight and underweight. In early adulthood, obesity is still comparatively uncommon, so if the problem is addressed early this may help in maintaining their future life into healthy progression.
This study was done to explore the relationships between body weight perceptions, actual body mass index and weight control behaviors among the female students of University of Hail (UOH), Hail Saudi Arabia.
1.2. Specific Objectives
1. To assess the current BMI and body weight perceptions in a sample of subjects from the University of Hail.
2. To study the relationship between weight control behaviors and actual body weight and weight perceptions.
3. To study the association of parental and peer group influence on weight perceptions and weight control behaviors.
2. Methodology
A cross sectional survey was planned and conducted to assess the nutrition behaviour patterns among a random female sample of 100 subjects of University of Hail.
2.1. Design, Sample and Data Collection
The study design was a cross-sectional survey and was conducted at the University of Hail (UOH) during the winter 2012 -13 semester. Approximately, a random sample size of 100 samples was enrolled in the study from different colleges (representing a total population of 21000 with calculated confidence interval of 9.8 and confidence level of 95 %). University of Hail research committee approved the study. No personal identification details were collected protecting privacy and allowing for anonymous and voluntary participation. The inclusion criteria included current registration with University of Hail as students, absence of chronic illness, and knowledge of their height, weight information and acceptance of informed consent form. The exclusion criteria included those with less than 18 years and those who are following any special diets, pregnant and lactating mothers.
2.2. Anthropometry
The subjects were asked to record their self-reported height and weight information on the questionnaire. Those who were not aware of the information were excluded from the participation of the study. Body Mass Index (BMI) was
calculated as the ratio of weight (kilograms) to the square of height (meters). Weight status was classified into four categories: underweight (BMI ≤ 18.5), normal weight (BMI between 18.5 – 24.9), overweight (BMI between 25–29.9), and obese (BMI ≥ 30) and also according to Asian cut off as underweight (BMI ≤ 18.5), normal weight (BMI between 18.5 – 22.9), overweight (BMI between 23–27.49), and obese (BMI ≥ 27.5) [14].
2.3. Assessment Tool
The questionnaire requested information on socio-demographic and anthropometric information which included age, gender, college, self-reported height and weight followed by questions related to study objectives as follows:
Weight Perceptions, Dieting and Exercise Patterns: The participants were asked about self, parents and peer perceptions about their current weight status as well the dieting and exercise behaviors along with their perceptions for various foods influencing their weight status.
Validation of the Questionnaire: For content validity (back to back translation), the questionnaire was initially translated into Arabic and then converted back to English and pre-tested for question accuracy and clarity using a pilot sample of 10 which were not included in the study results.
2.4. Statistical Analysis
The data set was cleaned and edited for inconsistencies. Missing data were not statistically computed. Statistical analyses were performed using the Statistical Package for Social Sciences (version 16.0, SPSS, Inc.) software. Descriptive statistics such as means and standard deviations were calculated for the continuous variables and frequencies for qualitative data. Associations were established using chi-square analysis. Agreement between actual weight status with weight perceptions was checked using Cohen’s Kappa. All reported P values were made on the basis of 2-sided tests and compared to a significance level of 5%; differences were considered statistically significant at P < 0.05 or P<0.01.
3. Results
Table 1.Demographic and anthropometric profile of the study population
Variables Minimum Maximum Mean Standard Deviation
Age (years) 19 25 21.66 1.39
Weight (kg) 40 98 56.89 10.50
Height (cm) 140 185 157.28 5.78
BMI (kg/m2) 15.63 38.76 22.96 3.74
BMI % % % %
International cut off 11 69 16 4
Asian cut off 11 44 34 11
Table 2 presents weight perceptions of self, parents and friends of study subjects. Only 23 % perceive themselves as normal weight and a whopping 34 % perceive themselves as obese as compared to 69 % and 4 % according to BMI International cut off. These figures are certainly even varying as compared to Asian cut off which suggest 44 and 11 % as normal weight and obese respectively. Parents and peer perceptions are also either skewed towards underweight or obese indicating the need for educating the knowledge of actual BMI status in these populations.
Table 2.Weight perceptions of self, parents and friends of study subjects
Variables BMI Percentage
I feel I am Underweight 27.0
Normal Weight 23.0
Over weight 16.0
Obese 34.0
My parents feel I am Underweight 27.0
Normal Weight 23.0
Over weight 16.0
Obese 34.0
My friends feel I am Underweight 27.0
Normal Weight 23.0
Over weight 16.0
Obese 34.0
Table 3 suggests perceptions of the subjects about food groups and health and body image of study subjects. Around 67 and 33 % of study population disagree milk and meats help them make weight gain while 19 % and 63 % agree milk and meat may put them at risk of weight gain there by possible influencing their food choices. Almost all the subjects believe fruits and vegetables are healthy. Diet colas are also not supported as aids for dieting. Around 63 % of study population believe diet colas will not help with weight loss another 16 % are undecided about this factor. Only 76 %
feel that they look beautiful and another 71 % feel they are healthy. Around 22 % are undecided whether they look beautiful in the eyes of society indicating the confusion about body image in changing societies.
Table 3.Perceptions about food groups, health and body image (%)
Variables Agree Disagree Undecided
I think drinking milk will make me
gain weight 19 67 14
I think drinking diet colas help me
lose weight 21 63 16
I think eating meats make me gain
weight 63 33 4
I think eating fruits and vegetables is
healthy 99 1 0
I think I am beautiful 76 2 22
I think I am healthy 71 15 14
Currently 22 % agree that they are on dieting while 31 % agree that they do physical exercise as weight management strategy (Table 4). Around 55 % agree that they are thinking to go on diet, while only 18 % and 22 % agreed that their parents and peers suggest them to go on diet. Only 31 % agreed that they are currently doing physical exercise on regular basis. However 60 % of the study subjects believe there is a need for them to start exercising while 12 % of parents and 26 % friends suggest them the same. Half the study population believes that they need to eat special foods if they have to manage their weight. This table suggests that the perceptions regarding dieting and exercise behaviors may not actually result in practice. Almost 55 and 60 % of the population believe that there is need for dieting and exercise, while those who are actually currently practicing them are only 22 and 31 %.
Table 4.Dieting and physical exercise behaviors of study subjects (%)
Variables Agree Disagree Undecided
I am dieting now 22 46 32
I do physical exercise 31 43 26
Do you think you need to do dieting to manage your weight 55 28 17
Do your parents ask you to do dieting to control your weight 18 61 21
Do your friends ask you to do dieting to control your weight 22 54 24
Do you think you need to do physical activity to control your weight 60 22 18
Do your parents ask you to do physical exercise to control your weight 12 64 24
Do your friends ask you to do physical exercise to control your weight 26 55 19
Do you think you need to eat specific foods to manage your weight? 50 50 -
Figure 1. Actual weight status vs. self perception of weight status (%)
Figure 2. Actual weight status vs. parent’s perception of weight status (%)
Figure 3. Actual weight status vs. peer’s perception of weight status (%)
Table 5 presents actual weight and self-perception vs. dieting as a strategy for weight control in study subjects. The results indicate that self-perceived overweight and obese groups were actually less emphasizing on dieting. Chi-square analysis suggests that there are statistically significant differences between Asian BMI cut off and self-perceived groups who are using dieting for management of weight.
Table 5.Actual weight and self-perception vs. dieting as a strategy for weight control in study subjects (%)
Do you think You need to do dieting to control your weight Chi-Square
(* Sig)
Agree Disagree Undecided
International Underweight 63.6 27.3 9.1
6.329 (p=0.387)
Normal Weight 47.8 33.3 18.8
Over weight 75.0 12.5 12.5
Obese 75.0 .0 25.0
Asian Underweight 63.6 27.3 9.1
12.766 * (p=0.047)
Normal Weight 38.6 43.2 18.2
Over weight 64.7 17.6 17.6
Obese 81.8 .0 18.2
Self-Perception Underweight 48.1 25.9 25.9
17.808 * (p=0.007)
Normal Weight 78.3 17.4 4.3
Over weight 62.5 6.2 31.2
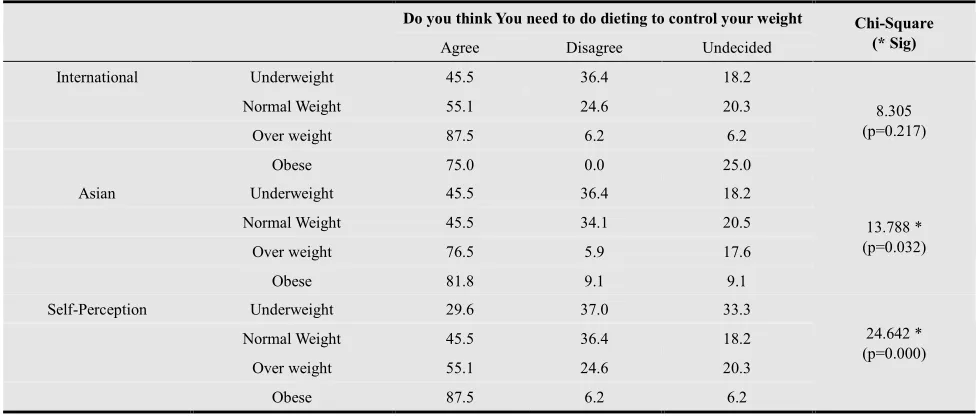
Table 6.Actual weight and self-perception vs. physical exercise as a strategy for weight control in study subjects (%)
Do you think You need to do dieting to control your weight Chi-Square (* Sig)
Agree Disagree Undecided
International Underweight 45.5 36.4 18.2
8.305 (p=0.217)
Normal Weight 55.1 24.6 20.3
Over weight 87.5 6.2 6.2
Obese 75.0 0.0 25.0
Asian Underweight 45.5 36.4 18.2
13.788 * (p=0.032)
Normal Weight 45.5 34.1 20.5
Over weight 76.5 5.9 17.6
Obese 81.8 9.1 9.1
Self-Perception Underweight 29.6 37.0 33.3
24.642 * (p=0.000)
Normal Weight 45.5 36.4 18.2
Over weight 55.1 24.6 20.3
Obese 87.5 6.2 6.2
Table 6 presents actual weight and self-perception vs. physical exercise as a strategy for weight control in study subjects. These results also indicate a similar trend to dieting behavior suggesting that self-perceived overweight and obese groups were actually less emphasizing on exercise as a strategy for weight control as compared to actual overweight and obese people according to international and Asian clinical cut off. Chi-square analysis suggests that there are statistically significant differences between Asian BMI cut off and self-perceived groups who are strategizing exercise for management of weight.
4. Discussion
Weight perception, which refers to the perception of one’s body shape, is an important dimension of body image concern and plays a significant role in related behaviors. The breakup of our sample into weight categories according to the WHO International and Asian criterion showed that the difference between two cutoffs is quite significant for normal and overweight categories. According to international cut off the normal weight category is 69 % and overweight category is 16 % while according to Asian criteria normal weight category is 44 % and overweight category is 34 %. These results suggest that majority subjects in normal category according to International cut off are in the region 23-25 kg/m2 BMI. The proportion of underweight females is 11 % and is similar to western and eastern studies which were done on students [15-17].
Previous research on weight perception has shown that female students do not have a realistic perception of their actual weight [13]. This study also finds similar results with both subjects and their friends finding only around 1/3 agreement with actual clinical criterion. These results are in agreement with other studies [18]. However parent’s misclassification was severe and indicates the high
influence of cultural and societal norms. Approximately half of the normal weight students who perceive themselves as either overweight or underweight may as may attempt to unnecessarily reduce or gain weight to meet their inaccurate normal standards. Also in reality according both International and Asian criterion the obese category doesn’t exceed a maximum of 11 % while the tendency to see themselves as obese is extremely high in the study population since this percentage stands at 34 % again risking the weight control behaviors. Our results suggest that overweight people according to international criterion had the most accurate perception of weight in agreement with other studies [19].
The results also suggest dieting and exercise as weight control strategy is most commonly present at least in 70 % and above in overweight and obese categories according to both International and Asian cut off’s where as it is around 60 % in self-perceived overweight and obese categories suggesting weight perceptions as not a better indicator for weight management behavior. These results are in support with another study done on Asian populations [18] and in contrast with western populations [15] suggesting cultural influences. This indicates a poor prevalence of physical activity among female university students in the city which should be a cause for concern. However, it is important to emphasize realistic weight loss goals and acceptable weight loss practices.
weight perceptions and weight management behaviours. Future similar studies are essential for understanding gender differences for weight perceptions and weight management behaviours.
5. Conclusion
Our study has shown that among female university students there is significant misperception of weight, with one third of students misclassifying themselves. Weight perceptions were not good indicators for weight management practices. Health policy makers should implement these findings in future development of health interventions and prevention of low self-esteem and health risk eating and exercise behaviors among young females due to incorrect perception of weight. If large populations such as university students learned healthy behaviors early in life, this would not only have favorable health outcomes at an individual level, it would also reduce the burden on health services. Large scale longitudinal studies are required in future from Saudi Arabia to understand weight perceptions and their impact on dietary habits, body shape and physical activity
References
[1] James PT, Leach R, Kalamara E and Shayeghi M, “The worldwide obesity epidemic”, Obes Res., Vol 9 (Suppl 4), 2001, pp. 228S–233S.
[2] Finkelstein EA, Ruhm CJ and Kosa KM., “Economic causes and consequences of obesity”, Ann Rev Public Health., Vol 26, pp. 239-57.
[3] Paeratakul S, White MA, Williamson DA, Ryan DH and Bray GA, “Sex, race/ethnicity, socioeconomic status, and BMI in relation to self-perception of overweight”, Obes Res., Vol 10, 2002, pp. 345-50.
[4] Wardle J, Haase AM and Steptoe A, “Body image and weight control in young adults: international comparisons in university students from 22 countries”, Int J Obes (Lond)., Vol 30, 2006, pp. 644-51.
[5] Wardle J, Robb KA, Johnson F, Griffith J, Brunner E, Power C and Tovee M, “Socioeconomic variation in attitudes to eating and weight in female adolescents”, Health Psychol., Vol 23, 2004, pp. 275-82.
[6] Crawford D and Owen N, “The behavioral epidemiology of weight control”, Aust J Public Health., Vol 18, 1994, pp. 143–148.
[7] Wardle J and Johnson F, “Weight and dieting: examining levels of weight concern in British adults”, Int J ObesRelatMetabDisord., Vol 26, 2002, pp. 1144–1149.
[8] Jeffery AN, Voss LD, Metcalf BS, Alba S and Wilkin TJ, “Parents’ awareness of overweight in themselves and their children: cross sectional study within a cohort (Early Bird 21)”, BMJ., Vol Jan 1, 330(7481), 2005; pp. 23-4.
[9] Warraich HJ, Javed F, Faraz-Ul-Haq M, Khawaja FB and Saleem S, “Prevalence of obesity in school-going children of Karachi”, PLoS One., Vol 4(3), 2009, pp. e4816. [10] Currin L, Schmidt U, Treasure J and Jick H, “Time trends in
eating disorder incidence”, Br J Psychiatry., Vol 186, 2005, pp. 132-5.
[11] Strauss RS, “Self-reported weight status and dieting in a cross-sectional sample of young adolescents: national health and nutrition examination survey III”, Arch Pediatr Adolesc Med., Vol 153, 1999, pp. 741-747.
[12] Veggi AB, Lopes CS, Faerstein E and Sichieri R, “Body mass index, body weight perception and common mental disorders among university employees in Rio de Janeiro”, Rev Bras Psiquiatr., Vol 26(4), 2004, pp. 242-247.
[13] Talamayan KS, Springer AE, Kelder SH, Gorospe EC and Joye KA, “Prevalence of overweight misperception and weight control behaviors among normal weight adolescents in the United States”, Scientific World J., Vol 6, 2006, pp. 365-373.
[14] Choo V, “WHO reassesses appropriate body-mass index for Asian populations”, Lancet, Vol 360(9328), 2002, pp. 235. [15] Cilliers J, Senekal M and Kunneke E, “The association
between the body mass index of first-year female university students and their weight-related perceptions and practices, psychological health, physical activity and other physical health indicators”, Public Health Nutr., Vol 9(2), 2006, pp. 234-243.
[16] Singh A, Kiran D, Singh H, Nel B, Singh P and Tewari P, “Prevalence and severity of dysmenorrhea: a problem related to menstruation, among first and second year female medical students”, Indian J Physiol Pharmacol., Vol 52(4), 2008, pp. 389-397.
[17] Tamim H, Tamim R, Almawi W, Rahi A, Shamseddeen W, Ghazi A, Taha A and Musharrafieh U, “Risky weight control among university students”, Int J Eat Disord., Vol 39(1), 2006, pp. 80-83.
[18] Sirang Z, Bashir HH, Jalil B, Khan SH, Hussain SA, Baig A, Taufeeq M, Samad K and Kadir MM, “Weight patterns and perceptions among female university students of Karachi: a cross sectional study”, BMC Public Health., Vol Mar 16;13, 2013, pp. 230. doi: 10.1186/1471-2458-13-230.