University of Pennsylvania
ScholarlyCommons
Publicly Accessible Penn Dissertations
Spring 5-16-2011
Quantitative Mapping of Lung Ventilation Using
Hyperpolarized Gas Magnetic Resonance Imaging
Kiarash EmamiUniversity of Pennsylvania, [email protected]
Follow this and additional works at:http://repository.upenn.edu/edissertations
Part of theBioimaging and Biomedical Optics Commons, and theBiomedical Devices and Instrumentation Commons
This paper is posted at ScholarlyCommons.http://repository.upenn.edu/edissertations/987
For more information, please [email protected].
Recommended Citation
Emami, Kiarash, "Quantitative Mapping of Lung Ventilation Using Hyperpolarized Gas Magnetic Resonance Imaging" (2011).
Publicly Accessible Penn Dissertations. 987.
Quantitative Mapping of Lung Ventilation Using Hyperpolarized Gas
Magnetic Resonance Imaging
Abstract
The main objective of this project was to develop and implement techniques for high-resolution quantitative imaging of ventilation in lungs using hyperpolarized gas magnetic resonance imaging (MRI). Pulmonary ventilation is an important aspect of lung function and is frequently compromised through several different mechanisms and at varying degrees in presence of certain lung conditions, such as chronic obstructive pulmonary diseases. The primary focus of this development is on large mammalian species as a steppingstone towards translation to human subjects. The key deliverables of this project are a device for real-time mixing and delivery of hyperpolarized gases such as3He and129Xe in combination with O2, an MRI acquisition
scheme for practical imaging of ventilation signal build-up in the lungs, and a robust mathematical model for estimation of regional fractional ventilation values at a high resolution.
A theoretical framework for fractional gas replacement in the lungs is presented to describe MRI signal dynamics during continuous breathing of a mixture of hyperpolarized gases in presence of several
depolarization mechanisms. A hybrid ventilation and imaging acquisition scheme is proposed to acquire a series of images during short end-inspiratory breath-holds over several breaths. The sensitivity of the estimation algorithm is assessed with respect to noise, model uncertainty and acquisition parameters, and subsequently an optimal set of acquisition parameters is proposed to minimize the fractional ventilation estimation error. This framework is then augmented by an undersampled parallel MRI scheme to accelerate image acquisition to enable fractional ventilation imaging over the entire lung volume in a single pass. The image undersampling was also leveraged to minimize the coupling associated with signal buildup in the airways and the irreversible effect of RF pulses. The proposed technique was successfully implemented in pigs under mechanical ventilation, and preliminary measurements were performed in an adult human subject under voluntary breathing.
Degree Type Dissertation
Degree Name
Doctor of Philosophy (PhD)
Graduate Group
Electrical & Systems Engineering
First Advisor Rahim R. Rizi
Keywords
Subject Categories
QUANTITATIVE MAPPING OF LUNG VENTILATION USING
HYPERPOLARIZED GAS MAGNETIC RESONANCE IMAGING
KIARASH EMAMI
A Dissertation in
ELECTRICAL AND SYSTEMS ENGINEERING
Presented to the Faculties of the University of Pennsylvania
in Partial Fulfillment of the Requirements for the Degree of Doctor of Philosophy
2011
_________________________________ Dissertation Supervisor
Rahim R. Rizi, Ph.D.
Associate Professor of Radiology
_________________________________ Graduate Group Chairperson
Roch Guerin, Ph.D.
Alfred Fitler Moore Professor of Telecommunication Networks
Dissertation Committee:
Dwight L. Jaggard, Ph.D.
Professor of Electrical and Systems Engineering
Mitchell Schnall, M.D., Ph.D.
Matthew J. Wilson Professor of Radiology & Vice Chair for Research
Saleem A. Kassam, Ph.D.
Solomon and Sylvia Charp Professor of Electrical Engineering
Masaru Ishii, M.D., Ph.D.
Quantitative Mapping of Lung Ventilation Using
Hyperpolarized Gas Magnetic Resonance Imaging
© COPYRIGHT 2011
KIARASH EMAMI
Dedicated to my wife
ACKNOWLEDGEMENT
First and foremost, I would like to acknowledge the supervision and support of
my advisor and mentor, Dr. Rahim Rizi, who through his continued guidance and
encouragement made it possible for me to realize the goals of this research project. He is
a constant source of enthusiasm and ambition and without him sharing his wisdom and
vision in the area of biomedical imaging, this work would not have been materialized.
I would like to express my deepest gratitude to my wife, Sharareh Nejad. Without
her love, support and sacrifice, my endeavors would have been in vain. My gratitude also
goes to my parents for their support and kindness through the years, respecting my
opinion as a mature member of the family – no matter how young and immature I was,
and for providing me with the means to pursue my interests, no matter how unrelated and
diverse they may have been.
I am really grateful to all of my colleagues in Functional and Metabolic Imaging
Group. But most importantly I am in debt to Dr. Stephen Kadlecek for his unmatched
intelligence and willingness to share his knowledge and experience on hyperpolarized gas
physics, and everything else. Assistance and participation of gentlemen Yinan Xu,
Hooman Hamedani, and Yi Xin cannot go unmentioned, as they were essential in
enabling ideas to actions. I would like to also acknowledge the efforts of Ms. Harmony Li
in diligent proofreading of the dissertation manuscript.
I would like to thank my thesis committee for their valued time and feedback,
especially Dr. Masaru Ishii for his engaging and detailed discussions on the subject
Lastly I would like to sincerely acknowledge the support from National Institutes
of Health and their irreplaceable role in the ever-expanding boundaries of biomedical
ABSTRACT
QUANTITATIVE MAPPING OF LUNG VENTILATION USING
HYPERPOLARIZED GAS MAGNETIC RESONANCE IMAGING
Kiarash Emami
Rahim R. Rizi
The main objective of this project was to develop and implement techniques for
high-resolution quantitative imaging of ventilation in lungs using hyperpolarized gas magnetic
resonance imaging (MRI). Pulmonary ventilation is an important aspect of lung function
and is frequently compromised through several different mechanisms and at varying
degrees in presence of certain lung conditions, such as chronic obstructive pulmonary
diseases. The primary focus of this development is on large mammalian species as a
steppingstone towards translation to human subjects. The key deliverables of this project
are a device for real-time mixing and delivery of hyperpolarized gases such as 3He and 129
Xe in combination with O2, an MRI acquisition scheme for practical imaging of ventilation signal build-up in the lungs, and a robust mathematical model for estimation
of regional fractional ventilation values at a high resolution.
A theoretical framework for fractional gas replacement in the lungs is presented to
describe MRI signal dynamics during continuous breathing of a mixture of
ventilation and imaging acquisition scheme is proposed to acquire a series of images
during short end-inspiratory breath-holds over several breaths. The sensitivity of the
estimation algorithm is assessed with respect to noise, model uncertainty and acquisition
parameters, and subsequently an optimal set of acquisition parameters is proposed to
minimize the fractional ventilation estimation error. This framework is then augmented
by an undersampled parallel MRI scheme to accelerate image acquisition to enable
fractional ventilation imaging over the entire lung volume in a single pass. The image
undersampling was also leveraged to minimize the coupling associated with signal
buildup in the airways and the irreversible effect of RF pulses. The proposed technique
was successfully implemented in pigs under mechanical ventilation, and preliminary
TABLE OF CONTENTS
Acknowledgement………. iv
Abstract.………. vi
Table of Contents……… viii
List of Tables……….………. x
List of Figures………. xi
Chapter 1. Introduction……….. 1
1.1.Background and significance……… 1
1.2.Objective and specific aims……….. 4
1.3.Thesis organization……… 6
Chapter 2. Overview of Hyperpolarized Gas Pulmonary MRI……….. 8
2.1. Introduction……… 8
2.2. Obstructive lung diseases……….. 9
2.2.1. Chronic obstructive pulmonary diseases……… 9
2.2.2. Asthma……… 10
2.2.3. Cystic fibrosis………. 11
2.3. Pulmonary function tests……… 12
2.3.1. Static lung volumes and capacities………. 12
2.3.2. Diffusing capacity……… 15
2.3.3. Small airways studies……….. 15
2.4. Lung imaging techniques……… 16
2.4.1. X-ray computed tomography……….. 17
2.4.2. Positron emission tomography……… 19
2.4.3. Conventional MRI……… 21
2.4.4. Hyperpolarized gas MRI………. 23
2.5. Magnetic Resonance Imaging………. 25
2.5.1. Brief history………. 25
2.5.2. Fundamentals of MRI……….. 27
2.5.3. Effect of RF pulses on signal behavior……… 30
2.5.4. Using gradients to produce MR images……… 31
2.5.5. Acquisition methods………. 36
2.6. Hyperpolarized gas MRI………. 39
2.6.1. Hyperpolarization………. 39
2.6.2. T1 Recovery versus T1 decay……….. 41
2.6.3. Limitation on imaging resolution with HP gas MRI……… 42
Chapter 3. Theory of Fractional Ventilation……… 45
3.2. Fractional ventilation model……… 45
3.3. Point object model……… 47
3.4. Signal dynamics of the cascade ventilation sequence……….. 48
3.5. Signal dynamics of the serial ventilation sequence……….. 50
3.6. Evolution of oxygen tension………. 52
3.7. Dead space model………. 52
3.8. Closed form model……… 57
3.9. Radiofrequency pulse decay model……….. 58
3.10. Ventilation time constant model………. 58
Chapter 4. Sensitivity Analysis……….. 61
4.1. Introduction……….. 61
4.2. Sensitivity to model parameters……… 61
4.3. Noise analysis and number of images……….. 66
4.4. Dynamic range of signal buildup………. 68
4.5. Comparison to large species………. 70
4.6. Number of RF pulses……… 76
4.7. Optimality and tradeoffs……… 81
Chapter 5. Implementation in Phantom and Small Animals………. 84
5.1. Introduction……….. 84
5.2. Mechanical ventilation………. 84
5.3. Animal preparation……….. 85
5.4. Imaging techniques……….. 86
5.5. Data analysis……… 88
5.6. Flip angle distribution in bag phantom……… 90
5.7. Ventilation validation in syringe phantom……….. 91
5.8. Reproducibility and volume-dependency in rats……….. 94
5.9. Measurements of ventilation time constant……….. 97
5.10. Technique comparison – pros and cons……….. 99
Chapter 6. Implementation in Large Species and Humans……… 104
6.1. Introduction……….. 104
6.2. Rationale for acceleration………. 104
6.3. Animal preparation and mechanical ventilation ………. 106
6.4. Imaging techniques……….. 107
6.5. Data analysis………. 109
6.6. GRAPPA image reconstruction……… 110
6.7. Measurement of fractional ventilation in pigs……….. 118
6.8. Preliminary implementation in human subjects ……….. 126
Chapter 7. Conclusion and Future Work……… 130
Bibliography……… 133
LIST OF TABLES
Table 4.1. Model parameters for simulation of sensitivity of fractional ventilation
estimation to model uncertainty, noise and number of images in the small animal
model.
Table 4.2. Model parameters for comparing the sensitivity of r estimation accuracy
between small and large species.
Table 4.3. Model parameters for simultaneous sensitivity assessment of r and α
estimation models and α optimization.
Table 6.1. The numerical values of imaging acceleration parameters used for model
simulation, sensitivity and optimization analysis.
Table 6.2. Ventilatory parameters used for imaging fractional ventilation and flip angle
maps in pigs, along with the p-value and correlation coefficients of r and α in the
LIST OF FIGURES
Figure 2.1. Alteration in small airways and alveoli in three primary obstructive
pulmonary diseases.
Figure 2.2. A typical human PFT device.
Figure 2.3. Lung volumes, capacities and flow rates.
Figure 2.4. A typical chest X-ray radiograph.
Figure 2.5. Imaging of specific ventilation with Xe-CT in a sheep lung.
Figure 2.6. Co-registered set of anatomical and metabolic lung images in three primary
planes acquired using a hybrid PET-CT scanner.
Figure 2.7. Maps of ventilation and perfusion acquired with 99mTc DTPA SPECT.
Figure 2.8. Representative 1H MR image of lungs and surrounding tissue.
Figure 2.9. Structural and functional pulmonary parameters accessible by hyperpolarized
gas MRI.
Figure 2.10. Representative 1H and 3He MR images from a healthy volunteer and a COPD patient exhibiting areas of ventilation defect.
Figure 2.11. General timing diagram for a gradient echo MR imaging pulse sequence.
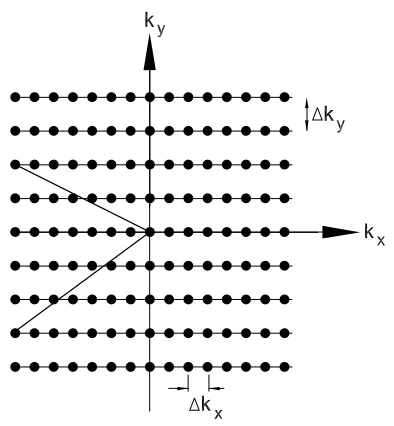
Figure 2.12. Cartesian sampling of k-space using Gx and Gy gradients.
Figure 2.13. Schematic comparison of the thermal polarization versus hyperpolarized
spins states.
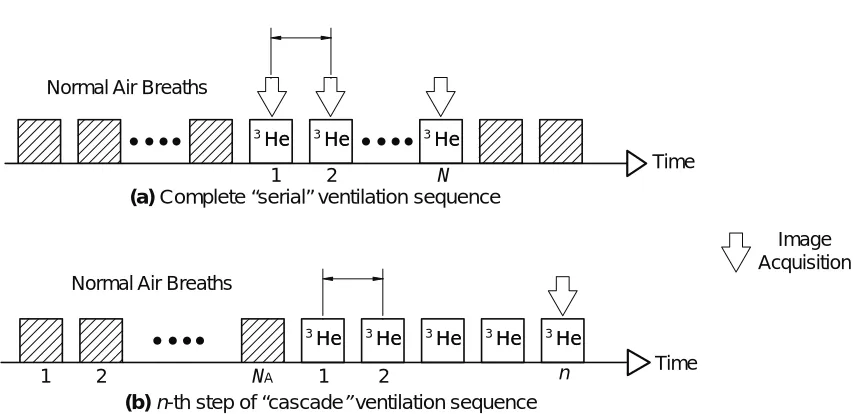
Figure 3.1. Schematic diagram of the serial and cascade fractional ventilation imaging
Figure 3.2. Model of fractional replacement of inspiratory with residual gas in the
airways.
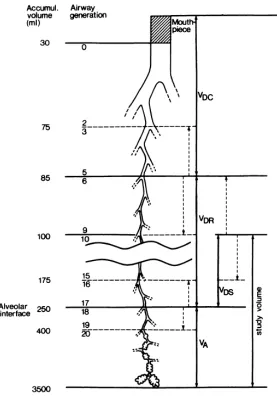
Figure 3.3. Partitioning of the lung in common dead space (VDC), regional dead space (VDR) and alveolar gas volume (VA).
Figure 3.4.(a) Schematic diagram of the MR-compatible ventilator system depicting the
static and dynamic dead space volumes; along with the three-compartment
lumped dead space model.
Figure 3.5. Timing diagram for a representative breath cycle with four time intervals.
Figure 4.1. Simulation results for magnetization and signal buildup dynamics in the
serial ventilation sequence.
Figure 4.2. Sensitivity of the serial ventilation sequence in predicting airway fractional
ventilation value (rA) to model parameters.
Figure 4.3. Sensitivity of the serial ventilation sequence in predicting airway fractional
ventilation value (rA) to SNR and number of images.
Figure 4.4. Flip angle value for serial ventilation imaging sequence to maximize the
signal dynamic range.
Figure 4.5. Simulated signal buildup for a representative voxel with nominal r = 0.2 and
α = 3°.
Figure 4.6. Systematic error in r estimation as a function of oxygen concentration.
Figure 4.7. Relative error in r estimation as a function of SNR in the second image of the
ventilation sequence, assuming a perfect knowledge of α.
Figure 4.8. Relative error in α estimation as a function number of flip angle images
Figure 4.9. Relative error in r and α estimation as a function of number of RF pulses,
NPE.
Figure 4.10. Rate of change of r and α estimation error as a function of NPE over a range of flip angle values.
Figure 4.11. Relative error in r and α estimation as a function of the applied α value for
a range of RF pulses in a point object.
Figure 4.12. The optimal flip angle for r estimation for a representative case as a
function of NPE.
Figure 5.1. α estimation accuracy in a bag phantom using the fully sampled and
undersampled acquisition schemes, as function of number of images, n.
Figure 5.2. Coefficient of variation of α distribution in the imaged phantom using both
fully sampled and undersampled acquisition schemes.
Figure 5.3. The artificial lung: spring-loaded glass syringe.
Figure 5.4. Representative serial fractional ventilation signal build-up images from the
spring-loaded glass syringe.
Figure 5.5. Signal buildup curves for the spring-syringe phantom for three different tidal
volumes, along with the respective predicted fractional ventilation values.
Figure 5.6. Representative serial fractional ventilation images from a healthy rat lung
corresponding to 1 through 8 breaths of HP gas.
Figure 5.7. Regional reproducibility of measurements of fractional ventilation in a
healthy rat lung.
Figure 5.8. Volume-dependency of regional fractional ventilation in a healthy rat lung,
Figure 5.9. Maps of fractional ventilation in a rat lung acquired with varying
pre-acquisition time delays.
Figure 5.10. Measurements of regional fractional ventilation time constant in rat #1.
Figure 5.11. Measurements of regional fractional ventilation time constant in rat #2.
Figure 6.1 Multi-slice fractional ventilation imaging sequence.
Figure 6.2. k-space trajectories and the interpolation net for GRAPPA in a 2-fold
accelerated parallel imaging in 2D Cartesian MR imaging.
Figure 6.3. Coil sensitivity profiles of the four phased array channels used for simulating
accelerated fractional ventilation imaging in a synthetic pig lung.
Figure 6.4. Fully sampled versus undersampled k-space scan using GRAPPA scheme.
Figure 6.5. Individual images from each of the four channels used to create the signal
evolution in the synthetic pig lung.
Figure 6.6. Combined images of signal intensity evolution in the synthetic pig lung over
the course of the simulated fractional ventilation imaging experiments.
Figure 6.7. Accuracy of r estimation in the 2D synthetic images of pig lungs
reconstructed with GRAPPA acceleration scheme
Figure 6.8. Multiplicity of number of RF pulses, NPE, over a range of GRAPPA acceleration parameters.
Figure 6.9. Variation of RMS error and correlation coefficient between the calculated
and a priori r maps as a function of effective acceleration ratio.
Figure 6.10. Comparison of internal flip angle measurements performed at the tail end of
the serial ventilation sequence using the standard and accelerated acquisition
Figure 6.11. Middle slice fractional ventilation maps measured in lungs of five healthy
Yorkshire pigs.
Figure 6.12. Fractional ventilation maps of the ventral slice in lungs of five healthy
Yorkshire pigs.
Figure 6.13. Fractional ventilation maps of the dorsal slice in lungs of five healthy
Yorkshire pigs.
Figure 6.14. HP 3He spin density images corresponding to the six coronal slices from the last breath of the serial fractional ventilation imaging sequence acquired in a
healthy human subject.
Figure 6.15. Coronal fractional ventilation maps in a healthy human subject acquired
with the serial fractional ventilation imaging sequence, overlaid on the
corresponding 1H images of the thorax.
Figure A.1. Schematic diagram of the programmable gas mixing and delivery device,
mechanical ventilator, used for HP gas MRI of intubated animals.
Figure A.2. Ventilator pneumatic valve setup for rats mounted in the proximity of the
imaging RF coil inside the bore of the MRI scanner.
Figure A.3. Ventilator pneumatic valve setup for pigs mounted on a board placed in the
proximity of the imaging RF coil inside the bore of the MRI scanner.
Figure A.4. Hyperpolarized gas chamber placed on the RF coil platform near the
respiratory valves for the rat imaging setup. The entire assembly slides inside the
magnet bore.
Figure A.5. Hyperpolarized gas chambers scaled up by a two orders of magnitude to
Figure A.6. Control unit, computer interface and other non-MRI-compatible components
of the ventilator system placed away from the strong magnetic field, adjacent to
the MRI operating console.
Figure A.7. Schematic diagram of the MRI-compatible passive gas mixing and delivery
device for ventilation imaging in human subjects under voluntary breathing.
Figure A.8. Representative read-out of real-time inspiratory flow rate and volume
acquired with the MRI-compatible pneumotachometer.
Figure A.9. Prototype MRI-compatible passive gas mixing and delivery device for
CHAPTER 1: Introduction
1.1. Background and significance
As the core component of the respiratory system in vertebrate animals and humans, the
lungs deliver oxygen to depleted venous blood and remove excess carbon dioxide from
this blood pool such that a reasonably stable oxygen level is maintained in key organs
and extremities. The O2–CO2 gas exchange takes place across the alveolar membrane between the gas and blood phases. Efficient delivery of O2 and removal of CO2 to and from alveolar airspace, a process known as pulmonary ventilation, however is an
essential prerequisite to successful gas exchange.
Many obstructive lung diseases, including emphysema, asthma, and cystic fibrosis,
impair gas replacement in the lung parenchyma. Asthma, for instance, is characterized by
narrowed airways, emphysema causes tissue destruction and an elevated elasticity
accompanied by air trapping, whereas fibrosis leads to a hardened, less compliant lung
tissue. Even though the mechanism of each disease and the effect on lung tissue are
different, they all manifest themselves in compromised gas replacement efficiency and,
subsequently, impaired pulmonary ventilation. Additionally, most disease-induced
changes in lungs are typically heterogeneous, resulting in non-uniform changes in lung
in the lungs therefore necessitate a non-invasive and quantitative technique sensitive to
these localized changes.
Traditional pulmonary function tests (PFT), such as forced expiratory volume in one
second (FEV1), are currently the gold standard for non-invasive assessment of human pulmonary system that provide an inexpensive but insensitive global measure of lung
function. The most common clinical ventilation imaging technique available today is
radionuclide scintigraphy. Although noninvasive and widely available, these techniques
suffer from poor spatial resolution and exposure to radioactive materials. X-ray
radiography techniques, most notably high resolution computed tomography (CT), are
fundamentally structural imaging modalities capable of providing high fidelity images of
lung tissue density. Radio-dense tracer gases (e.g. xenon) have been used for
measurement of lung ventilation with CT. This technique, however, requires repeated
measurements to yield a plausible signal-to-noise ratio (SNR), resulting in repeated
exposure to ionizing radiation.
Hyperpolarized gas magnetic resonance imaging (HP gas MRI), and specifically HP 3He MRI, is an attractive imaging modality for regional assessment of lung function with
promising temporal and spatial resolution and an attractive safety profile. This imaging
method has opened the possibility for noninvasive visualization of gas atoms in ventilated
lung airspaces and has recently been used for investigational assessment of asthma,
emphysema, and cystic fibrosis. Despite the significance of quantitative imaging of
areas of HP gas MRI methodology. This is partly due to the complex gas transport
mechanisms in the lungs, and the associated challenges with quantitative interpretation of
images of respiratory gas flow through airways. The lung is a deformable object with a
complex geometry and a moving boundary in all three dimensions, which makes
localized tracking of its regions a difficult task. Additionally the polarization of HP gas
decays quickly and irreversibly upon entering the lungs, with a typical in vivo decay time
constant on the order of 10–20 seconds. This decay is driven by several factors including,
primarily, the regional interaction with O2 molecules as well as the applied radio frequency (RF) pulses, intermolecular collisions, wall relaxation and diffusion effects.
Quantitative interpretation of signal dynamics therefore can be irrecoverably affected by
the time history of coupled decay mechanisms.
So far, single-breath HP gas static spin density images have been commonly used for
qualitative evaluation of gross ventilation defects. More recently dynamic imaging
techniques have been developed for and implemented in fast imaging of respiratory gas
flow and air trapping in affected patients. True quantitative imaging of pulmonary
ventilation, however, still remains an unaddressed area in pulmonary imaging. A robust
and objective measure of respiratory gas replacement and distribution is an essential step
towards enabling this technology to become a reliable diagnostic and monitoring tool
across the affected and at risk individuals. The only successful attempt in quantitative
imaging of lung ventilation was reported by Deninger et al., albeit with restrictions that
1.2. Objective and specific aims
The primary goal of this thesis research project is to develop and implement techniques
for high resolution and reliable imaging of fractional ventilation in lungs of large species
using HP gas MRI as a steppingstone for translation to human use. The key deliverables
of this project are: 1) a device for real-time mixing and delivery of hyperpolarized gas
and oxygen to large species including human subjects, 2) an MRI acquisition scheme for
reliable acquisition of ventilation signal build-up in the lungs, and 3) a mathematical
model for robust estimation of fractional ventilation on a regional basis. These goals were
pursued through systemically conducting the following aims:
Aim 1. To develop the ventilation imaging technique and signal dynamics model
1.1. Develop a refined fractional ventilation imaging technique to address
shortcomings of prior methods with utility in humans;
1.2. Develop a multi-compartment mathematical model of gas replacement in
lungs governing the fractional ventilation, dead spaces, and HP gas signal
dynamics in presence of RF-induced and O2-inducded decay mechanisms;
1.3. Perform regional measurements of gas arrival time constant by incorporating
the gas mixing transitions in the signal dynamics model;
1.4. Analyze the sensitivity of fractional ventilation estimation model to noise in
images, image acquisition parameters, uncertainty in model parameters and gas
1.5. Optimize the fractional ventilation imaging and estimation technique for
efficient use of the finite HP 3He signal and image acquisition time.
Aim 2. To implement and validate the ventilation imaging technique in small
animals and phantoms
2.1. Design and prototype a programmable HP gas delivery and mixing system for
synchronized MRI of animal lungs;
2.2. Validate the fractional ventilation imaging and estimation technique in a
simple lung phantom;
2.3. Assess the in vivo repeatability and measurement uncertainty of fractional
ventilation in small animals.
Aim 3. To implement and optimize the whole lung ventilation imaging technique in
large animals and humans
3.1. Implement the fractional ventilation imaging technique in large animals
synchronized with the programmable HP gas delivery and mixing device;
3.2. Utilize and optimize an accelerated imaging scheme for whole-lung imaging
of fractional ventilation in one pass;
3.3. Design and prototype a passive human gas mixing and delivery device with
real-time flow measurement capability;
3.4. Implement the whole lung fractional ventilation imaging and estimation
1.3. Thesis organization
The remainder of this dissertation is organized as follows:
Chapter 2 provides a brief overview of obstructive lung diseases that compromise
pulmonary ventilation and current clinical and imaging techniques available for diagnosis
and assessment of lung ventilation. It then provides an overview of the essential
components of 2D Cartesian magnetic resonance imaging and closes with a brief
description of optical pumping hyperpolarization of noble gases for pulmonary MRI
applications.
Chapter 3 provides the theoretical foundations for fractional gas replacement in the lungs
along with the magnetization buildup in the airways when breathing HP gases. MR signal
buildup dynamics in the airways are derived for the proposed serial ventilation sequence
using a point object model, in comparison to the cascade ventilation sequence developed
earlier, and in presence of RF- and oxygen-induced depolarization mechanisms. It then
moves on to introducing a three-compartment dead space model in signal buildup
equations in order to improve ventilation estimation accuracy. The chapter closes by
incorporating a respiratory gas arrival and mixing time constant to elucidate fractional
ventilation dynamics during the course of a breath.
Chapter 4 deals with the sensitivity analysis of the ventilation estimation model with
and RF pulses per measurement. This information is then utilized to specify the optimal
acquisition parameters in order to maximize the dynamic response and to minimize the
measurement uncertainty.
Chapter 5 presents the experimental methodologies and results of technique
implementation and assessment in phantoms and small animals (i.e. rats) using an
automated gas mixing and delivery device. The serial ventilation imaging technique is
then validated in a simple artificial lung model. Reproducibility and tidal volume
dependency of ventilation measurements, as well as the estimates of regional ventilation
time constant, are demonstrated in rats. The chapter then closes by comparing the results
acquired by the two ventilation imaging techniques in rats and their properties.
Chapter 6 describes the methodology and results for implementation of serial ventilation
imaging technique in large animals (i.e. pigs). After describing the challenges associated
with migrating the serial ventilation imaging technique to large species, it presents the
theory and practice of accelerated image acquisition using parallel MRI, and the benefits
it presents for enabling ventilation measurements over the entire lungs of large species
including humans. Optimality conditions for accelerated ventilation imaging are
discussed and finally preliminary results in performing ventilation measurements in
Finally, Chapter 7 summarizes key results of this project, outlines the challenges that lie
ahead towards standardized measurement in human subjects, and a number of ideas to
pursue immediately towards achieving this goal.
CHAPTER 2: Overview of Hyperpolarized Gas Pulmonary MRI
2.1. Introduction
Lung ventilation is the rate at which gas enters or leaves the lungs. More specifically,
alveolar ventilation is the volume of gas per unit time that reaches the alveoli (air sacs) –
the respiratory portions of the lungs where gas exchange occurs. The function of
ventilation is to transport the air between the lungs and the atmosphere so that oxygen
can be exchanged for carbon dioxide in the alveoli.
Obstructive lung diseases such as emphysema, asthma, and cystic fibrosis adversely
affect gas flow in the lungs, and therefore compromise regional lung ventilation at
different levels and times. High-resolution, localized and quantitative imaging of lung
ventilation can therefore serve as a valuable tool for diagnosis and management of lung
diseases in many different ways. Obtaining regional measurements of lung ventilation
defects is a more effective method for evaluating the location and extent of diseases and
their distribution in the lungs. Further, it can assist physicians in providing more targeted
and personalized therapeutic treatments.
Non-invasive and high-resolution measurements of ventilation can be more sensitive to
smaller and localized changes in lung ventilation (compared to other diagnosis methods
early disease formation. Early detection of lung diseases can in turn trigger a more timely
intervention and improve the chances of patient recovery as well as reduce the cost and
duration of therapy. On an individual and social scale, this technique could enhance the
quality of life and reduce disability-associated overhead imposed upon the general public.
Moreover, non-invasive and safe imaging-based methods for evaluating lung function
have the potential to become routine screening tools that can identify populations at risk
of developing lung diseases.
Finally, a non-invasive and sensitive tool for regional assessment of lung ventilation
allows for longitudinal monitoring of disease progression and response to therapy in
affected populations. Essentially, it can serve as a valuable tool for developing and
evaluating the efficacy of new therapies. Quantitative assessment of diseases, especially
through non-invasive imaging methods, also aligns with the overall goal of modern
medical diagnosis, which is moving towards a more objective and personalized
assessment and treatment of diseases.
2.2. Obstructive lung diseases
2.2.1. Chronic obstructive pulmonary disease
Chronic obstructive pulmonary disease (COPD) is a group of progressive diseases of the
lung, including chronic bronchitis and emphysema, characterized by airway obstruction
and inflammation. Despite being largely preventable, COPD is a major cause of
disability. It is the fourth leading cause of death in the United States and is now the most
diagnosed with COPD. Chronic bronchitis is a condition in which repeated irritation of
the airways leads to chronic inflammation and excess mucous production. While
bronchitis affects the airways, emphysema is a condition characterized by destruction of
the alveolar walls, as shown in Figure 2.1(a). It eventually results in difficulty breathing
as surface area for gas exchange decreases and lung elasticity lessens. COPD affects
millions of people worldwide and is prevalent among smokers and persons chronically
exposed to high levels of dust and toxic chemicals (among other environmental factors).
(a) (b) (c)
Figure 2.1. Alteration in small airways and alveoli in three primary obstructive pulmonary diseases (courtesy of National Institutes of Health)
2.2.2. Asthma
Asthma is a condition characterized by episodic constriction and inflammation of the
airways, as shown in Figure 2.1(b), resulting in reduced lung function, coughing,
wheezing and shortness of breath. The disease is estimated to affect 300 million people
asthma symptoms is caused by a variety of stimuli including exercise, allergens, or viral
infection. Furthermore, asthma is now believed to have a non-reversible degenerative
component caused by airway remodeling.
2.2.3. Cystic fibrosis
Cystic fibrosis (CF) is a congenital disease of the exocrine system affecting about 40,000
people in the US. The disease causes a defect in a protein responsible for chloride
removal in mucous secretions of the exocrine glands. As a result, the mucous is more
viscous than normal and thus is not readily cleared from lung airways by ciliary action, as
shown in Figure 2.1(c). This thick mucous can lead to problems such as increased
infection, particularly in the lungs, and impairment of digestion. Although the mucous
can build up and impair respiratory function, in fact, chronic infection and associated
chronic bronchitis is thought to be the most damaging component of the disease.
2.3. Pulmonary function testing
Currently the most common method of measuring lung function is spirometry, a
technique in which the subject breaths through a tube attached to a pneumotachometer, a
device capable of measuring airflow (Figure 2.2). A complete pulmonary function test
(PFT) usually involves the use of spirometry before and after the administration of a
bronchodilator, measurements of lung volumes, and measurement of diffusion capacity.
Two spirometric measurements commonly used to evaluate lung function are the forced
air the patient can forcibly exhale in one second. Often, the ratio FEV1/FVC is used as an indicator of total lung function. While these measurements have been correlated with
disease, they can only provide information about the lung as a whole, and not its specific
regions. Nevertheless, due to their common utility and significant role in today’s clinical
practice, key PFT parameters and maneuvers are reviewed in this section.
Figure 2.2. A generic human PFT device.
2.3.1. Static lung volumes and capacities
Static lung volumes reflect the elastic properties of the lungs and the chest wall. Figure
2.3 shows an overview of all the key lung volume quantities. Vital capacity (VC) is the
maximum volume of air that can be expired slowly after a full inspiratory effort. Simple
to evaluate, it is one of the most valuable measurements of pulmonary function. Since VC
decreases as a restrictive lung disorder (e.g., pulmonary edema, interstitial fibrosis)
progresses, the course of such a disorder and its response to therapy can be monitored by
Forced vital capacity (FVC), similar to VC, is the volume of air expired with maximal
force. It is usually measured along with expiratory flow rates using simple spirometry
(see below, Dynamic Lung Volumes and Flow Rates). The VC can be considerably
greater than the FVC in patients with airway obstruction. During the FVC maneuver,
terminal airways affected by the disease close prematurely (i.e., before the true residual
volume is reached), trapping gas, and hence affecting the measurement by spirometer.
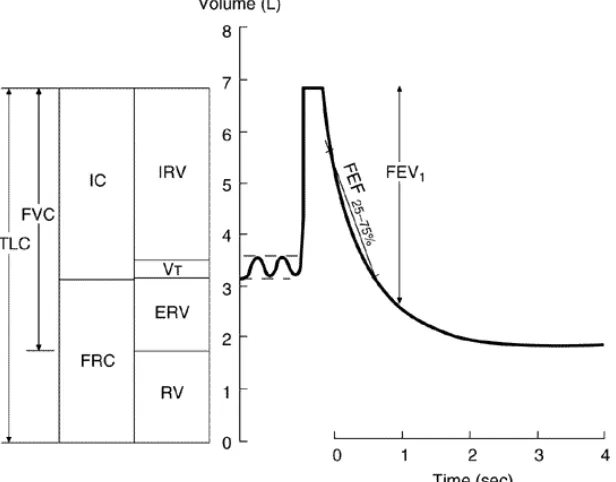
Figure 2.3. Lung volumes, capacities and flow rates.
Total lung capacity (TLC) is the total volume of air within the chest after a maximum
inspiration. Functional residual capacity (FRC) is the volume of air in the lungs at the end
of a normal expiration when all respiratory muscles are relaxed. Physiologically, FRC is
the most important lung volume because it corresponds to the exhalation volume for
normal tidal breathing range. Outward elastic recoil forces of the chest wall tend to
increase lung volume but are balanced by the inward elastic recoil of the lungs, which
Loss of lung elastic recoil in emphysema increases FRC. On the other hand, the increased
lung stiffness in pulmonary edema, interstitial fibrosis, and other restrictive disorders
decreases FRC. The inspiratory capacity (IC) is the difference between TLC and FRC.
The FRC has two components: residual volume (RV), the volume of air remaining in the
lungs at the end of a maximal expiration, and expiratory reserve volume (ERV); ERV=
FRC − RV. The RV normally accounts for about 25% of TLC. Changes in RV are
correlated to those in FRC with several exceptions. First, in restrictive lung and chest
wall disorders, RV decreases less than FRC and TLC. Second, in small airways disease,
premature closure during expiration leads to air trapping, so that the RV is elevated while
the FRC remains close to normal. Third, in COPD and asthma, RV increases more than
TLC, resulting in some decrease in VC.
Dynamic Lung Volumes and Flow Rates reflect the caliber and integrity of the airways.
Spirometry records lung volume versus time during an FVC maneuver. Forced expiratory
volume in 1 sec (FEV1) is the volume of air forcefully expired during the first second after a full breath and normally accounts for more than 75% of the FVC. This value is
2.3.2. Diffusing capacity
The diffusing capacity for carbon monoxide (DLCO) can be determined from a single breath. The patient inspires a known small amount of carbon monoxide (CO), holds his
breath for 10 sec, and then exhales. A sample of alveolar (end-expiratory) gas is analyzed
for CO, and the amount absorbed during that breath is then calculated and recorded in
mL/min/mm Hg.
A low DLCO more likely reflects abnormal ventilation-to-perfusion ratios ( ) in
diseased lungs rather than physical thickening of the alveolar-capillary membrane.
However, this test relies on the availability of hemoglobin (Hb) for CO and thus is
affected by the volume of blood and the quantity of de-saturated Hb in the lungs at the
time of testing. The DLCO is low in processes that destroy alveolar-capillary membranes (e.g., emphysema and interstitial inflammatory or fibrotic processes) and in severe
anemia, in which less Hb is available to bind the inhaled CO. The DLCO is artificially low if the patient's Hb is already occupied by CO (e.g., if the subject smokes within several
minutes of the test).
2.3.3. Small airways studies
In a normal lung, bronchi less than 2 mm in diameter constitute about 10% of the total
airway resistance, but their total surface area is large. Diseases affecting primarily the
small (peripheral) airways can be extensive, and yet not reflect on airway resistance or
airways is reflected by the FEF25-75% and by expiratory flow rates in the last 25–50% of the FVC.
Figure 2.4. A typical chest X-ray radiograph (courtesy of Imperial College, London UK).
2.4. Lung imaging techniques
Lung assessment has been historically performed using chest X-ray radiography since the
mid-20th century, which apart from only providing a purely anatomical and gross view of the lungs, is notoriously insensitive to small and localized changes in lungs induced by
pulmonary diseases (Figure 2.4). The oldest technique for direct imaging of lung
ventilation is based on radionuclide scintigraphy and radioactive elements such as 133Xe, 13
N2, 15O2 and more commonly 99mTc-DTPA. Although noninvasive and widely available, these techniques suffer from poor spatial resolution and expose the subject to
radioactive materials. Despite developments in detector technology, such imaging is
rarely performed today. Chest X-ray imaging remains by far the most cost-effective
non-invasive way to image the lungs, and is the most popular method in clinical practice.
Although many pathological processes in X-ray radiographs can be detected by trained
respiratory gas. More recently, PET, CT, and MRI have been used in clinical research for
non-invasive quantitative imaging of the lungs. As discussed below, these methods have
different strengths and weaknesses and yield complementary information on pulmonary
function and anatomy.
2.4.1. X-ray computed tomography
X-ray Computer Tomography (CT) was demonstrated clinically in 1973 and rapidly
adopted into clinical use by 1980. The technology combined the knowledge of X-ray
penetration and interaction with living tissue and multi-projection image reconstruction
techniques to produce true two-dimensional anatomical images, rather than simple
projection radiographs. Modern instruments utilize the same core principles, but greater
detector sensitivity and computing power have led to faster imaging at a fraction of the
radiation dosage. Single-slice acquisition is restricted to the axial plane, but multi-slice
and spiral CT techniques have extended the imaging plane along the orthogonal axis so
that sagittal, coronal, and oblique slices can be captured.
CT has two major advantages over other 3D imaging tools: speed and resolution. Current
systems employ multiple-detector arrays that offer as many as 64 slices per projection
rotation, which can be completed in less than one second. Clinical systems now offer
sub-millimeter resolution, making CT by far the best tool for most anatomical imaging
applications. The use of high-resolution CT (HRCT) has proven especially effective in
diagnosing diffuse lung diseases, bronchiectasis, and small airway diseases such as
Figure 2.5. Regional Xe-CT analysis (ROI size, 8 × 8 pixels) for a slice of sheep lungs at the level of the carina, showing (left) original gray-scale image and color maps of (middle) regional air content (% air) and (right) specific ventilation (sec–1) [1].
CT has been used to quantitatively measure changes in lung tissue density, but it has
largely been used in anatomical imaging. Perfusion studies have been performed with
radio-opaque contrast agents, but limited only to studies of embolism or lung nodules.
Pulmonary ventilation has been measured from CT images using certain contrast agents,
most commonly the radiodense tracer gas xenon. CT techniques provide high spatial
resolution and a high degree of anatomic localization of the change of regional lung gas
replacement during the wash-in and subsequent wash-out of xenon gas, as shown in
Figure 2.5. However, this technique requires repeated measurements, and therefore
repeated exposure to ionizing radiation. Additionally, xenon has anesthetic and sedative
properties, which limit the concentration, the achievable contrast enhancement, and
consequently, the signal-to-noise ratio (SNR). Use of this technology in humans has
therefore been limited due to safety issues caused by the ionizing radiation. As a result,
these tests cannot be repeated frequently enough for both disease management and the
Figure 2.6. Co-registered set of anatomical and metabolic lung images in three primary planes acquired using a hybrid PET-CT scanner. The bright spot in the PET image (bottom row) correspond to a cancerous tumor with high metabolic activity (courtesy of Cedars-Sinai Medical Center, Los Angeles, CA).
2.4.2. Radionuclide imaging
Positron emission tomography (PET) was developed in 1972 and first used clinically in
1975. While CT uses an external X-ray source as the probe, PET utilizes
positron-emitting radiotracers that can be incorporated into metabolically-active agents. Positron
annihilation produces pairs of photons that are emitted in opposite directions; detectors
isolate only these photon pairs, allowing truly quantitative localization of the radiation
sources, although resolution is limited to the centimeter scale. Modern PET systems now
have integrated CT units so that quantitative data from the former can be co-registered
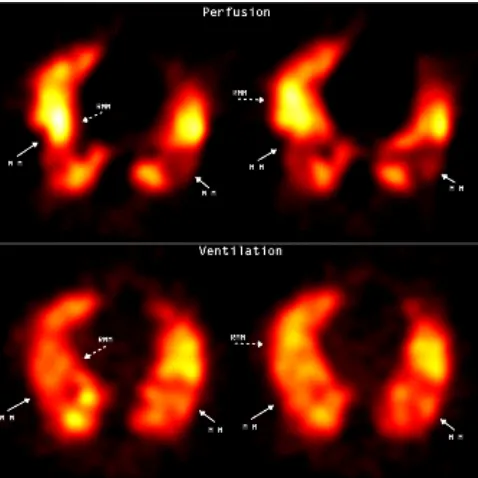
Figure 2.7. Maps of perfusion and ventilation acquired with SPECT showing embolic disease from extensive associated pulmonary disease. "MM" indicates mismatching defects, and "RMM" indicates reverse mismatching defects. Ventilation images are acquired 1.5 hours after perfusion images using 99mTc DTPA aerosol. Areas of absent perfusion in both lower lobes are well ventilated, constituting mismatching defects. Areas of reverse indicate venous admixture (courtesy of Saint Agnes Medical Center, Fresno, CA and University of California, San Francisco, CA).
Single-photon emission computed tomography (SPECT), on the other hand uses gamma
rays to directly detect gamma-emitting radioisotope contrast agents, administered through
injection into blood stream or inhaled in aerosolized form. Both PET and SPECT have
the ability to obtain quantitative pulmonary perfusion and ventilation images using a wide
array of radioisotope tracers. Figure 2.7 shows an example of ventilation and perfusion
maps obtained after administration of Technetium-99m diethylenetriamine penta-acetate
(99mTc-DTPA) depicting ventilation-perfusion mismatch in lung with pulmonary embolism. Quantitative maps from PET and SPECT have been shown to
accurately predict global gas measurements acquired using the multiple inert gas
elimination technique (MIGET), the gold standard for measuring pulmonary
data, thereby certifying PET as the current gold standard in regional in vivo
mapping of the lung.
Figure 2.8. A representative 1H MR image of lungs and surrounding tissue (courtesy of National Aeronautics and Space Administration)
2.4.3. Conventional MRI
Water proton magnetic resonance imaging (1H MRI) has provided the medical and scientific community with a powerful technique to non-invasively visualize and contrast
soft tissue structures in vivo. Although the first MR image was demonstrated in 1973, the
principles of magnetic resonance were demonstrated experimentally by Bloch and Purcell
in 1946 [20,21]. This early technique was rapidly adopted by chemists and named nuclear
magnetic resonance (NMR). Imaging was made possible by Lauterbur and Mansfield,
who used magnetic field gradients to obtain spatial information [22, 23], described in
MRI has two distinct advantages over PET and CT: it uses no ionizing radiation and
provides greatly improved soft-tissue contrast. One major drawback, however, is its
relatively poor SNR. In order to boost MR signals, 1H MRI requires very large magnetic fields and relies on the high water-density of the region of interest. The latter restriction
has largely prevented MRI from being a popular diagnostic tool in lung imaging because
lung tissue is comprised mainly of gas space (Figure 2.8). Lung MRI is made more
difficult by local magnetic field gradients across tissue-air boundaries, known as
magnetic susceptibility-induced background gradients, which degrade SNR even further.
Lastly, like CT, 1H MRI samples from the lung tissue only, not from the gas spaces.
Despite these difficulties, functional lung studies with 1H MRI have been performed using molecular oxygen as a contrast-enhancing agent [24–26]. The 1H source comes from the lung tissue but is affected by the presence of oxygen, which is a paramagnetic
substance. The oxygen diffuses readily into lung tissue and shortens the T1 relaxation properties of the nearby 1H spins, a quantifiable process. The alveolar partial pressure, PAO2, can be indirectly calculated from such measurements. This technique, however, does not directly sample from the gas space in the alveoli, and requires accurate
respiratory gating and image co-registration techniques.
MR angiography (MRA) is used to acquire images of vasculature and has been adapted
for use in visualizing pulmonary vessel disorders [27]. Contrast-enhanced MRA, or
cMRA, employs blood-pool agents such as gadolinium-GTPA to highlight MR signals
pulmonary perfusion [28, 29]. However, quantitative information is difficult to obtain
because a highly non-linear relationship exists between contrast agent concentration and
MR signal.
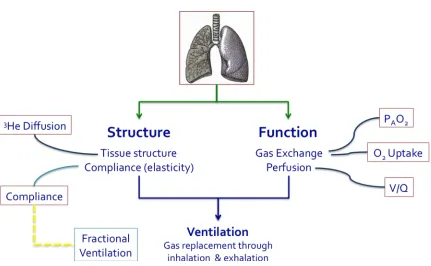
Figure 2.9. The array of structural and functional pulmonary parameters that are in principal measureable by hyperpolarized gas MRI technology.
2.4.4. Hyperpolarized gas MRI
Helium-3 (3He) and Xenon-129 (129Xe) are stable isotopes: two noble gases widely used in lung MRI. Hyperpolarized (HP) 3He was first produced in the early 1960’s using optical pumping [3, 4]. For three decades, hyperpolarized 3He was used exclusively in the field of high-energy physics as a target for nuclear scattering experiments. Then in the
distinct field with an emphasis on lung imaging, as shown in Figure 2.9. 3He and 129Xe are currently both used in the pulmonary research community, and each has distinct
advantages.
3
He is well suited for lung imaging for several reasons. It is an inert gas that can be safely
inhaled. Because it is essentially insoluble in blood, the detected MR signals originate
exclusively from gas spaces. The gyromagnetic ratio of 3He is high and polarization techniques have steadily improved over the past decade, allowing MRI with high SNR
despite the relatively low density of helium at room temperature. 3He has been used to assess ventilation dynamics in healthy and diseased human lungs. Figure 2.10 shows
single-breath HP 3He ventilation scans of a healthy human subject compared to that of a mild COPD patient showing areas of ventilation defect. The two are compared to their
corresponding 1H MR images. 3He T1 relaxation is also sensitive to the paramagnetic properties of molecular oxygen [7], a property that has been used to measure regional
partial pressure of oxygen (PO2) [42]. Lastly, the degree of restricted diffusion of 3He inside the alveolar sacs can be measured as the apparent diffusion coefficient (ADC)
using MR. This has enabled the detection of disease-driven alterations of alveolar
dimensions, e.g. in emphysema [8]. 129Xe on the other hand, is partially soluble in blood and lipids, and as a result, exhibits an anesthetic effect in humans when it reaches brain
tissue. 129Xe also exhibits a significant NMR chemical shift when moving from the gas to dissolved phase, a process that can be isolated in vivo [9] and exploited for simultaneous
advantage in that it has a natural abundance of 26%. This is in contrast to 3He, which is produced by tritium decay and is extremely rare (~10−4 abundance relative to 4He).
Healthy Subject
COPD Subject
Figure 2.10. Representative 1H and 3He MR images from a healthy volunteer and a COPD patient exhibiting areas of ventilation defect.
2.5. Magnetic Resonance Imaging
2.5.1. Brief history
The nuclear magnetic resonance (NMR) phenomenon was observed independently by
two scientists in 1946 [11]. Both scientists, Felix Bloch and Edward M. Purcell, were
awarded the Nobel Prize in Physics in 1952. Their success triggered a rapid development
of the NMR techniques in the following years. Extensive studies of the relaxation times
in a living animal came from Jackson and Langham in 1968 [12]. In 1971 Raymond
Damadian from Downstate Medical Center in Brooklyn showed that the nuclear magnetic
relaxation times of normal and tumorous tissues differed [13]. Damadian's discovery
encouraged the introduction of NMR into medicine. To complement already existing
techniques, new approaches and methods were developed. Erwin L. Hahn in 1950
introduced a method, called spin echo, whereby he applied field gradients to study
molecular diffusion in liquids [14]. Later in 1954, Carr and Purcell studied the effects of
the diffusion on the signal in nuclear magnetic resonance using magnetic field gradients
[15].
The 70's witnessed a breakthrough in the technical aspects of the NMR method. All the
experiments in the previous decades were one-dimensional, providing no spatial
information. This changed in September 1971, when Paul Lauterbur of the State
University of New York at Stony Brook applied magnetic field gradients in all 3
dimensions. He used the back-projection technique to create the first NMR images of
two water tubes, published in March 1973 [16], followed by images of living animals
[17]. The field gradients had been used before in other types of research (e.g. diffusion
studies). However, Lauterbur introduced imaging to the NMR field. He was awarded the
2003 Nobel Prize in Medicine or Physiology for his contribution to the invention of
magnetic resonance imaging.
In 1974, Richard Ernst realized that Lauterbur's back-projection is not the only method of
This led to the development in 1975 of the Fourier reconstruction method in imaging,
routinely used today [18]. Ernst received the 1991 Nobel Prize in Chemistry for his work
in Fourier Transformed NMR and MRI. Several years later, Raymond Damadian
produced the first human MRI images when he scanned the whole human body in 1977
[19]. In this same year, Peter Mansfield, leading a group of scientists in Nottingham,
England, developed the echo-planar imaging (EPI) technique and presented his first
image of the abdomen a year later. The EPI technique would be developed in later years
to produce images at real-time video rates (30 ms/frame). Mansfield shared the 2003
Nobel Prize in Medicine or Physiology for the invention of magnetic resonance imaging.
2.5.2. Fundamentals of MRI
Only atoms with an uncoupled non-zero nuclear spin (i.e., having an odd number of
protons or neutrons) are capable of producing an NMR signal. Conventional clinical MRI
utilizes the uncoupled spin of the highly abundant hydrogen nuclei that are found in water
and fat inside the human body. For nuclear spin
€
−1
2 systems such as
1
H and 3He, the net
polarization P of an ensemble of spins can be defined as:
[2.1]
where N+ and N− refer to the number of spins in the nuclear spin sublevels
€
+1 2 and
€
−1 2,
respectively. The bulk magnetization M0 of a collection of spins is:
[2.2]
MHz/T, γ(129Xe) = 11.86 MHz/T, γ(3He) = 32.44 MHz/T. We note the conventions
€
λ=2π ⋅ and
€
h=2π⋅. At a given temperature T and an external magnetic field B0, P follows a thermal equilibrium:
[2.3]
where k is the Boltzmann constant (1.38×10⁻²³
m2 kg s−2 K−1
). The approximation is valid
for all practical cases because the magnitude of the nuclear magnetic moment is
extremely small. At 300 K and 1 T, P = 3.4 × 10⁻⁶ for protons in water. This small polarization factor, in combination with the small proton magnetic moment, is the reason
why a large B0 is desirable for conventional 1H NMR and MRI. Therefore at thermal equilibrium, the magnetization per unit volume of a sample of spins is given by:
€
M ≈γ
2 h2NB0
16π2kT z ˆ [2.4]
This magnetization vector is tipped into the transverse plane to give rise to the actual
signal that is measured with MR. The time evolution of the magnetization vector can
be described by the classical Bloch equation:
€
dM dt =
M ×γB −Mx
ˆ
i +Myˆ j
T2 −
(Mz−M0) ˆ k
T1 [2.5]
Accordingly, the longitudinal magnetization (Mz) is governed by:
€
dMz dt =−
Mz−M0 T1
[2.6]
with the following general solution:
€
Mz =M0+
(
Mz(0)−M0)
⋅exp(−t /T1) . [2.7]€
dMxy
dt =−
Mxy
T2 [2.8]
with the following general solution after applying a 90˚ RF excitation, also known as the
free induction decay, FID:
€
Mxy =M0⋅exp(−t /T2). [2.9]
In above equations, T1 is the characteristic decay time of the longitudinal magnetization and T2 is the intrinsic decay time of the transverse magnetization in a uniform magnetic field. However, any background gradients G due to inhomogeneities of the static holding
field B0 further increase the decay rate of the transverse magnetization due to incoherent dephasing of the spins. In presence of a background gradient G, the signal decay is not
simply an exponential. For instance, under the influence of diffusion, the decay term has
components proportional to
€
exp(−2 3γ
2
G2Dt3), where D represents the diffusion
coefficient. In general, however, it is customary to describe the decay of the transverse
magnetization as an exponential decay with characteristic decay time T2* given by:
[2.10]
where is the additional decay rate due to the static inhomogeneities in B0. A
reasonable approximation to this additional decay rate is
€
1T 2′=γΔB0, where ΔB0 is the change in the magnetic field that occurs over the range of the sample. Equation [2.10]
implies that . Furthermore, after the magnetization has returned to equilibrium,
there can be no transverse magnetization left. Therefore, the decay time of the transverse
magnetization must be less than or equal to the longitudinal relaxation time .
. [2.11]
2.5.3. Effect of RF pulses on signal behavior
The rapid decay of the FID with decay time T2* due to field inhomogeneities can represent a great obstacle for MRI measurements. However, since these inhomogeneities
are static in nature one can recover part of the signal in a so called spin echo [14]. A
prototypical spin echo uses a θ = 180° RF refocusing pulse applied at time τ (refocusing time) after an initial RF excitation pulse. First a 90° pulse flips the longitudinal
magnetization into the transverse plane. Then the 180° refocusing pulse, flips the local
magnetization vectors about a line in the transverse plane. For instance, if the spins are
flipped about the x-axis, the individual phases φ go to −φ, whereas a spin flip about the y -axis transforms φ to 180°−φ. After the phases are conjugated, the spins whose phases were lagging behind the mean phase (those in a local environment of lower magnetic
field) are then ahead, whereas phases that were ahead of the mean phase (those in a local
environment of higher magnetic field) are then behind. Therefore, at time 2τ, the spins in a local environment of higher magnetic field will have exactly caught up with the spins in
a local environment of lower magnetic field and maximum macroscopic signal coherence
is reestablished producing an echo.
However, the intrinsic T2 decay which is due to random fluctuations in the magnetic field on a microscopic level cannot be refocused with such a spin echo, so that the maximum
recovery will be further reduced, since individual spins may have been subject to
different local fields during the dephasing (before the 180° pulse) and rephasing (after
180° pulse), and refocusing will be incomplete.
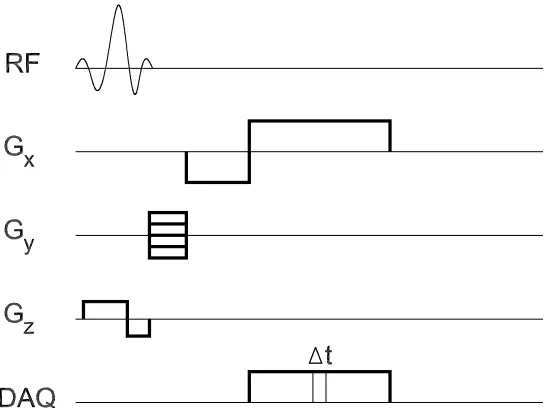
2.5.4. Using gradients to produce MR images
MRI uses the dependence of the Larmor frequency on the local field strength to convert
position information into frequency information in the MR signal. By superimposing a
linear magnetic field variation, or gradient, on top of the main magnetic field B0, the resulting MR signal will have different frequency components depending on the position
from which the signal emanates. At each location , the transverse magnetization will
rotate at a frequency given by the Larmor relation:
[2.12]
If a magnetic field gradient of an idealized form is
superimposed on the main holding magnetic field B0, the combined field in the direction is given by:
€
Bz(r )=B0+G ⋅r [2.13]
Hence the local Larmor frequency becomes:
€
ω(r )=γB0+γ
G ⋅r [2.14]
The quantity of interest is the difference Δω between the local Larmor frequency and ω0:
€
Δω ≡ ω(r )−ω0=γ
G ⋅r (2.39) [2.15]